ACPD
11, 19011–19027, 2011Lower stratospheric doppler ducted
gravity waves
Z. Li et al.
Title Page
Abstract Introduction
Conclusions References
Tables Figures
◭ ◮
◭ ◮
Back Close
Full Screen / Esc
Printer-friendly Version Interactive Discussion
Discussion
P
a
per
|
Dis
cussion
P
a
per
|
Discussion
P
a
per
|
Discussio
n
P
a
per
|
Atmos. Chem. Phys. Discuss., 11, 19011–19027, 2011 www.atmos-chem-phys-discuss.net/11/19011/2011/ doi:10.5194/acpd-11-19011-2011
© Author(s) 2011. CC Attribution 3.0 License.
Atmospheric Chemistry and Physics Discussions
This discussion paper is/has been under review for the journal Atmospheric Chemistry and Physics (ACP). Please refer to the corresponding final paper in ACP if available.
Numerical modeling of lower
stratospheric Doppler ducted gravity
waves over Jicamarca, Peru
Z. Li1, S. Naqvi1, A. J. Gerrard1, J. L. Chau2, and Y. Bhattacharya1
1
Center for Solar-Terrestrial Research, New Jersey Institute of Technology, 323 Martin Luther King Jr. Boulevard, 101 Tiernan Hall, Newark, NJ 07102-1982, USA
2
Radio Observatorio de Jicamarca, Instituto Geofisico del Peru, Lima, Peru
Received: 11 March 2011 – Accepted: 14 June 2011 – Published: 4 July 2011
Correspondence to: A. J. Gerrard ([email protected])
ACPD
11, 19011–19027, 2011Lower stratospheric doppler ducted
gravity waves
Z. Li et al.
Title Page
Abstract Introduction
Conclusions References
Tables Figures
◭ ◮
◭ ◮
Back Close
Full Screen / Esc
Printer-friendly Version Interactive Discussion
Discussion
P
a
per
|
Dis
cussion
P
a
per
|
Discussion
P
a
per
|
Discussio
n
P
a
per
|
Abstract
Persistent jet structures along zonal and meridional fields, believed to be caused by stationary gravity waves, were detected in February 1999 in MST wind measurements of the troposphere and lower stratosphere over Jicamarca, Peru. Over a seven day span, two days of observations showed signatures of a Doppler ducted gravity wave in 5
the upper troposphere/lower stratosphere. Herein we present the observations, their characteristics, and results of numerical simulations used to mimic these observed features. Though a fair replication of the observed ducted structure in the numerical model is found, the observed period of∼90 min is nonetheless longer than anticipated and raises concern as to the specific physical nature of the observed structures. How-10
ever, given the high quality of the observations, we demonstrate that continued analysis of this data set and concurrent modeling will allow for a better understanding of Doppler ducts at high spatial and temporal resolution which can ultimately be applied to studies of mesospheric ducts and bores.
1 Introduction
15
The observed behavior of mesospheric fronts, primarily in all-sky imagery utilizing mesospheric emissions of O, OH, and Na, presents a challenge to our understanding of the dynamics of the mesosphere-lower thermosphere (MLT) region. The first obser-vation of a mesospheric frontal structure, i.e., a phenomenon characterized by an in-tense wave front followed by a series of training crests and propagating in the MLT, was 20
reported in Taylor et al. (1995). Based on these observations, and inspired by the simi-larity between such airglow disturbance events and undular tidal bores in rivers, Dewan and Picard (1998) and Dewan and Picard (2001) proposed a semi-quantitative model of such a phenomena and coined the term: “mesospheric bore”. The physical basis of these structures is still a matter of investigation (Brown et al., 2004); therefore we 25
ACPD
11, 19011–19027, 2011Lower stratospheric doppler ducted
gravity waves
Z. Li et al.
Title Page
Abstract Introduction
Conclusions References
Tables Figures
◭ ◮
◭ ◮
Back Close
Full Screen / Esc
Printer-friendly Version Interactive Discussion
Discussion
P
a
per
|
Dis
cussion
P
a
per
|
Discussion
P
a
per
|
Discussio
n
P
a
per
|
observing a mesospheric front that traveled at the same altitude over 1200 kilometers without significant dissipation – thus representing a unique process of mesoscale en-ergy transport in the middle atmosphere. Snively and Pasko (2003), Snively et al. (2007), and Snively and Pasko (2008) showed that the appearance of a mesospheric front was much like the signature of a ducted gravity wave, albeit missing an intense 5
leading band. Brown et al. (2004) showed that such mesospheric fronts were asso-ciated with passing tropospheric weather fronts, likely generating gravity waves which propagated upwards and then were sustained by thermal ducts within mesospheric inversion layers (MILs) (Meriwether and Gerrard, 2004). This idea is supported by the observations of She et al. (2004) using concurrent measurements of winds and tem-10
peratures from Na lidar. Recently, Fechine et al. (2009) reported the observation of a mesospheric front in a Doppler duct (Chimonas and Hines, 1986) during the 1 October 2005 SpreadFEx campaign in South America.
To date, there is considerable uncertainty in the realms of (a) what mechanisms sus-tain mesospheric fronts (the role of thermal ducts and Doppler ducts, both separately 15
and together), (b) how a mesospheric front propagates (whether as bores (Dewan and Picard, 1998) or as ducted gravity waves (Snively et al., 2007) or as something else), (c) the potential impact of such phenomena on the MLT region in particular, and (d) mechanisms that lead to the creation of a mesospheric front. Progress in these areas is hampered by the fact that mesospheric fronts are very difficult to study due to the 20
experimental challenges associated with measurements of fundamental base-state pa-rameters of the MLT region, let alone the acquisition of synoptic-state of the MLT. Even high-resolution modeling efforts are challenging due to the myriad of physics occurring over dramatically different temporal and spatial scales.
In an effort to better answer these questions, we have turned to high resolution up-25
per tropospheric/lower stratospheric wind observations made with the mesosphere-stratosphere-troposphere (MST) radar over Jicamarca, Peru (12◦
S, 77◦
ACPD
11, 19011–19027, 2011Lower stratospheric doppler ducted
gravity waves
Z. Li et al.
Title Page
Abstract Introduction
Conclusions References
Tables Figures
◭ ◮
◭ ◮
Back Close
Full Screen / Esc
Printer-friendly Version Interactive Discussion
Discussion
P
a
per
|
Dis
cussion
P
a
per
|
Discussion
P
a
per
|
Discussio
n
P
a
per
|
The structure of these winds is indicative of stationary gravity wave structure; likely the result of climatological southeasterly or northwesterly tropospheric flow over the ter-rain generating sustained topographically generated gravity waves (as seen in Fig. 1). Thus, it was suspected that these wind fields would form a natural laboratory for the high resolution study of any Doppler-ducted gravity waves and bore-like phenomena, 5
likely generated by non-stationary or quasi-stationary sources such as tropical convec-tion.
In this paper, analysis of wave structures observed over Jicamarca – which resemble Doppler-ducted gravity waves – are presented. Features found in the data prompted us to numerically simulate the ducting of a traveling gravity wave and investigate if the 10
model results can match the observations. Based on this analysis, we suggest that similar, additional measurements of MST winds over Jicamarca can be incorporated in our model to better understand Doppler-ducted mesospheric fronts.
2 Observations
Prior MST observations (e.g., Woodman and Guillen (1974)) utilizing the Jicamarca 15
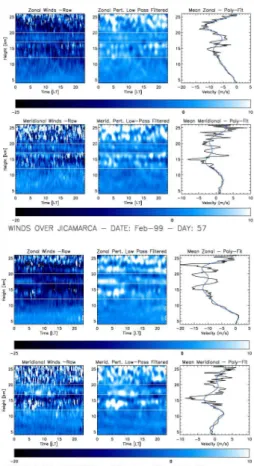
incoherent scatter radar observations above the Jicamarca incoherent scatter radar are presented and discussed in Riggin et al. (2002) and Riggin et al. (2004). The 50-MHz radar is divided into four separate antennas pointing at a 2.5◦ zenith angle in the cardinal directions. Coherent backscatter caused by irregularities in the atmospheric refractive index are collected by each antenna in the radial direction, and the first mo-20
ment of each spectra is used to determine the radial Doppler shift. The raw data are then post-processed yielding reduced zonal and meridional wind data in 2 min temporal realizations and 150 m range bins. Range-time plots of samples of these data, taken on days 57 and 59 of February 1999, are shown in Fig. 2 (left column). It is important to note that the signal-to-noise ratio varies with altitude due to shifts in the backscattered 25
ACPD
11, 19011–19027, 2011Lower stratospheric doppler ducted
gravity waves
Z. Li et al.
Title Page
Abstract Introduction
Conclusions References
Tables Figures
◭ ◮
◭ ◮
Back Close
Full Screen / Esc
Printer-friendly Version Interactive Discussion
Discussion
P
a
per
|
Dis
cussion
P
a
per
|
Discussion
P
a
per
|
Discussio
n
P
a
per
|
they are relatively more noisy.
Also shown in Fig. 2 (right column) are the daily mean zonal and meridional winds for the two sample days presented here. A fifth-order polynomial was fitted to the daily mean vertical wind profile and then subtracted from each of the individual measure-ments – the residue being the wind perturbations. These wind perturbations were then 5
low-pass filtered with filter cutoffs of 1 h and 1.5 km in the time and range domains, re-spectively, for display purposes only. The resultant low-pass filtered wind perturbations are also shown in Fig. 2 (center column).
Detailed analysis of 7 consecutive days of Jicamarca MST data from February 1999 shows four notable features. First, the winds are consistently steady over the course of 10
multiple days, with deviations being short-lived (<1 h) and comparatively weak (<5 m/s, with respect to the daily mean profile). Over the course of 3–4 consecutive days, the westerly and easterly wind jets/bands would slowly vary with altitude, but showed no coherent phase progression.
Second, vertical wind profiles of both the zonal and meridional winds across the 15
upper troposphere and lower stratosphere indicate a steady background wind super-posed with a sinusoidal variation; particularly above 10 km. Removal of the daily mean wind shows perturbations (i.e., Fig. 2, center column) that look like stationary gravity wave structure (i.e., fixed phase structure in time). Assuming that these gravity waves are stationary given their characteristic described earlier, the dispersion relationship for 20
gravity waves is used to infer the horizontal wavelength. On day 59, for instance, the dominantly zonal and easterly horizontal wind speed between 15 and 23 km altitude is estimated to be∼10 m/s, with vertical wavelength of∼7 km. Utilizing a climatological Brunt-Vaisala frequency, one can show that the horizontal wavelength is∼8 km. For day 57, the zonal background wind is weaker than the mean, with an estimated value of 25
ACPD
11, 19011–19027, 2011Lower stratospheric doppler ducted
gravity waves
Z. Li et al.
Title Page
Abstract Introduction
Conclusions References
Tables Figures
◭ ◮
◭ ◮
Back Close
Full Screen / Esc
Printer-friendly Version Interactive Discussion
Discussion
P
a
per
|
Dis
cussion
P
a
per
|
Discussion
P
a
per
|
Discussio
n
P
a
per
|
topography shown in Fig. 1, but the change in the background wind velocity with height likely leads to refraction of such gravity waves leading to modifications in the horizontal structure. Nonetheless, we see comparable horizontal wavelength values on not only these two days, but on most days in February.
Third, on two of the studied February days (Fig. 2, days 57 and day 59) there ap-5
pears to be a ductal feature consisting of alternating vertical bands with a periodicity, similar in form to that shown in the modeling results of Snively and Pasko (2003) (i.e., alternating vertical bands with a periodicity of order 10 min). Data from other days in February, even on consecutive days like day 58, did not demonstrate the pattern. The ducting structure is seen in the zonal, meridional, and vertical wind profiles, on both 10
days around 15:00 LT at approximately 15 km altitude. On day 57, the zonal variations are seen in the lowest altitude westward wind excursion from the otherwise easterly wind profile, which corresponds to a northward wind excursion in the meridional wind profile. On day 59, the zonal variations are seen in the lowest altitude eastward wind excursion from the otherwise easterly wind profile, which corresponds to a southward 15
wind excursion in the meridional wind profile; opposite that observed on day 57. In Fig. 3 we show a closeup of the ductal feature seen in the afternoon on day 57, without any filtering, though we note that ducting signatures were also seen earlier in the day. The observed ducted waves in the westerly jet at 16 km altitude have an observed (residual) horizontal amplitude between 3–5 m/s and an observed period of 20
∼90 min. An estimate of the zonal (and meridional and vertical, not shown) wind power spectral density indicate that the feature is not monochromatic (although there is a local peak in the PSD at approximately 72 min) and instead resembles the PSD of a “square wave,” indicating potential amplitude saturation or mode mixing. Any apparent propagation direction and speed could not be determined. These results are consistent 25
with analysis done with data on day 59, but at 14 km altitude.
ACPD
11, 19011–19027, 2011Lower stratospheric doppler ducted
gravity waves
Z. Li et al.
Title Page Abstract Introduction Conclusions References Tables Figures ◭ ◮ ◭ ◮ Back Close
Full Screen / Esc
Printer-friendly Version Interactive Discussion Discussion P a per | Dis cussion P a per | Discussion P a per | Discussio n P a per |
period of∼4 h. No similar traveling wave signatures were seen on the other days.
3 Numerical model
Combining the features seen in the second and third set of observations, we propose that the observations constitute a Doppler-ducted gravity wave, sustained by the steady easterly or westerly phases of the zonal and meridional wind profiles. To explore this 5
idea further, we have developed a time-stepped two-dimensional (spatial x-horizontal and z-vertical domains) numerical model similar to Snively and Pasko (2003), to exam-ine the conditions in the upper troposphere/lower stratosphere that would allow the oc-currence of such a ducting event. The model structure follows the frame work for imple-menting high-resolution Godunov-type methods (LeVeque , 2003), and is implemented 10
within the CLAWPACK software package (http://www.amath.washington.edu/∼claw). The model is similar to the one by Ahmad and Lindeman (2007), which assumes that the atmosphere is represented by an ideal, dry, inviscid gas. The basic governing equations for atmospheric flows are given by conservation of mass, momentum, energy and equation of state, which can be simplified to the following 2D Euler equations: 15 ∂U ∂t + ∂F ∂x+ ∂G
∂y =Q (1)
with U= ρ ρu ρv ρθ F= ρu ρu2+p
ρuv ρuθ G= ρv ρuv ρv2+p
ρvθ Q= 0 0 −ρg+Fs
0
ACPD
11, 19011–19027, 2011Lower stratospheric doppler ducted
gravity waves
Z. Li et al.
Title Page
Abstract Introduction
Conclusions References
Tables Figures
◭ ◮
◭ ◮
Back Close
Full Screen / Esc
Printer-friendly Version Interactive Discussion
Discussion
P
a
per
|
Dis
cussion
P
a
per
|
Discussion
P
a
per
|
Discussio
n
P
a
per
|
whereρ is the atmosphere density, u is the horizontal velocity along the x-direction,
v is the vertical velocity along the z-direction, p is the pressure, θ is the potential temperature, and F is a forcing function in the vertical (Andrews et al., 1987). This set of equations is hyperbolic in nature and we adapt a Godunov-type scheme for hyperbolic conservation laws suggested by LeVeque (2003), employing flux-based 5
wave decompositions proposed by Ahmad and Lindeman (2007) to solve the Riemann problems.
The uppermost height of domain simulation is chosen to be 220 km with a sponge layer spanning from 200 km to 220 km. The sponge is thus at a much higher than the altitude that we are interested in modeling; such a configuration was selected to 10
maximally reduce gravity wave reflection from the top model layer and therefore ensure an open boundary condition for the simulation. The horizontal extent of the numerical domain is 1200 km with a 100 km thick sponge layer at both sides –again for open boundary considerations. The vertical and horizontal model resolutions are 0.25 km and 1 km, respectively, and the nominal time-step is chosen to satisfy the Courant 15
parameter. Model output was recorded every 5 s.
The atmospheric background state parameters were specified at the beginning of the run and not allowed to vary in time. An isothermal background temperature was used in this simulation, with T =300 K (and correctly converted to potential temperature,
θ). Such a temperature background removes any potential for thermal ducting, thus 20
allowing us to focus on only Doppler ducting. For this simulation we have run the model with two different zonal wind profiles. The first was a windless run that serves as a control run. The second wind profile was also windless, except for Gaussian-shaped jet of maximum amplitude of−15 m/s, centroid altitude of 15 km, 1-σ vertical width of 4 km, and which filled the horizontal domain, based on the wind observations shown in 25
Fig. 2.
ACPD
11, 19011–19027, 2011Lower stratospheric doppler ducted
gravity waves
Z. Li et al.
Title Page
Abstract Introduction
Conclusions References
Tables Figures
◭ ◮
◭ ◮
Back Close
Full Screen / Esc
Printer-friendly Version Interactive Discussion
Discussion
P
a
per
|
Dis
cussion
P
a
per
|
Discussion
P
a
per
|
Discussio
n
P
a
per
|
in space and time (σt,σx,σz). The source took the mathematical form of
Fs(x,z,t)=F0exp(−
(x−x0)2
2σx2 −
(z−z0)2
2σz2 −
(t−t0)2
2σt2 )cos(kxx)cos(ωt) (2)
and was located atx0andz0of 450 km and 3 km, respectively. The horizontal, vertical, and temporal scales of the disturbance were 10 km, 2 km, and 5.86 min (approximately the Brunt-Vaisala frequency), respectively. The initial amplitude disturbance was equiv-5
alent to a 1.2 cm/s vertical wind, and the horizontal wavelength and period were initially set to 20 km and 10 min, respectively.
Results of the two model runs are shown in Fig. 4. For the control run (right column) we model an upwards propagating gravity that extends well into the upper atmosphere. There is no indication of any ducting structures. For the run with a westward, Gaussian-10
shaped jet centered at 15 km (left column), we clearly see ducted waves of 85.4 % of the initial source at time 16 000 s, an observed horizontal wavelength of∼20 km, and propagation to the east with an observed speed of∼15 m/s. We note that the peaks have an amplitude that is modulated by a broad Gaussian envelope, much like the observations, which is imposed by the source term expression. A change of this source 15
term expression can likewise modulate the peak amplitudes.
If observed from a fixed site, the simulated ducted structure would have a period of ∼22 min – approximately a fourth as much as the period of the ductal-feature observed over Jicamarca. In an effort to match the observed period, we undertook a number of modeling runs that used various configurations of the above parameters. Generally, we 20
saw that changing the model source parameters (i.e., the horizontal wavenumber and period by factors of up to 3) did not dramatically alter the observed period of the ducted wave. However, changing the width of the wind jet did modify the ductal structure, with a narrower duct resulting in a slower progressing wave packet and thus a longer observed wave period. A wind jet with a RMS width of 1 km resulted in a ducted feature 25
ACPD
11, 19011–19027, 2011Lower stratospheric doppler ducted
gravity waves
Z. Li et al.
Title Page
Abstract Introduction
Conclusions References
Tables Figures
◭ ◮
◭ ◮
Back Close
Full Screen / Esc
Printer-friendly Version Interactive Discussion
Discussion
P
a
per
|
Dis
cussion
P
a
per
|
Discussion
P
a
per
|
Discussio
n
P
a
per
|
Chimonas and Hines (1986).
4 Discussion and conclusions
Based on our modeling analysis, when a traveling gravity wave impinges on a spatially confined wind jet (i.e., a Doppler duct), Doppler-mode ducting of the gravity wave is served in our numerical model. Comparison of the model output with the Jicamarca ob-5
servations provides evidence that we are observing the signature of a Doppler-ducted gravity wave within the sinusoidal wind variations of the upper troposphere/lower strato-sphere.
While the model results do replicate the observations quite well, there are nonethe-less important aspects of the observations that need to be resolved. The first is-10
sue deals with resolving the meteorology of the upper troposphere/lower stratosphere above Jicamarca. A better determination needs to be made as to whether the vertically-varying sinusoidal variations in the background wind are indeed due to stationary grav-ity waves, or long-period Kelvin waves, or perhaps due to convective rolls. Given the topology of the terrain surrounding Jicamarca, we have assumed that it was a station-15
ary gravity wave but further studies and reverse gravity wave ray-tracing are needed to confirm this.
The second issue deals with identifying the source of the observed Doppler-ducted gravity waves. Data from day 57 indicate a traveling gravity wave may have “seeded” the duct, but no such traveling gravity wave signature was present on day 59. Further-20
more, seeing that the ducted structure was observed at approximately the same time of day for both observations presented here, there may be a diurnal heating mechanism responsible for the ducted wave “seeding.”
The third and most important issue deals with the broader question of whether or not a Doppler-ducted feature was really observed. That is, the spatially confined period-25
ACPD
11, 19011–19027, 2011Lower stratospheric doppler ducted
gravity waves
Z. Li et al.
Title Page
Abstract Introduction
Conclusions References
Tables Figures
◭ ◮
◭ ◮
Back Close
Full Screen / Esc
Printer-friendly Version Interactive Discussion
Discussion
P
a
per
|
Dis
cussion
P
a
per
|
Discussion
P
a
per
|
Discussio
n
P
a
per
|
certainly needs to be considered, especially considering that this initial study involved the use of a limited data sample from the larger MST data set. Further studies are re-quired to study this extensive dataset and better characterize the occurrences of these features.
Should these three issues be satisfactorily resolved, the upper troposphere/lower 5
stratosphere environment above a location such as Jicamarca would be an ideal natu-ral laboratory to study Doppler ducting phenomena, including gravity wave ducting and potential “bore” formation in Doppler ducts. The steady winds provide excellent dynam-ical ducts for extended periods of time and the equatorial location provides a plethora of convective gravity wave sources. Furthermore, the excellent signal-to-noise ratio 10
from the Jicamarca MST system, combined with radiosonde data and meteorological diagnostics, would allow for a detailed study of the physics of ducting, including duct-coupling and “kissing modes.” These unique factors should motivate further modeling efforts and observations.
Acknowledgements. The authors would like to thank Ronald Woodman for both taking this data 15
set and for his constructive comments. We also thank the personnel of the Radio Observatorio de Jicamarca for their assistance in collecting and preparing this data set. We very much appreciate the helpful comments of the reviewers of this paper. This work was supported by grants from the National Science Foundation (NSF-ATM-0735452 and NSF-ATM-0457277).
References
20
Ahmad, N. and Lindeman, J.: Euler solutions using flux-based wave decomposition, Int. J. Num. Meth. Fluid., 54, C72, 2007. 19017, 19018
Andrews, D. G., Holton, J. R., and Leovy, C. B.: Middle Atmosphere Dynamics, Academic Press, New York, USA, 175–187, 1987. 19018
Brown, L. B., Gerrard, A. J., Meriwether, J. W., and Makela, J. J.: All-sky imaging observations 25
ACPD
11, 19011–19027, 2011Lower stratospheric doppler ducted
gravity waves
Z. Li et al.
Title Page
Abstract Introduction
Conclusions References
Tables Figures
◭ ◮
◭ ◮
Back Close
Full Screen / Esc
Printer-friendly Version Interactive Discussion
Discussion
P
a
per
|
Dis
cussion
P
a
per
|
Discussion
P
a
per
|
Discussio
n
P
a
per
|
Chimonas, G. and C. O. Hines: Doppler Ducting of Atmospheric Gravity Waves, J. Geophys. Res., 91, 1219–1230, 1986. 19013, 19020
Dewan, E. M. and Picard, R. H.: Mesospheric bores, J. Geophys. Res. 103, 6295–6306, 1998. 19012, 19013
Dewan, E. M. and Picard, R. H.: On the origin of mesospheric bores, J. Geophys. Res., 106, 5
C2927, doi:10.1029/2000JD900697, 2001 19012
Fechine, J., Wrasse, C. M., Takahashi, H., Medeiros, A. F., Batista, P. P., Clemesha, B. R., Lima, L. M., Fritts, D., Laughman, B., Taylor, M. J., Pautet, P. D., Mlynczak, M. G., and Russell, J. M.: First observation of an undular mesospheric bore in a Doppler duct, Ann. Geophys. 27, 1399–1406, doi:10.5194/angeo-27-1399-2009, 2009. 19013
10
LeVeque, R. J.: Clawpack version 4.2 user’s guide, Technical Report, University of Washington, USA, http://www.amath.washington.edu/claw, 2003. 19017, 19018
Meriwether, J. W. and Gerrard, A. J.: Mesosphere inversion layers and stratosphere tempera-ture enhancements, Rev. Geophys., 42, RG3003, doi:10.1029/2003RG000133, 2004. 19013 Riggin, D. M., Kudeki, E., Feng, Z.,. Sarango, M. F, and Lieberman, R. S.: Jicamarca radar 15
observations of the diurnal and semidiurnal tide in the troposphere and lower stratosphere. J. Geophys. Res., 107, 4062, doi:10.129/2001JD001216, 2002. 19014
Riggin, D. M., Kudeki, E., and Sarango, M.: Tropospheric and stratospheric momentum flux measurements from radar wind data collected at Jicamarca, J. Atmos. Solar-Terr. Phys., 66, 277–283, 2004. 19014
20
She, C. Y., Li, T., Williams, B. P., Yuan, T., and Picard, R. H.: Concurrent OH imager and sodium temperature/wind lidar observation of a mesopause region undular bore event over Fort Collins/Platteville, Colorado, J. Geophys. Res. 109, 22107–22115, 2004. 19013 Snively, J. B. and Pasko, V. P.: Breaking of thunderstorm-generated gravity waves as a source
of short-period ducted waves at mesopause altitudes, Geophys. Res. Lett., 30(24), 2254, 25
doi:10.1029/2003GL018436, 2003. 19013, 19016, 19017
Snively, J. B., Pasko, V. P., Taylor, M. J., and Hocking, W. K.: Doppler ducting of short period gravity waves by mid-latitude tidal wind structure, J. Geophys. Res. 112, A03304, doi:10.1029/2006JA011895, 2007. 19013
Snively, J. B. and Pasko, V. P.: Excitation of Mesospheric Gravity Waves by Tropospheric 30
Sources, J. Geophys. Res. 113, A06303, doi:10.1029/2007JA012693, 2008. 19013
Geo-ACPD
11, 19011–19027, 2011Lower stratospheric doppler ducted
gravity waves
Z. Li et al.
Title Page
Abstract Introduction
Conclusions References
Tables Figures
◭ ◮
◭ ◮
Back Close
Full Screen / Esc
Printer-friendly Version Interactive Discussion
Discussion
P
a
per
|
Dis
cussion
P
a
per
|
Discussion
P
a
per
|
Discussio
n
P
a
per
|
phys. Res. 108, 1083–1101, 2003. 19012
ACPD
11, 19011–19027, 2011Lower stratospheric doppler ducted
gravity waves
Z. Li et al.
Title Page
Abstract Introduction
Conclusions References
Tables Figures
◭ ◮
◭ ◮
Back Close
Full Screen / Esc
Printer-friendly Version Interactive Discussion
Discussion
P
a
per
|
Dis
cussion
P
a
per
|
Discussion
P
a
per
|
Discussio
n
P
a
per
|
Horizontal Distance
ACPD
11, 19011–19027, 2011Lower stratospheric doppler ducted
gravity waves
Z. Li et al.
Title Page
Abstract Introduction
Conclusions References
Tables Figures
◭ ◮
◭ ◮
Back Close
Full Screen / Esc
Printer-friendly Version Interactive Discussion
Discussion
P
a
per
|
Dis
cussion
P
a
per
|
Discussion
P
a
per
|
Discussio
n
P
a
per
|