www.atmos-chem-phys.net/10/4537/2010/ doi:10.5194/acp-10-4537-2010
© Author(s) 2010. CC Attribution 3.0 License.
Chemistry
and Physics
Coupling aerosol surface and bulk chemistry with a kinetic double
layer model (K2-SUB): oxidation of oleic acid by ozone
C. Pfrang1,2, M. Shiraiwa2, and U. P¨oschl2
1University of Reading, Department of Chemistry, P. O. BOX 224, Whiteknights, Reading RG6 6AD, UK 2Max Planck Institute for Chemistry, Biogeochemistry Department, 55128 Mainz, Germany
Received: 28 October 2009 – Published in Atmos. Chem. Phys. Discuss.: 15 December 2009 Revised: 12 April 2010 – Accepted: 25 April 2010 – Published: 18 May 2010
Abstract.We present a kinetic double layer model coupling aerosol surface and bulk chemistry (K2-SUB) based on the PRA framework of gas-particle interactions (P¨oschl-Rudich-Ammann, 2007). K2-SUB is applied to a popular model system of atmospheric heterogeneous chemistry: the inter-action of ozone with oleic acid. We show that our modelling approach allows de-convoluting surface and bulk processes, which has been a controversial topic and remains an impor-tant challenge for the understanding and description of at-mospheric aerosol transformation. In particular, we demon-strate how a detailed treatment of adsorption and reaction at the surface can be coupled to a description of bulk reaction and transport that is consistent with traditional resistor model formulations.
From literature data we have derived a consistent set of ki-netic parameters that characterise mass transport and chem-ical reaction of ozone at the surface and in the bulk of oleic acid droplets. Due to the wide range of rate coefficients re-ported from different experimental studies, the exact propor-tions between surface and bulk reaction rates remain uncer-tain. Nevertheless, the model results suggest an important role of chemical reaction in the bulk and an approximate upper limit of∼10−11cm2s−1for the surface reaction rate coefficient. Sensitivity studies show that the surface accom-modation coefficient of the gas-phase reactant has a strong non-linear influence on both surface and bulk chemical reac-tions. We suggest that K2-SUB may be used to design, inter-pret and analyse future experiments for better discrimination
Correspondence to:C. Pfrang ([email protected])
between surface and bulk processes in the oleic acid-ozone system as well as in other heterogeneous reaction systems of atmospheric relevance.
1 Introduction
Atmospheric aerosols are highly variable components of the Earth system that have a substantial impact on the hydro-logical cycle and climate (Rosenfeld, 2000; Charlson et al., 2001; Ramanathan et al., 2001; Breon et al., 2002; Penner et al., 2004, Andreae et al., 2004; P¨oschl, 2005; Fuzzi et al., 2006; Bergstrom et al., 2007, Choularton et al., 2008; An-dreae and Rosenfeld, 2008). Thus, full understanding of the properties and transformation of aerosol particles is of key importance for atmospheric science.
The oxidation of organic substances in the atmosphere is predominantly initiated by hydroxyl radicals (OH), nitrate radicals (NO3)and ozone (O3)(Wayne, 2000). While atmo-spheric lifetimes of volatile organic compounds are largely determined by the rate coefficients of the chemical reactions with OH, NO3, and O3 (e.g. King et al., 1999; Pfrang et al., 2006a, b, 2007 and 2008), mass transport parameters are important additional factors for organic aerosol components. Chemical reactions can occur at the surface and in the bulk of aerosol particles, and the rates and relative proportions of surface and bulk reactions are hardly known.
usefulness of this approach is limited with regard to multi-component systems and transient conditions.
To overcome these limitations, P¨oschl et al. (2007) have developed a kinetic flux modelling approach (PRA frame-work) which enables a consistent and flexible treatment of aerosol chemistry and gas-particle interactions, including mass transport and chemical reactions in multiphase and multi-component systems. Springmann et al. (2009) demon-strated the applicability and usefulness of the PRA frame-work in an urban plume box model of the degradation of benzo[a]pyrene on soot by ozone and nitrogen dioxide. Shi-raiwa et al. (2009) showed that the PRA approach can be ef-ficiently applied to other polycyclic aromatic hydrocarbons (PAHs) and photo-oxidants (O3, NO2, OH and NO3)with multiple types of parallel and sequential surface reactions us-ing a kinetic double-layer model (K2-SURF).
De-convolution of competing surface and bulk processes is essential for a detailed understanding of aerosol transfor-mation and ageing. A well studied model system for atmo-spherically relevant heterogeneous reactions is the interac-tion of oleic acid with atmospheric trace gases, in particu-lar O3(e.g. Smith et al., 2002; Hearn et al., 2005; Grimm et al., 2006; Reynolds et al., 2006; Hung and Ariya, 2007; Gonzalez-Labrada et al., 2007; Hearn and Smith, 2007; Lee and Chan, 2007; Voss et al., 2007; Zahardis and Petrucci, 2007; King et al., 2008, 2009, 2010; Vesna et al., 2008a, b, 2009; Sage et al., 2009; Last et al., 2009).
Despite intense research efforts to fully understand the oleic acid–ozone system, there remain large uncertainties documented in the wide range of reported uptake coeffi-cients varying by nearly four orders of magnitude (see Ta-ble 1). There is also controversy on the relative importance of bulk and surface processes (compare e.g. Hearn et al., 2005). Here we demonstrate how the competing surface and bulk processes can be de-convoluted with a kinetic double layer model coupling surface and bulk chemistry (K2-SUB).
2 Modelling approach
Our kinetic double-layer model coupling aerosol surface and bulk chemistry (K2-SUB) builds on the PRA framework (P¨oschl et al., 2007) and uses the same terminology. For def-initions and detailed explanation of symbols see Appendices A and B as well as P¨oschl et al. (2007). The mass balance for a reactive liquid-phase species Y (e.g. oleic acid) can be expressed as
dNy
dt =
dNy,ss
dt +
dNy,b
dt =
d[Y]ss
dt ×Ass+ d[Y]b
dt ×Vb(1)
withNy being the total number of Y molecules; Ny,ss and
Ny,bare the numbers of molecules in surface and bulk; [Y]ss and [Y]bthe surface and bulk concentrations of Y; andAss andVbbeing surface area and bulk volume of the particle.
Expressed in fluxes:
d[Y]ss
dt = Jb,ss,Y−Jss,b,Y−Lss,Y (2)
and
d[Y]b
dt = Jss,b,Y−Jb,ss,Y
×Ass
Vb +
Lb,Y (3)
with the terms Lss,Y and Lb,Y representing the chemical loss of Y in surface and bulk; Jb,ss,Y = kb,ss,Y×[Y]b and
Jss,b,Y = kss,b,Y×[Y]ss are the fluxes of bulk-surface and surface-bulk mass transport, respectively.
The uptake coefficient of a gas-phase species X (e.g. O3),
γx, is defined by
γx =
Jads,X−Jdes,X
Jcoll,X
(4) whereJads,XandJdes,Xare fluxes of adsorption and desorp-tion of X andJcoll,Xcorresponds to the gas kinetic flux of X molecules colliding with the surface
Jcoll,X =
[X]gsωx
4 . (5)
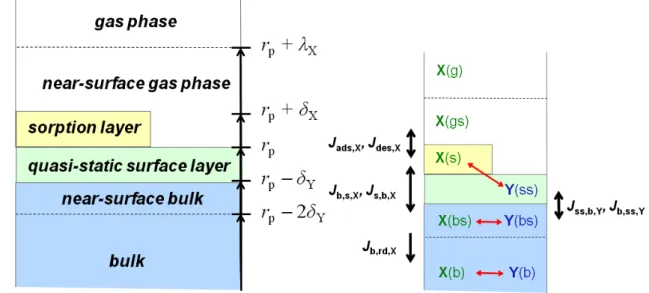
[X]gs is the gas phase concentration of X near the surface. For low values ofγxand small particles (high Knudsen num-ber,Knx=λxrp−1withλxcorresponding to the mean free path of X andrpbeing the particle radius), [X]gsequals the aver-age gas phase concentration [X]g. In case of high uptake and large particles, the rate of gas uptake can be limited by gas-phase diffusion. Differences between [X]gsand [X]gcan be described by a diffusion correction factor (Cg,X)as detailed by P¨oschl et al. (2007). Figure 1 illustrates the structure of the kinetic double-layer model (K2-SUB) presented here.
Assuming steady-state we obtain the following mass bal-ance equation for X at the surface:
Jads,X−Jdes,X−Js,b,X+Jb,s,X−Ls,X = 0 (6) Assuming near-planar geometry of the surface, the flux of chemical loss of X in the sorption layer,Ls,X, can be equated
to the chemical loss of Y in the surface,Lss,Y:
Ls,X =kSLR,X,Y[X]s[Y]ss = ks,X×[X]s = Lss,Y. (7)
kSLR,X,Y is the second-order rate coefficient for the sur-face layer reactions between X and Y andks,X is the cor-responding pseudo-first order reaction rate coefficient. For very small particles where the surface curvature is strong on molecular scales, Eq. (7) could be corrected by the ratio of sorption layer and quasi-static surface areas. The concentra-tion of X at the surface, [X]s, is given by (terms are defined in Appendices A and B):
[X]s = [SS]ss
Kads′ ,X[X]gs
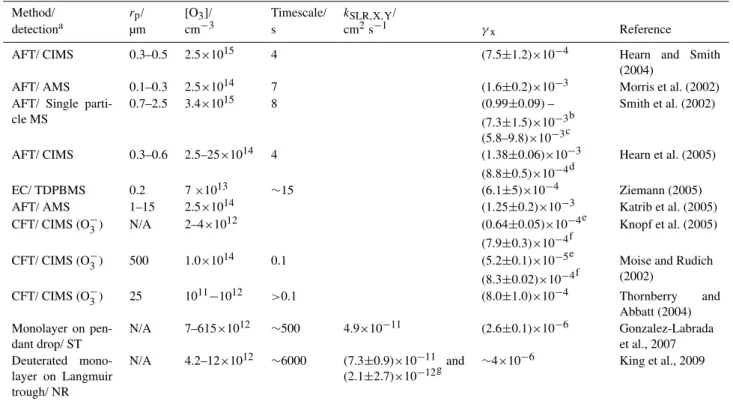
Table 1.Experimental conditions and results of laboratory studies investigating the reactive uptake of ozone by oleic acid (compare Tables 1 and 2 in Zahardis and Petrucci, 2007; Gonzalez-Labrada et al., 2007 and King et al., 2009).
Method/ rp/ [O3]/ Timescale/ kSLR,X,Y/
detectiona µm cm−3 s cm2s−1 γx Reference
AFT/ CIMS 0.3–0.5 2.5×10¹⁵ 4 (7.5±1.2)×10−4 Hearn and Smith
(2004)
AFT/ AMS 0.1–0.3 2.5×10¹⁴ 7 (1.6±0.2)×10−3 Morris et al. (2002) AFT/ Single
parti-cle MS
0.7–2.5 3.4×10¹⁵ 8 (0.99±0.09) –
(7.3±1.5)×10−3b (5.8–9.8)×10−3c
Smith et al. (2002)
AFT/ CIMS 0.3–0.6 2.5–25×1014 4 (1.38±0.06)×10−3 (8.8±0.5)×10−4d
Hearn et al. (2005)
EC/ TDPBMS 0.2 7×10¹³ ∼15 (6.1±5)×10−4 Ziemann (2005)
AFT/ AMS 1–15 2.5×10¹⁴ (1.25±0.2)×10−3 Katrib et al. (2005)
CFT/ CIMS (O−3) N/A 2–4×10¹² (0.64±0.05)×10−4e (7.9±0.3)×10−4f
Knopf et al. (2005)
CFT/ CIMS (O−3) 500 1.0×10¹⁴ 0.1 (5.2±0.1)×10−5e (8.3±0.02)×10−4f
Moise and Rudich (2002)
CFT/ CIMS (O−3) 25 1011−1012 >0.1 (8.0±1.0)×10−4 Thornberry and Abbatt (2004) Monolayer on
pen-dant drop/ ST
N/A 7–615×1012 ∼500 4.9×10⁻¹¹ (2.6±0.1)×10−6 Gonzalez-Labrada et al., 2007 Deuterated
mono-layer on Langmuir trough/ NR
N/A 4.2–12×1012 ∼6000 (7.3±0.9)×10−11 and (2.1±2.7)×10−12g
∼4×10⁻⁶ King et al., 2009
aAFT: aerosol flow tube; CIMS: chemical ionisation mass spectrometry; CFT: coated flow tube; AMS: aerosol mass spectrometry; EC:
environmental chamber; TDPBMS: thermal desorption particle beam mass spectrometry; MS: mass spectrometry; ST: surface tension mea-surement; NR: neutron reflectometry.
bThis corresponds to a radii range of monodisperse particles respectively from 2.45 µm to 680 nm with other values for different diameter
particles given in the original work.
cThese are the corrected values when accounting for the diffusion of oleic acid; see original work for more details. dThis is a corrected value accounting for oleic acid loss via secondary chemistry; see the original work for more details. eThis value is for solid-phase oleic acid; see the original work for more details.
fThis value is liquid-phase oleic acid; see the original work for more details.
gTwo branches have been reported with the the dominating branch (branching ratio 0.86) being the faster reaction which leads to formation
of surface active products (see King et al., 2009 for more details).
Under steady-state conditions, the reacto-diffusive flux of X in the particle bulk (Jb,rd,X)can be related to the flux of bulk-surface and bulk-surface-bulk transfer of X in the sorption layer (Jb,s,XandJs,b,X)by the following equation
Jb,rd,X = Js,b,X−Jb,s,X. (9)
Jb,rd,Xcan be re-written as
Jb,rd,X = Cb,rd,X p
kb,XDb,X[X]bs. (10) Provided that the interfacial mass transfer proceeds faster than the chemical loss of X, the near-surface bulk concen-tration [X]bscan be approximated by
[X]bs =Ksol,cp,XRT[X]gs. (11) The pseudo-first order loss rate coefficientkb,Xis given by
kb,X = kBR,X,Y×[Y]b (12)
withkBR,X,Y corresponding to the second-order bulk reac-tion rate coefficient (the other parameters from Eq. (10) are defined in Appendices A and B).Jb,rd,Xthus represents both diffusion and reactive loss of X in the particle bulk.
Assuming that the chemical loss of X equals the chemical loss of Y (stoichiometric coefficients of unity) we can write
Lb,Y = Jb,rd,X×
Ass
Vb
. (13)
Fig. 1. Kinetic double-layer surface model (K2-SUB):(a)model compartments and distances from the particle centre;(b)model species, transport fluxes (black arrows) and chemical reactions (red arrows).rpis the particle radius,δXandδYare the effective molecular diameters
and molecular layer thicknesses for volatile species X and non-volatile species Y, respectively;λxis the mean free path of X in the gas phase.
above (Sect. 1, Table 1). Thus, we do not explore this as-pect in the present study.
By inserting Eqs. (7), (10) and (13) into Eqs. (1), (2) and (3) we obtain
dNy,ss
dt =
d[Y]ss
dt ×Ass = {kb,ss,Y×[Y]b−kss,b,Y×[Y]ss
−kSLR,X,Y[X]s[Y]ss} ×Ass (14) and
dNy,b
dt =
d[Y]b
dt ×Vb = {kss,b,Y×[Y]ss−kb,ss,Y×[Y]b
−Cb,rd,X p
kb,XDb,X[X]bs} ×Ass. (15) Thus
d[Y]b
dt = {kss,b,Y×[Y]ss−kb,ss,Y×[Y]b
−Cb,rd,X p
kb,XDb,X[X]bs} ×
Ass
Vb
, (16)
and for a spherical particle with a radius much larger than the effective molecular diameter of Y (rp≫δY)
d[Y]b
dt = {kss,b,Y×[Y]ss−kb,ss,Y×[Y]b
−Cb,rd,X p
kb,XDb,X[X]bs} × 3
rp
(17) Under steady-state conditions, using Eqs. (4), (6) and (9) the uptake coefficient can be described as
γx =
Jb,rd,X+Ls,X
Jcoll,X
. (18)
This expression can be re-formulated in the popular resistor model approach (compare P¨oschl et al., 2007; Eqs. 105–124) as sum of resistance terms
1
γx= 1
αs,X+
1
αs,Xkks,X
d,X+
1
1
αs,Xkks,b,X d,X
+ 1
αs,X ks,b,X
kd,X
Cb,X√kb,XDb,X kb,s,X
(19)
or by inserting inverse resistance (conductance) terms 1
γx = 1
αs,X+
1
Ŵs,X+ 1 1 Ŵs,b,X+
1 Ŵb,X
(20)
with conductance terms for surface reaction of X,
Ŵs,X =
4ka,Xks,X
kd,Xωx
, (21)
for surface-bulk transfer of X
Ŵs,b,X = αs,X
ks,b,X
kd,X
, (22)
and for particle bulk diffusion and reaction of X
Ŵb,X = 4
ωx
Ksol,cp,XRT Cb,rd,X p
detail in Appendix C. Please note that the advantage of the K2-SUB approach is that we are not limited to special cases, i.e. we can describe any combination of surface and bulk re-actions and transport at any reactivity ratio. K2-SUB pro-vides a general set of equations that describe all physico-chemical processes involved. It enables free variation of all relevant parameters in particular mass transfer and reaction rate coefficients. It thus can describe limiting cases as well as any state in between depending on the investigated reaction systems, conditions and rate parameters. The added flexibil-ity compared to previous approaches also facilitates descrip-tion of Langmuir-Hinshelwood- and Eley-Rideal-type reac-tion mechanisms.
3 Derivation of kinetic parameters for the oxidation of oleic acid particles by ozone
In this study we have focused on the simulation of ex-perimental data from Ziemann (2005), who reported time-resolved concentration data of oleic acid in fine droplets (rp= 0.2 µm) interacting with ozone at a fixed gas-phase con-centration level ([X]gs = 6.95×1013cm−3corresponding to 2.8 ppm). Unfortunately, many other studies have reported changes in concentration only as a function of ozone expo-sure (product of ozone concentration and time), which is less suitable for detailed process modelling. For consistent de-scription and comparison of surface, bulk and total amounts of oleic acid in the investigated particles, we have multi-plied the volume concentrations reported by Ziemann (2005) with the particle volume (Vp= 4/3π rp3)to obtain the absolute number of molecules.
For the initial concentration of pure oleic acid we took [Y]b,0= 1.21×1021cm−3corresponding to 3.15 mol L−1as reported by Ziemann (2005). From the concentration of the pure substance we derived an approximate value for the ef-fective molecular diameter of oleic acid,δY:
[Y]b,0≈ 1
δY3. (24)
FromδY≈0.8 nm we obtained an approximate value for the effective molecular cross-sectionσy≈δ2Y≈0.064 nm2. The initial surface concentration of oleic acid ([Y]ss,0)was ob-tained from the relation
[Y]ss,0 = δY×[Y]b,0. (25)
Values forkb,ss,Y andkss,b,Yare derived by considering the average distance travelled by molecules diffusing in one di-rection (Atkins, 1998):
p
x2 = r
4Dbt
π , (26)
withx corresponding to a distance the molecule needs to travel (this equalsδY, in our case 0.8 nm) andDbbeing the diffusion coefficient (for oleic acid Db,Y is assumed to be
10−10cm2s−1; this corresponds to the lowest value assumed by Smith et al. (2003) when testing possible effects of slow diffusion in pure oleic acid droplets). For a droplet of 200 nm there is no oleic acid concentration gradient to be expected in the droplet since the small droplets can be assumed to be well mixed (Smith et al., 2002). For larger droplets a diffusion correction has been suggested (Smith et al., 2003), and this aspect is further explored in a follow-up study (Shiraiwa et al., 2010). An oleic acid molecule would take approximately 50 µs to travel the distance ofδY, so that we obtain a “trans-port velocity” (kb,ss,Y)of 1.6×10⁻³cm s−1. This transport velocity can be related tokss,b,Yby
kb,ss,Y×[Y]b,max = kss,b,Y×[Y]ss,max. (27) The surface concentration is assumed to be limited by the number of surface sites with
[Y]ss,max = 1
δ2Y =1.56×10
14
cm−2 (28)
and [Y]b,max =
1
δY3 = 1.95×10
21
cm−3. (29)
We thus obtain a value forkss,b,Yof 1.99×10⁴s−1.
The same line of thought presented for the oleic acid transport velocity (kb,ss,Y)was followed to derive the trans-port velocity for ozone (kb,s,X). Using a diffusion coeffi-cient for ozone (Db,X)in organic solvents of 10−5cm2s−1 (Smith et al., 2002, 2003) andδX for ozone of 0.4 nm (de-rived from Eq. (28) with a value for surface sites for ozone of 5.7×1014cm−2reported by P¨oschl et al., 2001; compare also a computational study by Vieceli et al., 2004), we obtain from Eq. (26) thatkb,s,Xis 318 cm s−1.
ks,b,X however can be expected to be substantially differ-ent from kss,b,Y. As opposed to kb,s,X, kb,ss,Y and kss,b,Y, ks,b,X is not isotropic and the ozone molecules will expe-rience forces significantly different from those expeexpe-rienced by the oleic acid molecules. We thus derivedks,b,X by fit-ting the value ofKsol,cp,X to match the literature value of Henry’s law coefficient (Hcp,X= 4.8×10⁻⁴mol cm−3atm−1; e.g. Smith et al., 2002; King et al., 2009). The two other pa-rameters affectingKsol,cp,Xin our treatment have been varied within the rangeskd,X = 1–103s−1 andαs,0,X = 4×10⁻⁴– 1 (compare experimental values summarised in Shiraiwa et al., 2009: kd,X = 0.1–102s−1 andαs,0,X≈10−3 for O3). The experimental data (Ziemann, 2005) can be matched for
by Ziemann, 2005) can be matched for αs,0,X≈4×10⁻⁴– 10−3. However, it should be noted that the experimental data can also be reproduced with other combinations ofαs,0,X andkd,X, that are closer to predictions from molecular
dy-namic simulations for related systems (e.g. αs,0,X≈10−2 andkd,X≈109s; compare Vieceli et al. (2005) for a com-putational study of ozone at the air–water interface). These aspects will be further investigated in follow-up studies. For BC1 we chose the lower value forαs,0,Xto be able to match the reported bulk reaction rate coefficient, while the higher value forαs,0,X was employed in base case 2 (BC2) with a reduced bulk reactivity (for BC2 we usedαs,0,X= 8.5×10⁻⁴,
kd,X= 103s−1andks,b= 4.85×10⁵s−1).
In analogy to Eq. (27) we can estimate [X]s,max
kb,s,X×[X]b,max = ks,b,X×[X]s,max. (30) The surface reactivity has been estimated considering ex-perimental values from King et al. (2009) and Gonzalez-Labrada et al. (2007) for monolayers of oleic acid on an aqueous sub phase: two branches have been found by King et al. (2009) with second-order rate coefficients of k1 = 7.3×10⁻¹¹cm2s−1 and k2 = 2.1×10⁻¹²cm2s−1 and branching ratios (for deuterated oleic acid) of
k1/k2 = 0.86/0.14. Gonzalez-Labrada et al. (2007) re-ported a rate coefficient of 4.9×10⁻¹¹cm2s−1. Rosen et al. (2008) reported first-order rate coefficients for reac-tions of O3 with oleic acid on silica and polystyrene la-tex core particles of 0.64–2.2 s−1suggesting a much smaller surface rate coefficient of ∼1–5×10⁻¹⁵cm2s−1 (when as-suming saturation of the surface sorption sites). We used
kSLR,X,Y = 6×10⁻¹²cm2s−1 for the surface reaction on a droplet of pure oleic acid which is approximately one or-der of magnitude below the experimental values reported for oleic acid monolayers on aqueous sub phases. A surface re-action of a pure oleic acid droplet slower than that of a mono-layer of oleic acid on an aqueous sub phase can be ratio-nalised since an aqueous sub phase will lead to a reasonably well aligned hydrophobic (but bent) tail of oleic acid contain-ing the reactive site (double bond) stickcontain-ing out of the liquid phase which is likely to facilitate attack by ozone. In pure oleic acid we would expect a random orientation of oleic acid molecules on the surface and thus a somewhat reduced reac-tivity. The chosen value forkSLR,X,Y is substantially above the estimated rate coefficient derived from work by Rosen et al. (2008) since SEM images in Rosen et al.’s paper indicate that oleic acid was present in small islands on the particle surface rather than in a layer, so that the number of surface sorption sites is likely to be substantially reduced leading to a higher (but undetermined) rate coefficient.
The bulk reaction rate coefficient for reaction of ozone with oleic acid has been measured by Razumovskii et al. (1972) and confirmed using a “Double Bond Analyser” by Titov et al. (2005) for oleic acid dissolved in CCl4to be
kBR,X,Y= 1.7×10⁻¹⁵cm3s−1(corresponding to the reported value of 1×10⁶L mol−1s−1). This rate coefficient has been
used in many previous studies (e.g. Smith et al., 2002 or King et al., 2009).
In view of the large uncertainty and the lack of experi-mental data on surface reactivity for droplets of pure oleic acid we chose two base cases for our model validation: in base case 1 (BC1) we employ Titov et al.’s value for
kBR,X,Y (together with kd,X = 100 s−1,αs,0,X = 4.2×10⁻⁴
andks,b,X= 9.8×10⁴s−1)for the droplet of pure oleic acid to fit the experimental data by Ziemann (2005) andHcp,X;
base case 2 (BC2) uses conditions where bulk and surface re-actions are of similar importance assuming∼30 times lower
kBR,X,Yof 5×10⁻¹⁷cm3s−1(together withkd,X= 1000 s−1,
αs,0,X= 8.5×10⁻⁴andks,b,X= 4.85×10⁵s−1). Further input parameters are detailed in Appendix D.
4 Simulation results and discussion
K2-SUB was applied to illustrate the relative importance of surface and bulk losses of the liquid-phase species in dif-ferent regimes. We simulated experimental data (Ziemann, 2005) in two base cases and then performed detailed sen-sitivity studies: base case 1 (BC1) assumes fast bulk reac-tion (using Titov et al.’s value for bulk reactivity) while base case 2 (BC2) illustrates the importance of surface processes in the oleic acid-ozone system at reduced bulk reactivity. Se-lected results are presented here, while the complete set of data is tabulated in Table 2 and presented in the electronic supplement (see http://www.atmos-chem-phys.net/10/4537/ 2010/acp-10-4537-2010-supplement.zip).
4.1 Base case 1 (BC1): fast bulk reaction
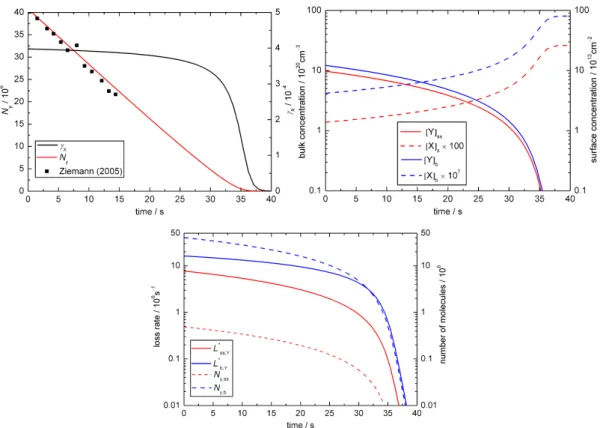
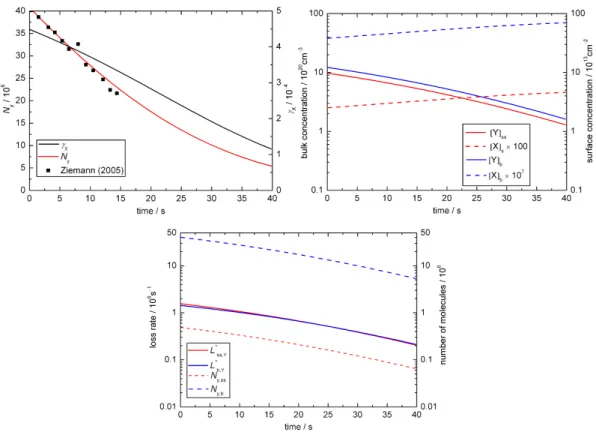
In base case 1 the experimental results are matched for
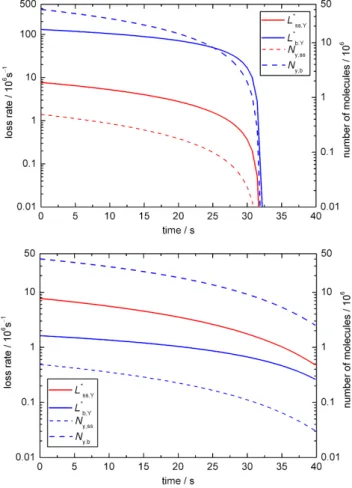
kSLR,X,Y = 6×10⁻¹²cm2s−1andkBR,X,Y = 1.7×10⁻¹⁵ cm3 s−1 as illustrated in Fig. 2a–c. Figure 2a shows the time evolution of the uptake coefficient and the total number of oleic acid molecules as a function of time. The experi-mental data (presented as black symbols; Ziemann, 2005) is matched by the simulated decay (red line) and the uptake co-efficient (black line) shows an initial plateau before dropping off after ca. 30 s. Figure 2b illustrates the changes in concen-trations of ozone and oleic acid at the surface (red lines) and in the droplet bulk (blue lines). Initially, there is no ozone in the droplet and ozone is taken up into the particle as oleic acid reacts away. Figure 2c shows the relative importance of bulk and surface processes for the turnover in the droplet. The dashed lines indicate the change in the numbers of oleic acid molecules at the surface (red line) and in the bulk (blue line) as a function of time. For the 0.2 µm droplet of pure oleic acid there are obviously many more molecules in the bulk than at the particle surface.
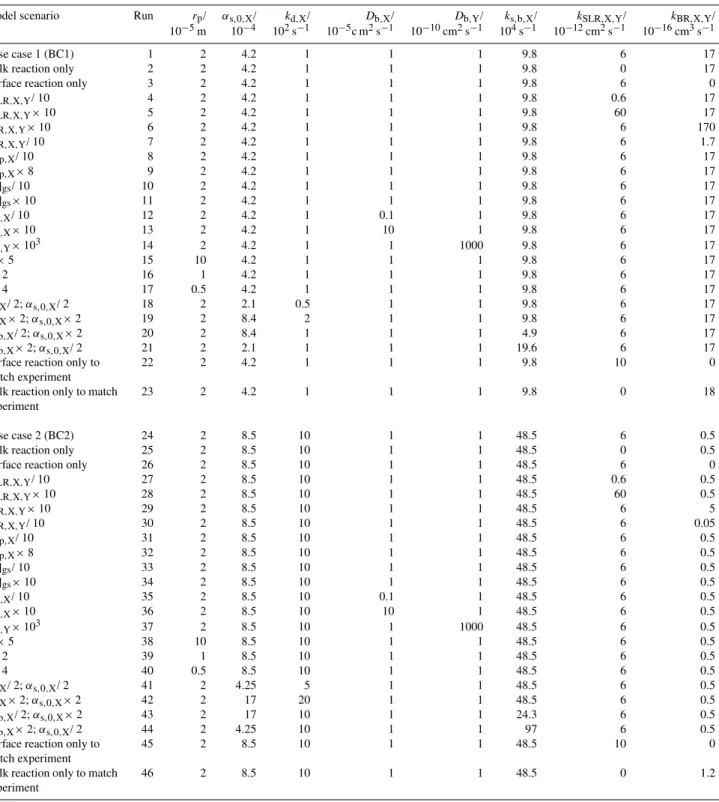
Table 2.Physico-chemical parameters investigated in the model simulations (base cases and sensitivity studies; the complete set of data is presented in the electronic supplement, see http://www.atmos-chem-phys.net/10/4537/2010/acp-10-4537-2010-supplement.zip).
Model scenario Run rp/ αs,0,X/ kd,X/ Db,X/ Db,Y/ ks,b,X/ kSLR,X,Y/ kBR,X,Y/
10−5m 10−4 102s−1 10−5c m2s−1 10−10cm2s−1 104s−1 10−12cm2s−1 10−16cm3s−1
Base case 1 (BC1) 1 2 4.2 1 1 1 9.8 6 17
Bulk reaction only 2 2 4.2 1 1 1 9.8 0 17
Surface reaction only 3 2 4.2 1 1 1 9.8 6 0
kSLR,X,Y/ 10 4 2 4.2 1 1 1 9.8 0.6 17
kSLR,X,Y×10 5 2 4.2 1 1 1 9.8 60 17
kBR,X,Y×10 6 2 4.2 1 1 1 9.8 6 170
kBR,X,Y/ 10 7 2 4.2 1 1 1 9.8 6 1.7
Hcp,X/ 10 8 2 4.2 1 1 1 9.8 6 17
Hcp,X×8 9 2 4.2 1 1 1 9.8 6 17
[X]gs/ 10 10 2 4.2 1 1 1 9.8 6 17
[X]gs×10 11 2 4.2 1 1 1 9.8 6 17
Db,X/ 10 12 2 4.2 1 0.1 1 9.8 6 17
Db,X×10 13 2 4.2 1 10 1 9.8 6 17
Db,Y×103 14 2 4.2 1 1 1000 9.8 6 17
rp×5 15 10 4.2 1 1 1 9.8 6 17
rp/ 2 16 1 4.2 1 1 1 9.8 6 17
rp/ 4 17 0.5 4.2 1 1 1 9.8 6 17
kd,X/ 2;αs,0,X/ 2 18 2 2.1 0.5 1 1 9.8 6 17
kd,X×2;αs,0,X×2 19 2 8.4 2 1 1 9.8 6 17
ks,b,X/ 2;αs,0,X×2 20 2 8.4 1 1 1 4.9 6 17
ks,b,X×2;αs,0,X/ 2 21 2 2.1 1 1 1 19.6 6 17
Surface reaction only to match experiment
22 2 4.2 1 1 1 9.8 10 0
Bulk reaction only to match experiment
23 2 4.2 1 1 1 9.8 0 18
Base case 2 (BC2) 24 2 8.5 10 1 1 48.5 6 0.5
Bulk reaction only 25 2 8.5 10 1 1 48.5 0 0.5
Surface reaction only 26 2 8.5 10 1 1 48.5 6 0
kSLR,X,Y/ 10 27 2 8.5 10 1 1 48.5 0.6 0.5
kSLR,X,Y×10 28 2 8.5 10 1 1 48.5 60 0.5
kBR,X,Y×10 29 2 8.5 10 1 1 48.5 6 5
kBR,X,Y/ 10 30 2 8.5 10 1 1 48.5 6 0.05
Hcp,X/ 10 31 2 8.5 10 1 1 48.5 6 0.5
Hcp,X×8 32 2 8.5 10 1 1 48.5 6 0.5
[X]gs/ 10 33 2 8.5 10 1 1 48.5 6 0.5
[X]gs×10 34 2 8.5 10 1 1 48.5 6 0.5
Db,X/ 10 35 2 8.5 10 0.1 1 48.5 6 0.5
Db,X×10 36 2 8.5 10 10 1 48.5 6 0.5
Db,Y×103 37 2 8.5 10 1 1000 48.5 6 0.5
rp×5 38 10 8.5 10 1 1 48.5 6 0.5
rp/ 2 39 1 8.5 10 1 1 48.5 6 0.5
rp/ 4 40 0.5 8.5 10 1 1 48.5 6 0.5
kd,X/ 2;αs,0,X/ 2 41 2 4.25 5 1 1 48.5 6 0.5
kd,X×2;αs,0,X×2 42 2 17 20 1 1 48.5 6 0.5
ks,b,X/ 2;αs,0,X×2 43 2 17 10 1 1 24.3 6 0.5
ks,b,X×2;αs,0,X/ 2 44 2 4.25 10 1 1 97 6 0.5
Surface reaction only to match experiment
45 2 8.5 10 1 1 48.5 10 0
Bulk reaction only to match experiment
46 2 8.5 10 1 1 48.5 0 1.2
concentration-based chemical loss rates with the surface area and bulk volume, respectively: L∗ss,Y = Lss,Y×Ass and
L∗b,Y = Lb,Y×Vb. Figure 2c shows the relative impor-tance of surface and bulk loss: during the first 30 s initial
Fig. 2.Temporal evolution of aerosol particle composition and kinetic parameters in base case 1 (BC1; X = O3, Y = oleic acid):(a)ozone
uptake coefficient (γx)and total number of oleic acid molecules (Ny; symbols indicate experimental data from Ziemann, 2005);(b)surface
and bulk concentrations (square brackets);(c)numbers of oleic acid molecules at the surface and in the bulk of the particle (Ny,ss,Ny,b)and
corresponding absolute loss rates (L∗ss,Y = Lss,Y×Ass,L∗b,Y = Lb,Y×Vb).
BC1 sensitivity study
In order to establish the dependencies of our results on the chosen set of kinetic input parameters for our base model BC1 (justified in Sect. 3 and detailed in Appendix D) we varied all parameters and the complete set of results of these sensitivity studies are presented in the electronic supplement (a summary of the model conditions is given in Table 2). Ini-tially we variedkSLR,X,Y,kBR,X,Y,Ksol,cp,X, and [X]gs.
Solubility
Assuming∼one order of magnitude difference in the Henry’s law coefficients (see Fig. 3a and b) leads to substantial devi-ations from the experimental data with a higher coefficient showing dramatically faster decay of oleic acid (Ksol,cp,X could only be increased eight fold, since higher values cause problems for the Matlab solver for long reaction times). This strong dependence onKsol,cp,X demonstrates thatKsol,cp,X has a larger influence on the decay behaviour than variations in the reaction parameters.
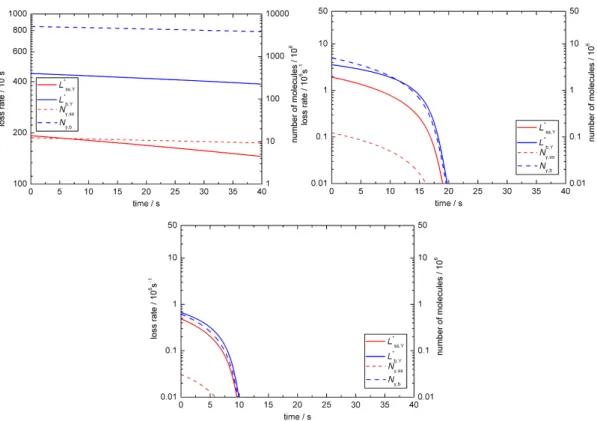
Diffusivity
We also varied the diffusion coefficients: Db,X was altered by one order of magnitude (see Fig. 4a and b) and we in-creasedDb,Yby three orders of magnitude (corresponding to the largest oleic acid diffusion coefficient chosen by Smith et al., 2003). A change of Db,X leads to a deviation from the experimental data (compare Fig. 4a and b with Fig. 2c), i.e. ozone diffusion has an impact on the turnover in the droplet. Fig. 4b illustrates how for slow diffusion of X the surface loss initially dominates the total loss of Y, while the bulk loss becomes dominant after ∼20 s. The figure also suggests that even during the initial surface-dominated de-cay most molecules that are being lost originate from the bulk, i.e. bulk-to-surface transport of oleic acid is relatively fast and the chemical reaction at the surface is the rate-determining step. The system is not sensitive even to a three orders of magnitude change ofDb,Y, so that oleic acid
Fig. 3.Temporal evolution of aerosol particle composition and ki-netic parameters in sensitivity studies for BC1 withKsol,cp,X(a)
eight fold above the literature value and(b)ten fold below. Plots are analogous to Fig. 2c.
Particle size
We tested the model for a range of droplet radii of 1000, 100 and 50 nm as shown in Fig. 5a–c. Unsurprisingly larger par-ticles require longer reaction times. Due to the change in sur-face to volume ratio the relative contribution from the sursur-face reaction becomes more important for smaller particles. Surface accommodation
For BC1 the model is relatively insensitive to changes in the rate coefficients for chemical reaction. Under these condi-tions the reactive decay is limited by transport of ozone into the bulk. The sensitivity studies illustrate that the surface ac-commodation coefficient (αs,0,X)is particularly important in this regime: massive deviations are seen when varyingαs,0,X (see Fig. 6a and b).
Fig. 4.Temporal evolution of aerosol particle composition and ki-netic parameters in sensitivity studies for BC1 withDb,X(a)ten
fold above the literature value and(b)ten fold below. Plots are analogous to Fig. 2c.
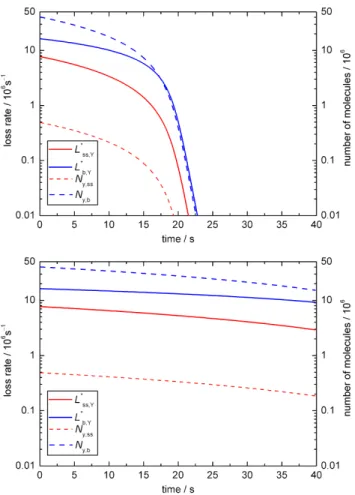
Exclusive surface or bulk reaction
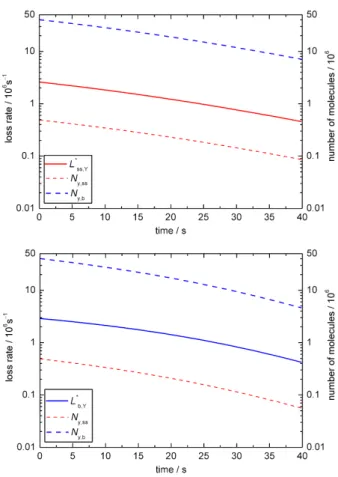
As illustrated in Fig. 7, we can also match the experimen-tal results fairly well in sensitivity studies where we as-sumed that chemical reactions proceed either only at the sur-face (kSLR,X,Y= 1×10⁻¹¹cm2s−1)or only in the bulk (with
kBR,X,Y= 1.8×10⁻¹⁵cm3s−1). Up to 30 s the temporal evo-lution of the observable parametersNyandγxin both sce-narios is similar to each other and to BC1, but at the end of the model run (after 40 s) the surface reaction would still be going on whereas practically all oleic acid would have been consumed in the bulk reaction (Ny≈0 andγx≈0). Thus we suggest that future experimental studies should aim at cov-ering longer reaction times to allow for better discrimination of surface and bulk processes.
4.2 Base case 2 (BC2): slow bulk reaction
Fig. 5.Temporal evolution of aerosol particle composition and kinetic parameters in sensitivity studies for BC1 with a range of droplet radii:
(a)1000 nm,(b)100 nm and(c)50 nm. Plots are analogous to Fig. 2c.
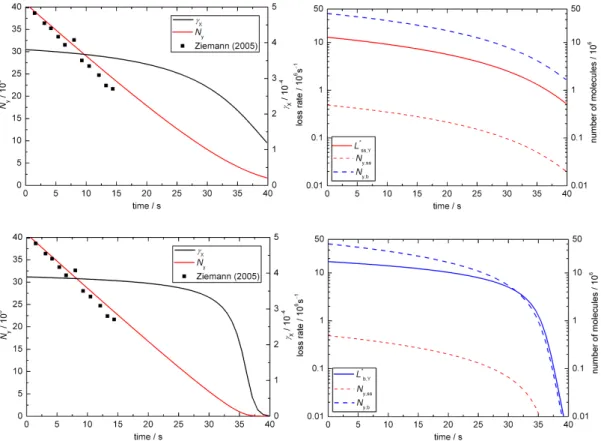
here (the full data set is presented in the electronic supplement and tabulated in Table 2). Figure 8a– c shows that experimental results are matched for the chosen conditions for kSLR,X,Y = 6×10⁻¹²cm2s−1 and
kBR,X,Y= 5×10⁻¹⁷cm3s−1. These conditions lead to very similar proportions of absolute bulk and surface loss rates (see solid lines in Fig. 8c).
A general feature of BC2 compared to BC1 is the fact that after ∼30 s the decay of oleic acid proceeds much slower (compare e.g. Figs. 2a and 8a). This behaviour can be explained by the different bulk reaction rate coefficients and the temporal evolution of the reacto-diffusive length (lrd,X =
q
Db,X
kb,X), which can be regarded as the dis-tance from the surface up to which the chemical reaction pro-ceeds effectively (Finlayson-Pitts and Pitts, 2000; P¨oschl et al., 2007).
In BC1 the bulk reaction rate coefficient is high (kBR,X,Y= 1.7×10⁻¹⁵cm3s−1)but the initial value oflrd,X is as small as∼20 nm, indicating that the reaction proceeds fast but only close to the surface. After∼30 s,lrd,Xincreases steeply and oleic acid is quickly depleted throughout the bulk of the particle.
In BC2 the bulk reaction rate coefficient is by a factor of ∼30 lower (kBR,X,Y= 5×10⁻¹⁷cm3s−1)and the initial value oflrd,Xis as large as ∼130 nm, indicating that the reaction proceeds slow and throughout the bulk of the particle. Due to
the low value ofkBR,X,Ythe depletion of oleic acid continues to proceed slowly also after∼30 s. Further details and effects of bulk reactivity, concentration gradients and diffusion are explored and discussed in a follow-up study (Shiraiwa et al., 2010).
BC2 sensitivity study
In order to establish the dependencies of our results on the chosen set of kinetic input parameters for BC2 we varied all parameters and detailed results of this sensitivity study are presented in the electronic supplement together with those for BC1.
First we varied kSLR,X,Y, kBR,X,Y, Ksol,cp,X, and [X]gs.
The model is clearly sensitive to small changes in the re-activity both on the surface and in the bulk of the droplet (much more so than BC1: compare runs 4–7 with runs 27–30 tabulated in Table 2 and illustrated in the electronic supplement, see http://www.atmos-chem-phys.net/10/4537/ 2010/acp-10-4537-2010-supplement.zip), so that the model results deviate substantially for the low and high rate coeffi-cients tested.
Solubility
which can be attributed to the fact that the reaction proceeds throughout the bulk of the particle and is not limited by the reacto-diffusive length (lrd,X)as discussed above (Sect. 4.2.). Diffusivity
A reduction of the diffusion coefficientDb,X does show a small deviation from the experimental data, while an increase results in no significant deviation, i.e. ozone diffusion has a small impact on the turnover in the droplet. The system is not sensitive even to three orders of magnitude largerDb,Y,
so that oleic acid diffusion is again not limiting the loss of reactants.
Particle size
We also tested the model for a range of droplet radii of 1000, 100 and 50 nm showing a similar picture to BC1 (compare runs 38–40).
Surface accommodation
In base case 2 surface and bulk reaction rate coefficients be-come both much more important than in BC1. The turnover in the droplet is thus not limited by transport, but by chemical reaction. Nevertheless, the assumed value forαs,0,Xremains important.
Our study underlines the strong influence of αs,X in all conditions which becomes apparent when inspecting Eq. (19):αs,Xappears in all terms and our modelling results demonstrate its highly non-linear impact on reactive losses in atmospheric particles. More experimental data are needed to better pin downαs,0,X. Our analysis also demonstrates that it
is vital to use a model when designing an experimental study to be able to choose the most insightful experimental condi-tions: BC1 and BC2 show substantial deviations for reaction times above∼30 s, but experimental data are only available for the first 15 s, so that both base cases fit the experiment. BC1 accommodates the fast bulk reaction rate coefficient re-ported by Titov et al. (2005), while BC2 is compatible with the experimental data only for substantially slower bulk re-action.
Exclusive surface or bulk reaction
The experimental results, i.e. the first 15 s of oleic acid decay, can also be matched when as-suming exclusive surface or bulk reaction (see Fig. 9a and b) with kSLR,X,Y = 1×10⁻¹¹cm2s−1 or
kBR,X,Y = 1.2×10⁻¹⁶cm3s−1, respectively. These results indicate for both base cases (BC1 and BC2) that the surface reaction of a pure oleic acid droplet is slower than that of a monolayer of oleic acid on an aqueous sub phase (compare Gonzalez-Labrada et al., 2007 and King et al., 2009) which can be rationalised by the lack of alignment of oleic acid molecules in organic rather than aqueous solution. This
Fig. 6. Temporal evolution of aerosol particle composition and kinetic parameters in sensitivity studies for BC1 for(a)doubling and(b)halvingαs,0,X(while compensating withkd,Xto maintain
agreement with the experimental Henry’s law coefficientHcp,X).
Plots are analogous to Fig. 2c.
different orientation is likely to reduce the surface reactivity (compare discussion in Sect. 3). Overall, the results suggest an upper limit for the surface reaction of∼1×10⁻¹¹cm2s−1 for the chosen set of input parameters. However, it should be noted that the upper limit for the surface rate coefficient would be∼one order of magnitude higher if the desorption lifetime of ozone at the interface would be as short as nano-to pico-seconds (compare Vieceli et al., 2005 for a study of ozone at the air–water interface). Vieceli et al. (2004) found that the collision rate between ozone and a double bond is sensitive to several factors, including the extent of localization of the double bonds in the system and the distance that ozone diffuses into the organic phase. These aspects will be further investigated in follow-up studies.
4.3 Comparison with literature: surface vs. bulk reactivity and secondary chemistry
Fig. 7. Temporal evolution of aerosol particle composition and kinetic parameters in sensitivity studies for BC1 with chemical reaction occurring only at the surface(a–b)or only in the bulk(c–d). Plots are analogous to Fig. 2a and Fig. 2c.
chemical ionisation mass spectrometer. The reaction was found to occur at the particle surface although previous measurements suggested bulk reactivity (Moise and Rudich, 2002; Morris et al., 2002; Smith et al., 2002; Thornberry and Abbatt, 2004; Vieceli et al., 2004). Hearn et al. attribute this discrepancy to a reduced rate of ozone diffusion into the bulk caused by pure oleic acid behaving like a solid rather than a disordered liquid. This would result in a surface-dominated reaction between ozone and the double bond of oleic acid. Hearn et al. (2005) suggest that most of the reactions occur in the first monolayer. Knopf et al. (2005) studied O3 up-take by multi-component mixtures containing oleic acid and found that physical state and microstructure of these mix-tures are of key importance. Low fractions of added solid components decreased the uptake by one order of magnitude compared to liquid mixtures. Furthermore, solid-liquid mix-tures showed an increased uptake with increasing film age. McNeill et al. (2007) studied the reaction of ozone with inter-nally mixed submicron aqueous droplets containing sodium oleate. They found evidence for a surface process and sug-gest that a Langmuir-Hinshelwood model may be applied with ozone first adsorbing to the surface before the reac-tion takes place. The measured rate coefficient was found to reach a plateau for high [O3]. McNeill et al. (2007) sug-gest that oleate predominantly reacts in a monolayer on the aqueous sub-phase with reactive sites residing in a
liquid-like film with ozone diffusing through the film and out again while the surface to which ozone adsorbs might be chang-ing over the course of the reaction. Other studies also sug-gest that changes in ozone diffusion or solubility might occur during reaction (e.g. Moise and Rudich, 2000; Hearn et al., 2005). More importantly, a disruption of the order of the oleic acid dimers by surface-active reaction products might lead to a transition from surface-dominated reaction to bulk reaction (Hearn et al., 2005). Experimental evidence in sup-port of this suggestion has recently been provided by King et al. (2009): a monolayer of oleic acid on an aqueous sub-phase is replaced by a new monolayer during O3-initiated oxidation. Intriguingly, no product film has been found in studies of the ozonolysis of the methyl ester of oleic acid (Pfrang et al., 2010). Grimm et al. (2006) studied 1–2 mm droplets and found that ozone may penetrate up to 10 µm into these particles suggesting a bulk-phase process for at-mospherically relevant aerosol droplets.
Fig. 8.Temporal evolution of aerosol particle composition and kinetic parameters in base case 2 (BC2; X = O3, Y = oleic acid):(a)ozone
uptake coefficient (γx)and total number of oleic acid molecules (Ny; symbols indicate experimental data from Ziemann, 2005);(b)surface
and bulk concentrations (square brackets);(c)numbers of oleic acid molecules at the surface and in the bulk of the particle (Ny,ss,Ny,b)and
corresponding absolute loss rates (L∗ss,Y = Lss,Y×Ass,L∗b,Y = Lb,Y×Vb).
than in the bulk. The gradient in oxidation rates is steep-est for solid particles such as palmitic acid. Liquid particles – such as the oleic acid droplets considered in our study – show more shallow gradients between surface and bulk rates (McNeill et al., 2008). Our model analysis demonstrates in-deed that bulk reactivity is of key importance at least for oleic acid particles with radii of 200 nm or larger. There is ev-idence for the occurrence of surface renewal in our model system: the comparison of the absolute loss rates to the number of molecules at the particle surface and in the bulk (see e.g. Fig. 8c) suggests significant bulk-surface transport (bulk transport will be considered explicitly in the KM–SUB model).
Criegee intermediates are suggested to lead to a signif-icant additional loss of oleic acid, e.g. 36% of the oleic acid molecules were attributed to reaction of oleic acid with a Criegee intermediate rather than with ozone (Hearn et al., 2005) confirming an earlier study by Hearn and Smith (2004). Interference of secondary reactions by Criegee intermediates was also found by Hung and Ariya (2007). Re-cently, Sage et al. (2009) not only confirmed the occurrence of secondary reactions of Criegee intermediates with the or-ganic acid, but also found evidence for additional, previously unrecognised secondary chemistry that might involve the
car-bon backcar-bone. Secondary chemistry is not currently con-sidered in our model, but could be implemented if kinetic parameters for secondary reactions in the ozone–oleic acid system would become available (Hearn et al., 2005 quanti-fied the loss due to secondary reaction by comparing methyl oleate and oleic acid reactivities, but could not measure the rate coefficient for the secondary process). Secondary chem-istry would suggest an even slower initial reaction, so that the upper limit determined for the surface reaction in our model study would remain valid.
Fig. 9.Temporal evolution of aerosol particle composition and ki-netic parameters in sensitivity studies for BC2 with chemical reac-tion occurring(a)only at the surface or(b)only in the bulk. Plots are analogous to Fig. 2c.
studies. The influence of the changing chemical composi-tion of the particle surface on adsorbate-surface interaccomposi-tions i.e. on the surface accommodation coefficient can be taken into account by describingαs,0,Xas a linear combination of the initial surface accommodation coefficients that would be observed on pure substrates made up by the different sur-face components Ypweighted by their fractional surface area
θss,Yp (P¨oschl et al., 2007; discussed in detail in Shiraiwa et
al., 2010):
αs,0,X = X
p
αs,0,X,Ypθss,Yp. (31)
In a similar way, the influence of changing chemical compo-sition of the particle bulk on the bulk diffusion coefficient can be taken into account by describingDb,Xas a linear combi-nation of the initial bulk diffusion coefficients that would be observed in pure bulk:
Db,X = X
p
Db,X,Yp8b,Yp. (32)
8b,Yprefers to the fraction of Ypin the bulk. For the base cases presented in this paper,αs,0,X andDb,X are assumed
to be constant for simplicity. Bulk diffusion of the liquid phase species can be corrected in analogy to Eq. (32) for the gas-phase compound (see Shiraiwa et al., 2010). How-ever, the diffusion of oleic acid is not resolved in K2-SUB to maintain compatibility with resistor model formulations. Bulk diffusion of oleic acid is explicitly included in the KM-SUB model (Shiraiwa et al., 2010) and corrections for the changing chemical composition in the liquid phase could efficiently be implemented in KM-SUB. For long reaction times, the increasing proportion of products in the particle will also introduce additional uncertainties in the calculations since branching ratios and molecular properties are less well known in particular for second- and third-generation prod-ucts.
It is apparent that discrepancies remain between the large number of studies of the O3-oleic acid system. K2-SUB can be used to design, interpret and analyse future experimental investigations to allow choosing most insightful experimen-tal conditions and de-convoluting surface and bulk processes. While our modelling approach maintains compatibility with previous resistor-model formulations (e.g. Worsnop et al., 2002; Smith et al., 2002; King et al., 2008, 2009) K2-SUB enables free variation of all relevant parameters and thus can describe not only limiting cases, but also any state in between those. The testing and application of different sets of equations for different limiting cases used previously is adequate for the analysis of certain laboratory data, but it ap-pears not to be well suited for efficient modelling of different types of clouds and aerosols under varying atmospheric con-ditions. Simulations for various component and multi-phase reaction systems that are much more realistic models for atmospheric aerosol can be performed in future, incre-mental developments of K2-SUB. Such extensions would not be straight forward – if at all possible – for resistor-based models. Many experimental and nearly all atmospheric sys-tems do not adhere to ideal limiting-case behaviour, so that K2-SUB is a potentially powerful tool to help improving our understanding of interfacial oxidation processes of atmo-spheric importance.
5 Conclusions
1. We demonstrate how a detailed treatment of adsorption and reaction at the surface can be coupled to a descrip-tion of bulk reacdescrip-tion and transport that is consistent with traditional resistor model formulations. To our knowl-edge, K2-SUB is the first model in which this coupling has been realised.
3. The available reaction rate coefficients support that chemical reaction in the bulk plays an important role. Due to the wide range of rate coefficients reported from the different experimental studies, however, the exact proportion between surface and bulk reaction remains uncertain. Our model runs suggest for the chosen set of input parameters that the surface reaction rate coef-ficient is not significantly above 1×10⁻¹¹cm2s−1 for droplets of pure oleic acid.
4. Test calculations showed that the surface accommoda-tion coefficient of the gas-phase reactant has a strong non-linear influence on the surface and bulk reactions. Our two base cases demonstrate how slight variations in
αs,0,Xlead to either transport-limited (BC1) or reaction-limited (BC2) systems.
5. Further experimental data are required to establish the relative contributions of surface and bulk processes to the loss of oleic acid and other organic species in atmo-spheric aerosols.
6. We propose that K2-SUB may be used to design, inter-pret and analyse experiments for better discrimination between surface and bulk processes in the oleic acid-ozone system as well as in other heterogeneous reaction systems. For example, the model results suggest that longer reaction times than investigated in earlier studies (>30 s for 200 nm particles at 2.8 ppm [O3]) are needed to unravel the proportions between surface and bulk re-action. Many experimental and nearly all atmospheric reaction systems do not adhere to ideal limiting-case behaviour tailor-made for traditional resistor model for-mulations, so that K2-SUB is a potentially powerful tool to help improving our understanding of interfacial oxi-dation processes of atmospheric importance.
6 Supplementary material
The complete set of results of the model runs tabu-lated in Table 2 is presented in the electronic supple-ment (see http://www.atmos-chem-phys.net/10/4537/2010/ acp-10-4537-2010-supplement.zip) as 138 gif image files (three plots per model run equivalent to those exemplified in Fig. 2a, b and c).
Appendix A
List of symbols
Symbol Meaning SI Unit
αs,0,X initial surface accommoda-tion coefficient of X
αs,X surface accommodation co-efficient of X
γx uptake coefficient of X (nor-malized by gas kinetic flux of surface collisions)
γb,X resistor model conductance of particle bulk diffusion and reaction of X
γg,X resistor model conductance of gas phase diffusion of X
γs,X resistor model conductance of surface reaction of X
γs,b,X resistor model conductance of surface-bulk transfer of X
δX effective molecular diameter of X
m
δY effective molecular diameter of Y
m
σs,X molecular cross section of X in the sorption layer
m2
σss,Y molecular cross section of Y in the quasi-static layer
m2
τd,X desorption lifetime of X s
8b,Yp fraction of Ypin the bulk
ωx mean thermal velocity of X in the gas phase
m s−1
Ass Particle surface area (Ass= 4π rp2)
m2
Cb,rd,X reacto-diffusive geometry correction factor of X
Cg,X gas phase diffusion correc-tion factor of X
Db,X particle bulk diffusion coef-ficient of X
m2s−1
Dg,X gas phase diffusion coeffi-cient of X
m2s−1
Hcp,X Henry’s law coefficient of X (concentration/pressure)
mol m−3Pa−1
Jads,X,Jdes,X flux of adsorption and des-orption of X
m−2s−1
Jb,rd,X reacto-diffusive flux of X in the particle bulk
m−2s−1
Jb,s,X,Js,b,X flux of bulk-surface and surface-bulk transfer of X (sorption layer)
m−2s−1
Jb,ss,Y,Jss,b,Y flux of bulk-surface and surface-bulk transfer of Y (quasi-static layer)
m−2s−1
Jcoll,X gas kinetic flux of X collid-ing with the surface
m−2s−1
Js,b,net,X net flux of surface-bulk transfer of X
m−2s−1
ka,X first-order adsorption rate coefficient of X
m s−1
ka,0,X first-order adsorption rate coefficient of X on an adsorbate-free surface
m s−1
kb,X pseudo-first-order rate coef-ficient for chemical loss of X in the particle bulk
s−1
kb,s,X first-order rate coefficient for bulk-to-surface transfer of X
m s−1
kb,ss,Y first-order rate coefficient for bulk-to-surface transfer of Y
kd,X first-order desorption rate coefficient of X
s−1
kBR,X,Y second order bulk reaction rate coefficient
m3s−1
ks,X pseudo-first-order rate coef-ficient for chemical loss of X in the sorption layer
s−1
ks,b,X first-order rate coefficient for surface-to-bulk transfer of X
s−1
ks,b,net,X pseudo-first-order rate co-efficient for net surface-to-bulk transfer of X
s−1
kss,Y pseudo-first-order rate coef-ficient for chemical loss of Yin the quasi-static surface layer
s−1
kss,b,Y first-order rate coefficients for surface-bulk transfer of Y
s−1
kSLR,X,Y second-order rate coefficient for surface layer reactions of X with Y
m2s−1
K′
ads,X effective adsorption equilib-rium constant of X
m3
Ksol,cp,X solubility or gas-particle partitioning coefficient of X
mol m−3Pa−1
Ksol,cc,X dimensionless solubility or gas-particle partitioning co-efficient of X
Lb,Y chemical loss rate (concentration-based) of Y in the bulk
m−3s−1
L∗b,Y absolute chemical loss rate of Y in the bulk
s−1
lrd,X reacto-diffusive length for X in the particle bulk
m
Ls,X chemical loss rate (concentration-based) of X on the surface
m−2s−1
Lss,Y chemical loss rate (concentration-based) of Y on the surface
m−2s−1
L∗ss,Y absolute chemical loss rate of Y in the bulk
s−1
R gas constant J K−1mol−1
rp particle radius m
[SS]ss sorption site surface concen-tration
m−2
T absolute temperature K
Vb volume of the particle bulk (Vb = 4/3π(rp−δY)3)
m3
Vp total particle volume (Vp = 4/3π r3
p)
m3
X volatile molecular species [X]b particle bulk number
con-centration of X
m−3
[X]bs near-surface particle bulk number concentration of X
m−3
[X]b,max maximum particle bulk number concentration of X
m−3
[X]g gas phase number concen-tration of X
m−3
[X]gs near-surface gas phase num-ber concentration of X
m−3
[X]s surface number concentra-tion of X (sorpconcentra-tion layer)
m−2
[X]s,max maximum surface number concentration of X (sorption layer)
m−2
Y non-volatile molecular species
[Y]ss surface number concentra-tion of Y (quasi-static layer)
m−2
[Y]ss,0 initial surface number con-centration of Y (quasi-static layer)
m−2
[Y]ss,max max. surface number con-centration of Y (quasi-static layer)
m−2
[Y]b average concentration of Y across the whole particle bulk (including near-surface bulk)
m−2
[Y]b,0 initial concentration of Y across the whole particle bulk (including near-surface bulk)
m−2
[Y]b,max max. concentration of Y across the whole particle bulk (including near-surface bulk)
m−2
Appendix B
Relevant equations from PRA framework (P¨oschl et al., 2007)
γx = αs,X
ks,X+ks,b,net,X
ks,X+ks,b,net,X+kd,X
(B1) with
ks,b,net,X = ks,b,X 1+
kb,s,X
Cb,rd,Xpkb,XDb,X !−1
, (B2)
and the reacto-diffusive geometry correction factor (conver-sion from planar to spherical geometry; determined by the particle radius,rp, and the reacto-diffusive length for species X:lrd,X =
q
Db,X
kb,X):
Cb,rd,X = coth r
p
lrd,X
−lrdr,X p
. (B3)
Ksol,cp,X is the solubility or gas-particle partitioning coeffi-cient for X and describes the partitioning of a volatile species between gas phase and particle bulk (at infinite dilution, it equals Henry’s law coefficient;Ksol,cp,XRT = Ksol,cc,X giv-ing the ratio of condensed phase and gas phase concentra-tions)
Ksol,cc,X=Ksol,cp,XRT =
ks,b,X
kb,s,X
ka,X
kd,X=
ks,b,X
kb,s,X
αs,Xωx 4kd,X
ka,0,X = αs,0,X
ωx
4 (B5)
αs,X =αs,0,X 1−θs,X (B6)
Kads′ ,X = σxka,0,X kd,X+ks,X+ks,b,net,X
(B7)
[X]bs [X]s =
ks,b,X
kb,s,X+Cb,rd,Xpkb,XDb,X
(B8)
Appendix C
Resistor model formulations and the PRA framework
The description of heterogeneous reactions is often achieved by resistor model formulations (e.g. Worsnop et al., 2002; Smith et al., 2002; King et al, 2008, 2009; Gross et al., 2009) which are valid under certain assumptions and con-sistent with the PRA framework as described under Special Case B in P¨oschl et al. (2007). Uptake coefficients (γ) gen-erally refer to a gas-phase species X. A sorption layer up-take coefficient can be defined under steady state condition by Eq. (B1) (compare P¨oschl et al., 2007, Eq. 115). Resistor model formulation of Special Case B in P¨oschl et al. (2007) is obtained from inversion of Eq. (B1):
1
γx = 1
αs,X+
1
Ŵs,X+ 1 1 Ŵs,b,X+Ŵb1,X
(C1)
with resistor model conductance terms for surface reaction (Ŵs,X)for surface-bulk transfer (Ŵs,b,X)and for particle bulk diffusion and reaction (Ŵb,X)(as defined in Eqs. 21, 22 and 23)
Ŵb,X = 4
ωx
Ksol,cp,XRT Cb,rd,X p
kb,XDb,X (C2)
Equation (C2) is equivalent to resistor model formulations, exemplified here by the treatment used by Smith et al. (2002; Eq. 4):
Ŵrxn =
4H RT D
¯
cl [coth(a/ l−l/a)] (C3)
with
kb,X = k2[Oleic]
lrd,X = l
ωX = c¯
rp = a
Ksol,cp,X = H
Db,X = D
γrxn = Ŵb,X
and Cb,rd,X = coth al−al; compare Eq. (B3).
C1 For reaction of ozone near the particle surface
Case 1b in Smith et al., 2002; for lrd,X< rp/20; diffusion-limited case. The uptake is given by (Smith et al., 2002, Eqs. 9 and C2)
γ = 4H RT c
p Dk2
p
[Oleic]∼=ω4
x
Ksol,cp,XRT
p
kb,XDb,X (C4)
with 1≤Cb,rd,X≥0.95≈1. Derivation:
Limiting case forlrd,X = rp/20 in Eq. (C2) withCb,rd,X as defined in Eq. (B3) and coth20rp
rp
= ee4040+−11≈1, thus Cb,rd,X = 1−201 =0.95, and forlrd,X< rp/20:Cb,rd,X≈1.
C2 For fast diffusion of ozone through the particle
Case 1a in Smith et al., 2002; for lrd,X> rp; reaction not limited by diffusion) the uptake is given by
γ = 4H RT c
a
3k2[Oleic]∼= 4 3ωx
Ksol,cp,XRT rpkb,X. (C5)
Derivation:
cothx = coshx/sinhx; Taylor series: cothx∼=1/x+x/3−
x3/45. . .
Using Taylor and neglecting all terms higher than power 1 inx:
Cb,rd,X = coth r
p
lrd,X
−lrd,X
rp ≈ l
rd,X
rp +
rp 3lrd,X
−lrdr,X
p =
rp 3lrd,X
. (C6)
Equation (C2) thus becomes:
Ŵb,X = 4
ωx
Ksol,cp,XRT
rp 3lrd,X
p
kb,XDb,X. (C7)
Using Eq. (C4):
Ŵb,X = 4
ωx
Ksol,cp,XRT
rppkb,XDb,X 3Db,X
p
kb,XDb,X
= 4 3ωx
Ksol,cp,XRT rpkb,X. (C8)
C3 For the reactive uptake being dominated by reaction at the surface
be equal to surface conductance term
γ = Ŵs,X =
k2surf[O3]surf[Oleic]surf normalised by gas−collision rate = k
surf
2 PO3H δX
[Oleic]δX
PO3/4RT
= 4H RT
c δ
2
Xk2surf[Oleic]∼= 4ka,X
ωx
ks,X
kd,X
. (C9)
Derivation:
– ks,X = ksurf2 [Oleic]δX;
– H RT δX =Ksol,cp,XRT δX =Ksol,cc,XδX = kks,b,X
b,s,X ka,X kd,XδX
and kb,s,X
ks,b,X = δX so that H RT δX = ka,X
kd,X (compare
Eqs. B4, 21 and 30).
Appendix D
Model input parameters
K2-SUB model input parameters for the investigated chemical species (X = O3 and Y = oleic acid) based on experimental data from Ziemann (2005), Smith et al. (2002), Gonzalez-Labrada et al. (2007), King et al. (2008, 2009) and P¨oschl et al. (2001).
rp= 0.2 µm (Ziemann, 2005)
Db,X= 1×10⁻⁵cm2s−1(estimated based on dif-fusion of O2 in range of organic solvents; Smith et al., 2002; King et al., 2008)
Db,Y= 10−7–10−10 cm2 s−1 (compare Smith et al., 2003)
ωX= 3.6×104 cm s−1 (Smith et al., 2002; P¨oschl et al., 2001; Ammann and P¨oschl, 2007; King et al., 2009)
Hcp,X= 4.8×10⁻⁴ mol cm−3 atm−1(Smith et al., 2002; Morris et al., 2002; King et al., 2008, 2009)
αs,0,X= 4.2×10⁻⁴ (BC1) and 8.5×10⁻⁴ (BC2) (compare P¨oschl et al., 2001; Ammann and P¨oschl, 2007; Shiraiwa et al., 2009)
kd,X= 100 s−1 (BC1) and 1000 s−1 (BC2) (kd,X= 0.1–102s−1for ozone; Shiraiwa et al., 2009)
kSLR,X,Y= 6×10⁻¹² cm2s−1; compare 7.3×10⁻¹¹ cm2s−1and 2.1×10⁻¹²cm2s−1(King et al., 2009); 4.9×10⁻¹¹cm2s−1 (Gonzalez-Labrada et al., 2007)
[X]gs= 6.95×1013cm−3corresponding to 2.8 ppm (Ziemann, 2005)
kb,X= kBR,X,Y×[Y] with kBR,X,Y = 1.7×10⁻¹⁵ cm3s−1corresponding to a literature value of 1×10⁶L mol−1s−1(Razumovskii et al., 1972, Lisitsyn et al., 2004 and Titov et al., 2005; used in BC1; reduced to 5×10⁻¹⁷ cm3 s−1 in BC2) and [Y]0 = 1.21×1021 cm−3corresponding to 3.15 mol L−1 (Zie-mann, 2005)
T = 296 K
kb,s,X= 318 cm s−1
kb,ss,Y= 1.6×10⁻³cm s−1
kss,b,Y= 1.99×10⁴s−1
ks,b,X= 9.8×10⁴ s−1 (BC1) and 4.85×10⁵ s−1 (BC2)
σX= 1.8×10⁻¹⁵ cm2 (P¨oschl et al., 2001; Ammann and P¨oschl, 2007) and thus
δX= 0.4 nm (compare computational study by Vieceli et al., 2004)
δY= 0.8 nm (compare work by Iwahashi, 1991)
Acknowledgements. CP wishes to thank the Royal Society (grant VO080001), the Research Endowment Trust Fund (University of Reading) and the NERC (grant NE/G000883/1). UP and MS acknowledge support from the European integrated project on cloud climate and air quality interactions (No. 036833-2 EUCAARI), the Max Planck Graduate Centre (MPGC), and the Ministry of Education, Culture, Sports, Science and Technology – Japan (MEXT).
The service charges for this open access publication have been covered by the Max Planck Society. Edited by: M. Kulmala
References
Ammann, M., P¨oschl, U., and Rudich, Y.: Effects of reversible adsorption and Langmuir-Hinshelwood surface reactions on gas uptake by atmospheric particles, Phys. Chem. Chem. Phys., 5, 351–356, 2003.
Ammann, M. and P¨oschl, U.: Kinetic model framework for aerosol and cloud surface chemistry and gas-particle interactions – Part 2: Exemplary practical applications and numerical simulations, Atmos. Chem. Phys., 7, 6025–6045, 2007,
http://www.atmos-chem-phys.net/7/6025/2007/.
Andreae, M. O., Rosenfeld, D., Artaxo, P., Costa, A. A., Frank, G. P., Longo, K. M., and Silva-Dias, M. A. F.: Smoking rain clouds over the Amazon, Science, 303, 1337–1342, 2004.
Atkins, P. W.: Physical Chemistry, Oxford University Press, 1998. Bergstrom, R. W., Pilewskie, P., Russell, P. B., Redemann, J., Bond,
T. C., Quinn, P. K., and Sierau, B.: Spectral absorption proper-ties of atmospheric aerosols, Atmos. Chem. Phys., 7, 5937–5943, 2007,
http://www.atmos-chem-phys.net/7/5937/2007/.
Breon, F. M., Tanre, D., and Generoso, S.: Aerosol effect on cloud droplet size monitored from satellite, Science, 295, 834–838, 2002.
Charlson, R. J., Seinfeld, J. H., Nenes, A., Kulmala, M., Laaksonen, A., and Facchini, M. C.: Atmospheric science - Reshaping the theory of cloud formation, Science, 292, 2025–2026, 2001. Choularton, T. W., Bower, K. N., Weingartner, E., Crawford, I.,
Coe, H., Gallagher, M. W., Flynn, M., Crosier, J., Connolly, P., Targino, A., Alfarra, M. R., Baltensperger, U., Sjogren, S., Ver-heggen, B., Cozic, J., and Gysel, M.: The influence of small aerosol particles on the properties of water and ice clouds, Fara-day Discuss., 137, 205–222, 2008.
Fuzzi, S., Andreae, M. O., Huebert, B. J., Kulmala, M., Bond, T. C., Boy, M., Doherty, S. J., Guenther, A., Kanakidou, M., Kawamura, K., Kerminen, V.-M., Lohmann, U., Russell, L. M., and P¨oschl, U.: Critical assessment of the current state of scien-tific knowledge, terminology, and research needs concerning the role of organic aerosols in the atmosphere, climate, and global change, Atmos. Chem. Phys., 6, 2017–2038, 2006,
http://www.atmos-chem-phys.net/6/2017/2006/.
Gonzalez-Labrada, E., Schmidt, R., and DeWolf, C. E.: Kinetic analysis of the ozone processing of an unsaturated organic mono-layer as a model of an aerosol surface, Phys. Chem. Chem. Phys., 9, 5814–5821, 2007.
Grimm, R. L., Hodyss, R., and Beauchamp, J. L.: Probing in-terfacial chemistry of single droplets with field-induced droplet ionization mass spectrometry: Physical adsorption of polycyclic aromatic hydrocarbons and ozonolysis of oleic acid and related compounds, Anal. Chem., 78, 3800–3806, 2006.
Gross, S., Iannone, R., Xiao, S., and Bertram, A. K.: Reactive uptake studies of NO3 and N2O5on alkenoic acid, alkanoate,
and polyalcohol substrates to probe nighttime aerosol chemistry, Phys. Chem. Chem. Phys., 11, 7792–7803, 2009.
Hearn, J. D. and Smith, G. D.: Kinetics and product studies for ozonolysis reactions of organic particles using aerosol CIMS, J. Phys. Chem. A, 108, 10019–10029, 2004.
Hearn, J. D., Lovett, A. J., and Smith, G. D:; Ozonolysis of oleic acid particles: evidence for a surface reaction and secondary reactions involving Criegee intermediates, Phys. Chem. Chem. Phys., 7, 501–511, 2005.
Hearn, J. D. and Smith, G. A.: Ozonolysis of mixed oleic acid/n-docosane particles: The roles of phase, morphology, and metastable states, J. Phys. Chem. A, 111, 11059–11065, 2007. Hung, H. M. and Ariya, P.: Oxidation of oleic acid and oleic
acid/sodium chloride(aq) mixture droplets with ozone: Changes of hygroscopicity and role of secondary reactions, J. Phys. Chem. A, 111, 620–632, 2007.
Iwahashi, M., Yamaguchi, Y., Kato, T., Horiuchi, T., Sakurai, I., and Suzuki, M.: Temperature-dependence of molecular confor-mation and liquid structure of cis-9-octadecanoic acid, J. Phys. Chem., 95, 445–451, 1991.
Katrib, Y., Biskos, G., Buseck, P. R., Davidovits, P., Jayne, J. T., Mochida, M., Wise, M. E., Worsnop, D. R., and Martin, S.
T.: Ozonolysis of mixed oleic-acid/stearic-acid particles: Reac-tion kinetics and chemical morphology, J. Phys. Chem. A, 109, 10910–10919, 2005.
King, M. D., Canosa-Mas, C. E., and Wayne, R. P.: Frontier molec-ular orbital correlations for predicting rate constants between alkenes and the tropospheric oxidants NO3, OH and O3, Phys.
Chem. Chem. Phys., 1, 2231–2238, 1999.
King, M. D., Thompson, K. C., Ward, A. D., Pfrang, C., and Hughes, B. R.: Oxidation of biogenic and water-soluble com-pounds in aqueous and organic aerosol droplets by ozone: a ki-netic and product analysis approach using laser Raman tweezers, Faraday Discuss., 137, 173–192, 2008.
King, M. D., Rennie, A. R., Thompson, K. C., Fisher, F. N., Dong, C. C., Thomas, R. K., Pfrang, C., and Hughes, A. V.: Oxidation of oleic acid at the air-water interface and its potential effects on cloud critical supersaturations, Phys. Chem. Chem. Phys., 11, 7699–7707, 2009.
King, M. D., Rennie, A. R., Pfrang, C., Hughes, A. V., Thomas, R. K., Dong, C. C., and Thompson, K. C.: Interaction of nitrogen oxide with a monolayer of oleic acid at the air-water interface: a simple proxy for atmospheric aerosol, Atmos. Environ., 44, 1822–1825, 2010.
Knopf, D. A., Anthony, L. M., and Bertram, A. K.: Reactive uptake of O3by multicomponent and multiphase mixtures containing
oleic acid, J. Phys. Chem. A, 109, 5579–5589, 2005.
Last, D. J., Najera, J. J., Percival, C. J., and Horn, A. B.: A compar-ison of infrared spectroscopic methods for the study of heteroge-neous reactions occurring on atmospheric aerosol proxies, Phys. Chem. Chem. Phys., 11, 8214–8225, 2009.
Lee, A. K. Y. and Chan, C. K.: Single particle Raman spectroscopy for investigating atmospheric heterogeneous reactions of organic aerosols, Atmos. Environ., 41, 4611–4621, 2007.
Lisitsyn, D. M., Razumovskii, S. D., Tishenin, M. A., and Titov, V. N.: Kinetic parameters of oxidation of individual fatty acids with ozone, Bull. Exp. Biol. Med., 138, 457–459, 2004.
Moise, T. and Rudich, Y.: Reactive uptake of ozone by proxies for organic aerosols: Surface versus bulk processes, J. Geophys. Res.-Atmos., 105, 14667–14676, 2000.
Moise, T. and Rudich, Y.: Reactive uptake of ozone by aerosol-associated unsaturated fatty acids: Kinetics, mechanism, and products, J. Phys. Chem. A, 106, 6469–6476, 2002.
Morris, J. W., Davidovits, P., Jayne, J. T., Jimenez, J. L., Shi, Q., Kolb, C. E., Worsnop, D. R., Barney, W. S., and Cass, G.: Kinet-ics of submicron oleic acid aerosols with ozone: a novel aerosol mass spectrometric technique, Geophys. Res. Lett., 29, 1357, doi:10.1029/2002GL014692, 2002.
McNeill, V. F., Wolfe G. M., and Thornton, J. A.: The Oxidation of Oleate in Submicron Aqueous Salt Aerosols: Evidence of a Surface Process, J. Phys. Chem. A, 111, 1073–1083, 2007. McNeill, V. F., Yatavelli, R. L. N., Thornton, J. A., Stipe, C. B., and
Landgrebe, O.: Heterogeneous OH oxidation of palmitic acid in single component and internally mixed aerosol particles: vapor-ization and the role of particle phase, Atmos. Chem. Phys., 8, 5465–5476, 2008,
http://www.atmos-chem-phys.net/8/5465/2008/.