SRef-ID: 1432-0576/ag/2005-23-593 © European Geosciences Union 2005
Annales
Geophysicae
Pseudo-field line resonances in ground Pc5 pulsation events
D. V. Sarafopoulos
Department of Electrical and Computer Engineering, Demokritos University of Thrace, Xanthi, Greece
Received: 2 September 2004 – Revised: 24 November 2004 – Accepted: 6 December 2004 – Published: 28 February 2005
Abstract. In this work we study four representative cases of Pc5 ground pulsation events with discrete and remark-ably stable frequencies extended at least in a high-latitude range of ∼20◦; a feature that erroneously gives the im-pression for an oscillation mode with “one resonant field line”. Additionally, the presented events show characteris-tic changes in polarization sense, for a meridian chain of stations from the IMAGE array, and maximize their ampli-tude at or close to the supposed resonant magnetic field shell, much like the typical FLR. Nevertheless, they are not au-thentic FLRs, but pseudo-FLRs, as they are called. These structures are produced by repetitive and tilted twin-vortex structures caused by magnetopause surface waves, which are probably imposed by solar wind pressure waves. The latter is confirmed with in-situ measurements obtained by the Clus-ter satellites, as well as the Geotail, Wind, ACE, and LANL 1994-084 satellites. This research effort is largely based on two recent works: first, Sarafopoulos (2004a) has observa-tionally established that a solar wind pressure pulse (step-wise pressure variation) produces a twin-vortex (single vor-tex) current system over the ionosphere; second, Sarafopou-los (2004b) has studied ground events with characteristic dis-persive latitude-dependent structures and showed that these are associated with twin-vortex ionosphere current systems. In this work, we show that each pseudo-FLR event is asso-ciated with successive and tilted large-scale twin-vortex cur-rent systems corresponding to a magnetopause surface wave with wavelength 10–20RE. We infer that between an
au-thentic FLR, which is a spatially localized structure with an extent 0.5REin the magnetospheric equatorial plane, and the
magnetopause surface wavelength, there is a scale factor of 20–40. A chief observational finding, in this work, is that there are Pc5 ground pulsation events showing two gradual and latitude dependent phase-shifts of 180◦, at the same time.
Key words. Ionosphere (Electric fields and currents) – Magnetospheric physics (Magnetosphere-ionosphere inter-actions, Electric fields)
Correspondence to:D. V. Sarafopoulos ([email protected])
1 Introduction
The “field line resonance (FLR) phenomenon” is of funda-mental importance if we are going to study ULF pulsations within the Earth’s magnetosphere or in other planetary sys-tems as well. The purpose of this work is to focus our at-tention on ground recorded events that seemingly appear as representative FLR phenomena, but actually they are not.
The FLR theory has been developed by Tamao (1965), Southwood (1974), and Chen and Hasegawa (1974): a fast mode type surface wave at the magnetopause couples res-onantly with Alfv´en modes in the magnetosphere due to nonuniformity of the background plasma. The resonant field line is characterized by maximum perturbation amplitude, as well as an 180◦ phase shift of the toroidal magnetic field
perturbation. On the ground and across the resonant field line the polarization sense changes for the horizontal mag-netic field perturbation. For the case studies of this work, the solar wind pressure is investigated and probably it changes quasi-periodically and modulates the magnetopause surface throughout the events under study. Therefore, the imposed compression oscillations may actually couple to toroidal-mode standing Alfv´en waves at the locations where the driver frequency matches the local toroidal-mode Alfv´en frequency (look also at the review papers of Hughes, 1994; Glassmeier, 1995a; Takahashi, 1998). The same notion is treated by nu-merical simulations (Lee and Lysak, 1991).
We study cases of ground-based observations with “one resonant field line”, and we eventually infer that the sup-posed resonances do not exist at all. For instance, the ob-served characteristic phase shifts of 180◦are not caused by
the FLR mechanism. In these cases there is no any oscillating magnetic field structure, but only a passive magnetosphere response to a solar wind pressure wave. We understand these events as completely disassociated by any scheme of toroidal oscillations. The toroidal oscillations, which frequently have been observed by satellites in a wide range of L (Anderson et al., 1990; Nos´e et al., 1995; Potemra and Blomberg, 1996), are probably excited in our cases, but they are screened off from the Earth’s observations. We suggest that the toroidal oscillation effects, at least for the case studies included in this work, are covered up by the much stronger effects pro-duced by the direct action of a solar wind pressure wave. A basic tool in this research effort is Tsyganenko’s T96 model of magnetosphere magnetic field (Tsyganenko, 1995, 1996) that maps the ground station positions to conjugate points over the equatorial plane. We know the geographic coor-dinates for each ground station, that is the footpoint for a field line at the Earth’s surface, and the trace that line for a specified moment of universal time (UT) using Tsyganenko’s T96 01 model (the 22 April 2003 version is used). We ap-ply this model in the dawnside magnetosphere and the con-jugate points of IMAGE stations are traced over the magne-totail current sheet. These (X, Y)GSM points are determined
as those along the field line with ZGSM=0. We use the new
T96 model, which was developed with continuous depen-dence on the solar wind pressure, interplanetary magnetic field (IMF) andDst-index, replacing earlier binning into sev-eralKp-index intervals.
We study four selected events, and we certainly do not per-form any statistics. Additionally, any arbitrary generaliza-tion or simplificageneraliza-tion is beyond our intengeneraliza-tion and out of the scope of this work. However, the suggested discrimination between pseudo- and genuine-FLR events is of great impor-tance and may lead us to resolve the existing discrepancy between ground and in-situ observations within the magne-tosphere concerning the FLR phenomenon.
Takahashi (1998) in his review many times stressed that “it is of great importance to examine the state of the solar wind at times when magnetic pulsations are observed on the ground”. This suggestion is seriously taken into account in this work, although the solar wind data, for the majority of the cases, are of low resolution and available from only one satellite, which was often positioned distant from the x-axis. The same methodology of approach, although the emphasis was to monitor the solar wind conditions by multi-satellite instruments, was applied in a recent work by Sarafopoulos (2004a).
This article further supports and expands the results of a previous work performed by Sarafopoulos (2004b). Among other findings he presented geographic latitude-dependent delays in signature arrival times at dawnside ground magnetograms. He stressed the great importance for
these dispersive structures and demonstrated that these are directly dictated by successive exo-magnetosphere pressure pulses applied along the magnetopause. Another work very frequently mentioned here is that by Sarafopoulos (2004a), in which, observationally, it has been established that a solar wind pressure pulse (stepwise pressure variation) produces a twin-vortex (single vortex) current system over the ionosphere. In this work, and specifically within the discussion section, we conclude that the pseudo-FLR events are associated to repetitive tilted twin-vortex structures over the ionosphere. Key observations and possible source mechanisms concerning the ionosphere twin vortex structure can be found in the works by Glassmeier (1992), and Lanzerotti et al. (1986).
By itself, the idea that frequencies of some of the ULF pulsations are defined not by the internal structure/size of the magnetosphere (cavity modes, FLRs), but rather by the frequency of some external driver (e.g. solar wind) interact-ing with the magnetopause or plasmapause, is well known since the paper by Lanzerotti et al. (1973). Earlier refer-ences suggesting Pc5 pulsations within the magnetosphere directly driven by a solar wind pressure wave can be found in Sarafopoulos and Sarris (1994), and Sarafopoulos (1995).
2 Observations
2.1 Two ground-based examples with “just one resonant field line”
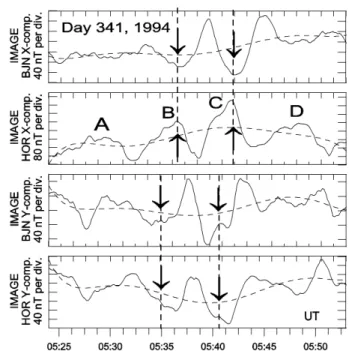
As we have stressed in the Introduction there are examples of ground-based observations suggesting the presence of “just one resonant field line”. These events could have been er-roneously categorized as FLRs, in the past. Bellow, in a first approach to our subject, we present two such events in Figs. 1 (day 179, 2001) and 2 (day 341, 1994), whereby only a few aspects of great importance are emphasized. The traces from only two successive in latitude ground stations (i.e. Bear Island-BJN and Tromsø-TRO or Hornsund-HOR, see Table 1) are shown, in between the supposed resonant L-shell is located. These Pc5 pulsations show waves char-acterized by a phase-shift of 180◦between the X-component
traces (top two panels), whereas for the Y-component traces show waves almost in-phase (next two panels). The dashed line along each trace is a sixth degree polynomial fitting for the shown measurements. Given that across a typical FLR the change in polarization is equivalent to a change in the phase of one of the horizontal magnetic field perturbation components by 180◦(Glassmeier et al., 1999), then both of
Fig. 1. X and Y component magnetograms, from two successive in latitude (i.e. BJN and TRO) ground stations of the IMAGE ar-ray, for the event of day 179, 2001. Between the two stations the X component traces show waves in anti-phase, whereas the Y compo-nents vary in-phase. The HOP (KIL) station, which has a latitude higher (lower) than that of the BJN (TRO) station, shows right-hand (left-hand) polarized waves.
whereas KIL corresponds to an inner shell, while the polar-ization changes from right-hand (RH) to left-hand (LH), as one would anticipate in agreement in the current FLR model. It must be underlined (and it is shown later on) that the pul-sations, in both events, are extended from the lowest up to the highest latitudes of IMAGE stations (i.e. a range of∼20◦ in latitude); and in this way the monochromatic character of oscillation is apparent. In a first glance, one may consider that the maximum pulsation amplitude occurs just at the sup-posed FLR shell. The latter is not true because, as we shall see later on, there are characteristic latitude displacements in observed maximum amplitudes in disagreement with the FLR mechanism.
Below we scrutinize in detail the two already exhibited introductory examples and we question that they are actu-ally FLRs. We are interested in all the available data sets, and especially in those carrying information about the exo-magnetospere conditions. Two more events are included and analyzed in this subsection aiming to establish the dis-crimination effort, undertaken in this work, between local FLRs and other large-scale structures like the twin-vortex
Fig. 2.Same format as in Fig. 1, for the event of day 341, 1994. The X-component wave at HOR changed its phase by 180◦as compared to that at BJN. The Y-component traces show pulsations in-phase.
ionosphere current systems. Nevertheless, open questions will remain, and a statistical work, for instance, will be of great importance.
2.2 First event on 28 June (day 179) 2001
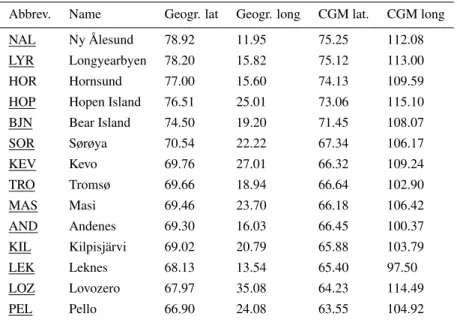
Table 1.Geographical and CGM coordinates of IMAGE stations.
Abbrev. Name Geogr. lat Geogr. long CGM lat. CGM long NAL Ny ˚Alesund 78.92 11.95 75.25 112.08 LYR Longyearbyen 78.20 15.82 75.12 113.00 HOR Hornsund 77.00 15.60 74.13 109.59 HOP Hopen Island 76.51 25.01 73.06 115.10 BJN Bear Island 74.50 19.20 71.45 108.07 SOR Sørøya 70.54 22.22 67.34 106.17 KEV Kevo 69.76 27.01 66.32 109.24 TRO Tromsø 69.66 18.94 66.64 102.90 MAS Masi 69.46 23.70 66.18 106.42 AND Andenes 69.30 16.03 66.45 100.37 KIL Kilpisj¨arvi 69.02 20.79 65.88 103.79 LEK Leknes 68.13 13.54 65.40 97.50 LOZ Lovozero 67.97 35.08 64.23 114.49 PEL Pello 66.90 24.08 63.55 104.92
1X variation of∼30 nT. In Fig. 4 we have placed over the equatorial plane XY, the conjugate points for several IMAGE stations using the Tsyganenko T96 model; a process similar to that performed by Sarafopoulos (2004b). The solar wind parameters are determined by the ACE spacecraft located at (X, Y, Z)GSE=(247.5, 23.5, 12.8)RE, at 03:30 UT. The solar
wind velocity is Vx=400 km·s−1and the needed travel time
is∼65 min. Therefore, we input to the model By=−0.2 nT,
Bz=0.3 nT, P=1.2 nPa and Dst=7 nT for the time 04:30 UT.
The geomagnetic activity is extremely low for a prolonged interval preceded this event. The ground station conjugate points, as they are shown in Fig. 4, are associated with dif-ferent magnetopause surface displacements, given that the magnetopause surface is wavy modulated. According to this scenario, the phase information of the surface wave is prob-ably transmitted directly to the ionosphere via the magnetic field lines, as it is suggested by Sarafopoulos (2004b). A close look at the just proposed mechanism will be given in the discussion section. This time, using in-situ satellite mea-surements, it is of prime importance to provide convincing evidence that a surface wave actually exists. The observa-tional evidence is based on Cluster satellites, as well as on the Geotail, LANL 1994-084 and ACE satellites, and is ex-hibited below:
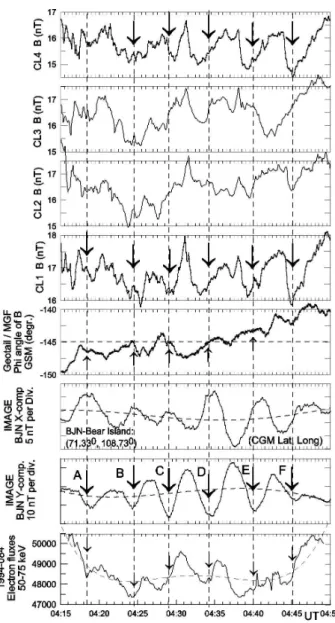
(a) Cluster 3 (CL3), at 04:30 UT, was located at (X, Y, Z)GSE=(−5.57, −16.26, 5.57)RE, and its position is
shown in Fig. 4. The magnetic field amplitudes (FGM experiment; Balogh et al., 1997) for all four spacecraft are shown in the four upper panels of Fig. 5. It is clear that the six major decreases marked with the A-F capital letters along the BJN Y-component trace (sev-enth panel) are seen at the CL1 and CL4 magnetic field magnitude variations. The Cluster spacecraft remains
at the plasma sheet boundary layer region (PSBL), and the whole boundary structure seems to oscillate with the same frequency observed in ground stations. We note that Pc5-type standing waves over the PSBL re-gion are commonly observed, and a representative work is that by Sarafopoulos and Sarris (1991). The CL1 and CL4 magnetic field magnitudes are probably affected by the same magnetopause surface wave travelling tail-ward. The very good anti-correlation between the Bx
and Bz traces at CL1 (not shown here) confirms that
CL1 enters periodically into the plasma sheet, where the diamagnetic effect of plasma particles reduces the mag-netic field magnitude, whereas the Bz increases.
Addi-tionally, all four Cluster spacecraft at∼04:31 UT exit abruptly toward the lobe domain. In a close look at this transition, each satellite reaches a peak value in a slightly different moment, and this delay is probably due to the surface wave that propagates tailward. Ac-tually, the detected order of peaks in Fig. 6 corresponds to what one would anticipate for tailward wave prop-agation. The spacecraft1X distances from the refer-ence satellite CL3 are: 1X13=1124,1X23=−919 and
1X43=−238 km. A rough estimate of velocity using CL1 and CL3 (or CL1 and CL4) is inferred at 187 km·s−1(151 km·s−1). Again, we stress the fact that this estimate is not based on boundary crossings, but on vari-ations observed well within the plasma sheet.
(b) The geostationary satellite LANL 1994-084 is charac-terized by the longitude 103.42◦, and consequently at
04:30 UT it was positioned at 169.92◦, that is close to
are shown at the bottom panel of Fig. 5. Indeed, this time profile of fluxes shows six major decreases, one-to-one corresponding to the ground BJN Y-component minima. Consequently, the electron fluxes are probably modulated by the same magnetopause surface wave that affects the ground magnetograms.
(c) Geotail at 04:30 UT was located at (X, Y, Z)GSE=
(−8.58,−5.4, 0.5)RE, (see Fig. 4). The Geotail
vec-tor magnetic field is slightly affected during the interval under study and such a variation is better traced through the By magnetic field component, which is shown in
the fifth panel of Fig. 5. At least the first five major deviations seem to show the same periodicity with the supposed magnetopause surface wave, the BJN pulsa-tions, the Cluster 1 and 4 magnetic field variations and the 1994-084 flux wave.
(d) The low resolution time (64 s) of the ACE/SWEPAM proton density instrument prevents us from monitor-ing fast variations in the solar wind conditions. Only a major density decrease (Fig. 7, first panel) seems to occur with an abrupt ACE/MAG magnetic field mag-nitude increase at ∼04:32. However, the ACE mag-netic field magnitude in Fig. 7 (second panel) shows indicative variations marked with arrows that may cor-relate to the BJN station variations (third panel). We have to note that the ACE time series are time-shifted 67 min to match the ground data. The latter is dictated by the ACE position and the solar wind velocity being ∼400 km·s−1. Therefore, in this case we do not have a direct convincing observational evidence for a solar wind pressure wave, although we are much more certain of the development of a magnetopause surface wave. We also note that for a much more extended time in-terval, than that shown in Fig. 7, the solar wind proton density is generally anticorrelated to the magnetic field magnitude.
2.3 Second event on 7 December (day 341) 1994
A stack of seven X-component ground magnetograms during the interval 05:20–06:00 UT, of day 341, 1994, are shown in Fig. 8. A first and foremost observational feature, which is emphasized by the five slant-dashed lines, is that there is a systematic phase shift in magnetometer waveforms or a de-lay time in arrival of each of the five distinct ground signa-tures, marked with the letters a–e. The delay time increases from bottom to top, as we move to higher latitudes. The phase-shift is gradual, and consequently, we fail to determine an L-shell at which the phase changes abruptly 180◦, as it
would be anticipated in a typical FLR. It seems that the sta-tion latitude is directly associated with the signature arrival time. In particular, we pay attention to changes in phase ob-served at the moment 05:42 UT. If we consider that an abrupt phase change of∼180◦occurs between the stations BJN and Sørøya-SOR or Masi-MAS, with maximum1X variations
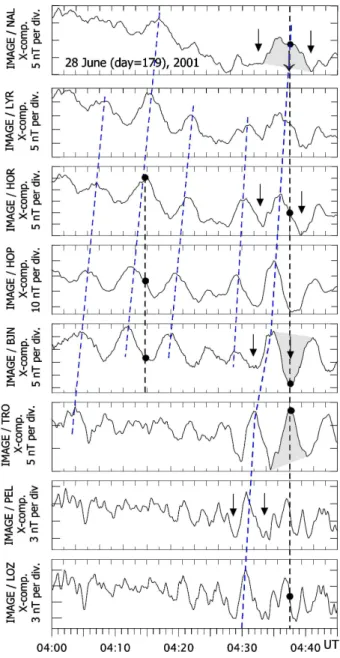
Fig. 3. A stack of eight X component magnetograms from the IMAGE array concerning the event of day 179, 2001. The slant-dashed lines emphasize the dispersive character in signature arrival times. In particular, we pay attention to the double phase change of 180◦which occurred at∼04:37 UT.
∼100 and 80 nT, respectively, then the largest amplitude os-cillation (1X≈250 nT) will be observed at HOR, which is not adjacent to the supposed resonant L-shell. If we con-sider that a phase change of∼180◦occurs between the sta-tions NAL and BJN, then we shall infer that two FLRs are simultaneously excited with the same frequency at different L-shells; an unacceptable hypothesis. As we shall discuss later on, the presented ground signatures are not associated with FLRs, but with successive twin-vortex ionosphere cur-rent systems.
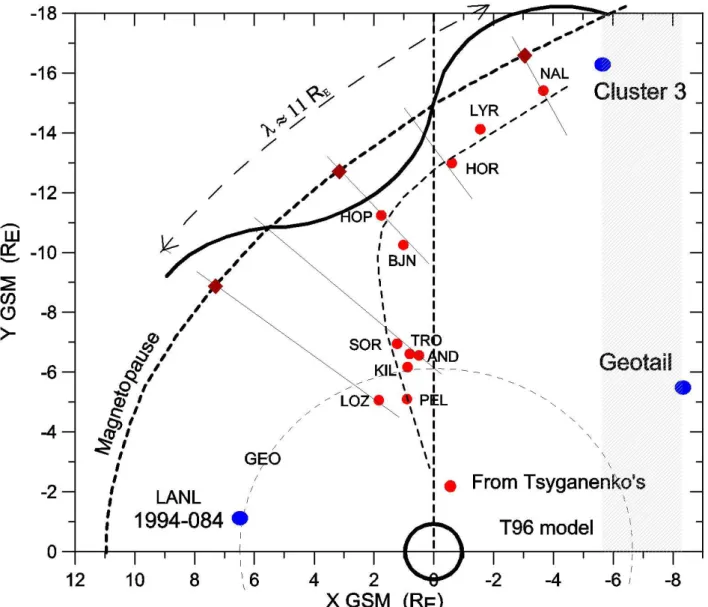
Fig. 4. Cluster 3, Geotail and LANL 1994-084 satellite positions, projected over the XY plane, are shown for the event of day 179, 2001, at 04:30 UT. The points NAL, LYR, HOR, HOP, BJN, SOR, TRO, AND, KIL, LOZ and PEL are determined via the T96 model as the conjugate points of these ground stations over the XYGSM plane. For this event, the magnetopause surface wavelength is∼11RE, and
therefore different stations are associated with different amounts of magnetopause surface displacements.
and, in general, the recorded waveforms are disturbed, as is the case for the SOR and MAS station traces in Fig. 8. In this case it is interesting to present, with the same format, the stack of the Y-component variations (Fig. 9) which shows the first three variation cycles better (marked with the letters a, b and c) and extended from NAL to MAS. Although the lower latitude Y traces are modulated by higher frequencies, nev-ertheless, the major decreases (and especially the c) are sim-ilar to those at higher latitudes. Moreover, this Y-component stack provides the opportunity for the reader to look at the Y-component variations associated with this event.
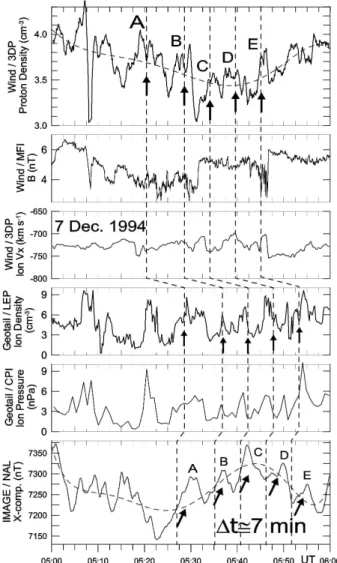
Given that the knowledge of interplanetary conditions is of prime importance, we inspect carefully the exo-magnetosphere parameters. Figure 10 shows, from top to
bottom, the Wind/3DP proton density, the Wind/MFI mag-netic field amplitude, the Wind/3DP ion velocity Vx of
so-lar wind, the Geotail/LEP ion density in dawnside magne-tosheath, the Geotail/CPI ion pressure, and the X-component from the IMAGE/NAL station. At 05:30 UT Wind and Geo-tail were positioned at (X, Y, Z)GSE=(53.5,−38.8,−1.8) and
(−26.7,−20, 5)RE, respectively. The dashed lines at the top
and bottom panels are sixth degree polynomial fitting lines demonstrating that the major minimum of solar wind den-sity (and the minimum of pressure as well, because the solar wind velocity Vx remains essentially unchanged during the
Fig. 5.From top to bottom, magnetic field amplitudes (in nTs) from Cluster 4, 3, 2 and 1, magnetic field azimuthal angleφ(in degrees) from Geotail, X and Y components from the BJN station magne-togram (in nTs), and 50-75 keV energetic electron differential fluxes from the 1994-084 satellite. The vertical dashed lines define the distinct decreases marked with the capital letters A-F along the Y component trace of the BJN station.
pressure variations to travel from Wind to Earth with the so-lar wind velocity of∼720 km·s−1. The same Wind density variations are seen∼9 min later within the dawnside mag-netosheath by Geotail. The Geotail/LEP ion density and the Geotail/CPI ion pressure measurements (Fig. 10, fourth and fifth panels) support, in general, our conclusion although the magnetosheath plasma regime is, as usual, very disturbed. We have to note that the editor-B LEP instrument measure-ments are very useful here, because we are interested in den-sity variations and not in absolute values. There is proba-bly a cause and effect relationship between the two sets of five peaks marked with capital letters in the top and bottom
Fig. 6. Magnetic field amplitude variations (in nTs) for all four Cluster satellites, as they approach the lobe structure characterized with increased strength.
Fig. 7. The solar wind proton density (cm−3) and velocity
(km·s−1), as well as the magnetic field amplitude (nT), as measured
Fig. 8. Same format as in Fig. 3, for the event of day 341, 1994. In particulary, we pay attention to the dispersive peaks marked with the letters (a), (b) and (c), as well as to the double phase change of 180◦which occurred at∼05:42 UT.
panels: each individual increase/decrease along the density trace produces a distinct signature on the ground.
Therefore, for this event, it seems that the ground Pc5 pul-sations, marked with the letters A–E, are forced oscillations imposed by upstream pressure variations.
2.4 Third event on 2 August (day 214) 2001
During the interval 05:00–05:25 UT of day 214, 2001, the IMAGE ground stations show large amplitude pulsations with peak-to-peak amplitudes up to∼60 nT, and a periodic-ity of∼5 min (Fig. 11). Apparently, there is a gradual phase shift between the neighbour station waveforms, given that the station latitudes decrease from top to bottom; the dashed-slant lines emphasize this observational feature. Between the NAL and BJN traces the phase changes by 180◦(look at the
solid circle symbols). It is worth noticing that the pulsa-tion amplitudes from NAL to BJN (i.e. a latitude range of ∼4.4◦) remain almost constant. The latter is not consistent
Fig. 9.Same format as in Fig. 3, concerning the Y component mag-netograms for the event of day 341, 1994. The dispersive character for the decreases marked as (a), (b) and (c), is apparent for all the stations in a latitude range extended from NAL to MAS.
with the typical FLR phenomenon, which is principally ex-cited in a narrow latitudinal region. According to our under-standing, if we place the ground stations over the equatorial plane via the T96 model, then we will have a picture much like that given in Fig. 4. In this framework, we can assume that the NAL, Longyearbyen-LYR, HOR, HOP and BJN sta-tions of this event have conjugate points, over the equatorial plane, which are iso-distant from the magnetopause bound-ary. At 05:00 UT the Geotail satellite was located at (X, Y, Z)GSE=(7.2, 25.2, 4.9)RE, within the magnetosheath proper.
Fig. 10.From top to bottom, proton density (cm−3), magnetic field
amplitude (nT) and ion velocity Vx (km·s−1)measured by Wind, ion density and pressure (nPa) measured by Geotail, and X compo-nent variations recorded by NAL. The variations marked with the capital letters A–E along the NAL trace are probably dictated by distinct solar wind density increases.
2.5 Fourth event on 19 July (day 200) 2001
Eight X-component magnetograms from the IMAGE sta-tions, with decreasing latitudes, are shown in Fig. 13, for the interval 04:00–05:00 UT of day 200, 2001. The three slant-dashed lines facilitate discerning the systematic delays in arrival time of distinct ground signatures. The vertical-dashed line at 04:38 UT provides a reference time in order to discern the phase shifts among adjacent stations, while the two simultaneous phase changes of ∼180◦ are underlined
with the three solid circle symbols. In the context of this work, these phase changes are not caused by FLRs, but most probably they are the genuine result of a magnetopause sur-face wave affecting the ionosphere currents. It seems that a surface wave, with one wavelength in extent, maps over the ionosphere and along a meridian chain of stations, and in this
Fig. 11. Same format as in Fig. 3 for the event of day 214, 2001. In particular, we pay attention to the phase changes observed at
∼05:17 UT.
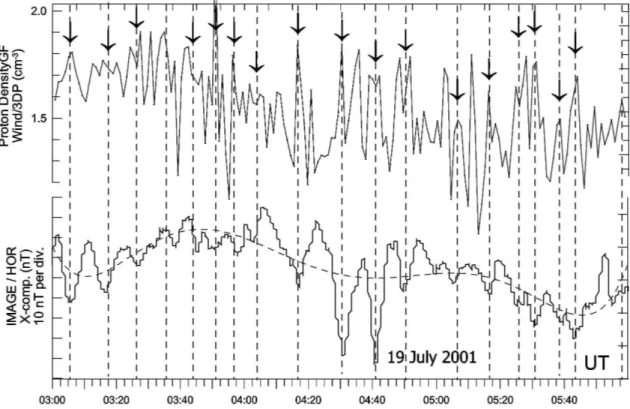
way produces the two∼180◦phase-shifts. As it is explained in detail in the Discussion section, we consider that the two phase changes are associated with a tilted twin-vortex current system. Such a scenario would be largely supported by a so-lar wind pressure wave with the same frequency. Searching for this possibility, for this event, we study the Wind/3DP in-strument measurements of solar wind proton density, in par-allel to the IMAGE/HOR station X-component pulsations, in Fig. 14. The Wind data are shifted in time by 39 min to match the ground data. Wind was positioned at (X, Y, Z)GSE=(251.5, −5, 24.1)RE, at 04:00 UT, while the
Wind was located close to the x-axis and probably monitored the appropriate conditions applied later over the magneto-sphere. Certainly, the one-to-one correspondence is a risky undertaking mainly because Wind was located far upstream, but we think that it is beyond any doubt that the solar wind density shows an intense quasi-periodic variability which is the ultimate source for the ground wave activity. In any case, the solar wind density wave validates our hypothesis of as-suming a magnetopause surface wave.
3 Discussion
3.1 A tilted twin-vortex system of Hall currents over the ionosphere
Sarafopoulos (2004a), using multi-satellite (Wind, Geotail, Interball, IMP 8 and GOES 8) and multi-instrument obser-vations of plasma and magnetic field, confirmed, with in-situ measurements, that every individual solar wind inher-ent pressure pulse (stepwise variation) that strikes the Earth’s magnetosphere produces a twin-vortex (single vortex) sys-tem of ionosphere currents at the high-latitude ground mag-netograms. He scrutinized, in detail, the ground signatures, while the twin- or single-vortex current systems are studied using the IMAGE array. The differentiation in this study is that many successive solar wind pressure variations are in-volved that logically create a magnetopause surface wave, which, in turn, probably develops successive twin-vortex cur-rent structures over the ionosphere. The new observational feature incorporated in this work is that the presented ground signatures show characteristic latitude-dependent dispersive structures probably originated by tilted twin-vortex current systems. Similar ground dispersive structures caused by a so-lar wind pressure wave are extensively studied by Sarafopou-los (2004b) and therefore, we are based on his results. In par-ticular, his proposed mapping mechanism of magnetosphere compressions to the ionosphere level is completely adopted in this work. Nevertheless, we have to stress the fact that the dispersive structures exhibited in this study add a new dimen-sion to the previous work by Sarafopoulos. The systematic shift in phase leads here to twofold successive phase-changes of 180◦; a precious detail as far as the FLR phenomenon is
discussed.
Below we assume a tilted twin-vortex ionosphere current system, which although naturally travels antisunward, in the sketch of Fig. 15 it is considered stationary, whereas the Earth stations A, B and C are thought to move sunward below the supposed structure of Hall currents. The A (C) station corresponds to the highest (lowest) latitudes of the IMAGE array magnetometers. The tilted vortices will produce dif-ferent ground responses along the three tracks (horizontal-dashed lines) marked as A, B and C, and these responses are drawn underneath the vortices in Fig. 15. For each track the X and Y magnetometer components are sketched, while the horizontal axis always shows the universal time. More specifically, according to Fig. 15, the X-component
signatures (look at the shaded areas) along the tracks A, B, and C will be negative/positive (i.e. a NP-bipolar signature), positive/negative/positive (PNP), and positive/negative (PN), respectively. The latitude-dependent double phase-change of 180◦ at the moment characterized as t
1 is similar to the observations shown in Fig. 3 (at ∼04:37 UT), Fig. 8 (at ∼04:42 UT), and Fig. 13 (at∼04:38). All three stations for the Y component will show a NPN signature, which should be slightly shifted in time for the station B and even more for the station C, although the latter observational element is not incorporated in Fig. 15. Actually, the Y component does not show abrupt phase changes, like the X-component, and this is what we have observed in Figs. 1 and 2 corresponding to the events studied later in Figs. 3 and 8. Therefore, it is inferred that the large-scale structure of a tilted twin-vortex current system suffices to reproduce all the observational fea-tures of studied events; it is not necessary to invoke any res-onant magnetic field shell.
A rough estimate of the tilt angle is possible under an as-sumption concerning the longitudinal extent of the twin vor-tex structure. Thus, if we assume that the longitudinal extent is equal to the latitudinal one, then the east-west velocities for the second and fourth case studies will be 3 and 2.2 km·s−1, and the computed tilt angle will be 50◦ and 65◦,
respec-tively. In the fourth case study, if we assume the velocity of 4.4 km·s−1, then the tilt angle will be 50◦, too. Certainly, the introduced velocities are close to those estimated by Glass-meier (1992). A more realistic estimate for the tilt angle, in a future effort, must be based on two different ground arrays, for instance, the Greenland and IMAGE arrays.
3.2 Discrepancies between the presented events and an au-thentic FLR
Many ground events with Pc5 pulsations appear seemingly as FLRs, but actually they are pseudo-field line resonance events. They show phase changes of 180◦ in the
X-component magnetograms, and a large or even maximum wave amplitude response close to the supposed resonant L-shell. Below we summarize the diagnosed discrepancies be-tween the presented events and an authentic FLR event:
(a) The dispersive ground structures that accompany the studied pseudo-FLR events demonstrate an observa-tional feature that the typical FLR mode could not nor-mally produce. We anticipate a FLR to produce sym-metric current structures on the ionosphere level and along a magnetic meridian plane.
Fig. 12. Ion density, vector magnetic field data, and ion pressure measured by the Geotail satellite within the magnetosheath proper. These measurements correspond to the pulsation event presented in Fig. 11.
our understanding this happens because the HOP sta-tion, over the equatorial plane, maps closer to the mag-netopause surface (see Fig. 4), which is wavy modu-lated. Additionally, the decrease in amplitudes, as one moves away from a supposed L-resonant shell, is not abrupt (for instance, look at the Sect. 2.4), as the FLR theory dictates.
(c) A basic element in this research effort is the funda-mental notion according to which there is a system-atic tailward displacement for the magnetosphere mag-netic field flux tubes located close to the magnetopause: The closer to the magnetopause the tube is placed, the stronger the tailward displacement must be. We have
Fig. 13. Same format as in Fig. 3 for the event of day 200, 2001. In particular, we pay attention to the changes of phase observed at
∼04:38 UT.
also to note that the latter in not merely a qualitative as-sumption, but it is quantitatively supported by the T96 magnetosphere magnetic field model. In this type of approach, a meridian chain of ground stations does not produce a radial placement for the station conjugate points over the equatorial plane. Conversely, in par-ticular, the higher latitude stations are projected, over the XY plane, to positions along the magnetopause, and therefore are associated with different phases of the magnetopause wave.
Fig. 14.Solar wind proton density (cm−3)measured by Wind, along with X component variations from the HOR station magnetogram, for
a three-hour interval of day 200, 2001. The Wind data are shifted in time 39 min to match the ground data.
systems, as it is suggested in the first Discussion subsec-tion. These travelling convection vortices are magnetic field and current structures organized in large scales, as opposed to localized FLR structures estimated to be ∼0.5RE in extent over the equatorial plane and about 100 km over the ionosphere plane (Singer et al., 1982; Mitchell et al., 1990; Glassmeier et al., 1999). Our Fig. 4 demonstrates that a twin-vortex ionosphere struc-ture corresponds to a surface span of≈11RE (i.e. the
magnetopause surface wavelength that is λ≈11 RE).
The typical FLR phenomenon, as determined by ground radar, is extended in latitude∼2◦(Walker et al., 1979),
whereas our events extend in a range of at least∼20◦in
latitude.
(e) The already presented ground events with Pc5 pulsa-tions are probably originated by magnetopause surface waves due to solar wind pressure waves. Toroidal reso-nances commonly have been observed by AMPTE/CCE (Anderson et al., 1990; Nos´e et al., 1995; Engebretson et al., 1986), and ISEE 1 and 2 (Mitchell et al., 1990) in a wide range of L. Anderson et al. (1989) pointed out that the AMPTE/CCE did not observe large ampli-tude resonances on discrete L shells such as are com-monly seen on the ground. Our second studied event shows Pc5 waves with a peak-to-peak value∼250 nT. Therefore, the FLR effects on the ground may are com-pletely covered up by the much larger amplitude waves due to the magnetopause surface waves. Certainly the
ionosphere “spatial integration” is another possibility for screening out the FLR effects from the ground ob-servations.
3.3 The cavity-waveguide mode
The following arguments do not encourage us to adopt the excitation of a cavity mode as the ultimate mechanism able to produce the observed pulsation events:
(a) In the three out of four presented case studies, it is clear that the X-component traces of IMAGE stations, with decreasing latitude, show two phase-shifts of∼180◦at the same time. The latter means that the polarization sense changes twice. If both phase shifts are attributed to FLRs, then it would be inferred that two different L-shells resonate with the same frequency simultane-ously, which is apparently unacceptable. Therefore, these phase-shifts are not associated with FLRs. (b) We have suggested that a tilted twin-vortex ionosphere
(c) Samson et al. (1992) and Walker et al. (1992) reported that the cavity mode frequencies vary little and do not depend on the geomagnetic conditions. Our events of ground pulsations show the periodicities of T∼=6.5 min (Fig. 8), 5 min (Figs. 5 and 11) and∼10 min (Fig. 13), which most probably correspond to the solar wind sim-ilar pressure wave periodicities. Therefore, the detected ground frequencies probably do not reflect any eso-magnetosphere process independent of outside condi-tions, as should be the situation for an excited cavity mode.
(d) Samson et al. (1991; see also Walker et al., 1992) argued that “there is a definite preference for ground high lati-tude FLRs to be excited at certain frequencies”. They claimed that these frequencies are the eigenfrequen-cies for the magnetosphere cavity (Hughes, 1994). In our cases the high latitude field lines are actually ex-cited in the Pc5 frequency band, but the quasi-periodic Pc5 pulsations are directly forced by a solar wind pres-sure wave affecting first and foremost the near magne-topause magnetic shells. The magnetosphere seems to respond in a passive way, and the identified periodic-ity along the ground magnetograms is merely the final synthesis of unique and individual events of solar wind pulses. Each pulse produces a twin-vortex current sys-tem (Sarafopoulos, 2004a), and successive pulses pro-duce repetitive twin-vortex structures. In a large degree, the cavity mode model was introduced to play the same role as a monochromatic solar wind energy source. It seemed that the cavity mode would resolve the problem of the “one resonant line” that frequently is observed in ground data. In our case studies, the identified “one resonant line” in ground events is closely and always associated with a solar wind pressure wave, or a mag-netopause wave, which naturally produces the large-scale twin-vortex current systems (the so-called pseudo-FLRs) and no authentic local FLRs.
3.4 About the discrepancy between ground phase velocities and those of magnetopause surface waves
It was stressed by Hughes (1994) that if the azimuthal phase velocity measured by Hughes et al. (1978) and Olson and Rostoker (1978) on Earth was mapped out to the magne-topause, speeds of 500–1000 km·s−1 should be obtained. These speeds are well in excess of typical magnetosheath ve-locities, whereas the phase speed of Kelvin-Helmholtz (KH) surface waves should be slower than the magnetosheath ve-locities. This inconsistency between the pulsation and KH surface wave velocities is characterized by Hughes (1994) as “an enigma”. In the context of this work, we have to pay at-tention to the inference that at high latitudes the ionosphere east-west velocity does not correspond to the magnetopause boundary velocity. Instead, from the dispersive structures presented in this work and corresponding to the dawnside magnetosphere, we can estimate the north-south component of velocity which actually maps to the surface velocity, given
that the T96 model is taken into account. For the first case study we compute the ionosphere north-south velocity ∼3.5 km·s−1, which corresponds to the surface wavelength
λ∼=11REand the surface phase velocity of∼230 km·s−1.
3.5 Twin-vortex systems mapping well-inside the magne-topause
In his Fig. 12 Sarafopoulos (2004b) has proposed a possi-ble generation mechanism for single, as well as multiple, twin-vortex current systems. According to his model, a mag-netopause surface wave dictated by a solar wind pressure wave, having an extent of one wavelength, will produce a distinct twin-vortex structure. This structure is apparently a pair of two travelling convection vortices (TCVs) originated well-inside the magnetopause boundary. This is further sup-ported in this work with dispersive structures displaying two phase-shifts of 180◦, at the same time, and producing pairs of
tilted TCVs. This work (Fig. 4) shows emphatically that the twin-vortex systems map to the region well-inside the mag-netopause boundary. Our work lines up with the result of Moretto and Yahnin (1998), who found that the TCV centres map to deep inside the magnetosphere and not to the magne-topause. Therefore, it naturally follows that the field-aligned currents associated with our studied TCVs must be produced within the magnetosphere.
4 Conclusion
In this work we study Pc5 ground pulsation events with dis-crete and remarkably stable frequencies and discriminate be-tween FLRs and tilted twin-vortex repetitive structures. The latter are called in this work pseudo-FLRs, because these events appear seemingly as field line resonances: They show impressive changes in polarization sense, while they max-imize their amplitude at or close to the supposed resonant magnetic field shell. For all the studied cases, with in-situ measurements, we have confirmed the existence of a mag-netopause surface wave, which most probably seems to be dictated by a solar wind pressure wave. Therefore, in our case studies, the identified “one resonant line”, in ground events, is closely and always associated with a magnetopause wave, which naturally produces the twin-vortex current sys-tems and no local FLRs. Our events are associated with tilted large-scale twin-vortex ionosphere structures corre-sponding to magnetopause surface waves with a wavelength 10–20RE. Between an authentic FLR event observed within
the magnetosphere and a twin-vortex structure there is a scale factor 20–40, over the equatorial plane. The pseudo-FLR events often display two latitude-dependent phase-shifts of 180◦, and are associated with field-aligned currents that are
Acknowledgements. We are grateful to all Principal Investigators of the experiments MGF, LEP and CPI/SWA of Geotail; MFI, and 3DP of Wind; MAG and SWEPAM of ACE; FGM of Cluster and the energetic particle experiment of LANL 1994-084. Concerning the use of ground magnetometer data, we are grateful to the Finnish Meteorological Institute (FMI/GEO), the Technical University of Braunschweig and other institutes that maintain the IMAGE mag-netometer array. The author thanks both of referees.
Topical Editor T. Pulkkinen thanks S. Pilipenko and another ref-eree for their help in evaluating this paper.
References
Anderson, B. J., Engebretson, M. J., Rounds, S. P., Zanetti, L. J., and Potemra, T. A.: A statistical study of Pc 3-5 pulsations observed by the AMPTE/CCE magnetic fields experiment, 1, Occurrence distributions, J. Geophys. Res., 95, 10 495–10 523, 1990.
Balogh, A., Dunlop, M. W., Cowley, S. W. H., Southwood, D. J., Thomlinson, J. G., and the Cluster magnetometer team: The Cluster Magnetic Field Investigation, Space Sci. Rev., 79, 65– 92, 1997.
Chen, L. and Hasegawa, A.: A theory of longperiod magnetic pul-sations, 1. Steady state excitation of field line resonance, J. Geo-phys. Res., 79, 1024–1032, 1974.
Engebretson, M. J., Zanetti, L. J., Potemra, T. A., and Acu˜na, M. H.: Harmonically structured ULF pulsations observed by the AMPTE CCE magnetic field experiment, Geophys. Res. Lett., 13, 905–908, 1986.
Hughes, W. J., McPherron, R. L., and Barfield, J. N.: Geomagnetic pulsations observed simultaneously on three geostationary satel-lites, J. Geophys. Res., 83, 1109–1116, 1978.
Hughes, W. J.: Magnetospheric ULF waves: A tutorial with a his-torical perspective, in Solar Wind Sources of Magnetospheric ULF Waves, Geophysical Monogr. Ser., vol. 81, edited by En-gebretson, M. J., Takahashi, K., and Scholer, M., 1-11, AGU, Washington, D. C., 1994.
Glassmeier, K.-H.: Traveling magnetospheric convection twin vor-tices: observations and theory, Ann. Geophys., 10, 547–565, 1992.
Glassmeier, K. H.: ULF pulsations, in: Handbook of Atmospheric Electrodynamics, Volume II, edited by Volland, H., University of Bonn, Germany, 463–502, 1995a.
Glassmeier, K. H.: Ultralow-frequency pulsations: Earth and Jupiter compared, Adv. Space Res. Vol. 16, No. 4, (4)209– (4)218, 1995b.
Glassmeier, K. H., Othmer, C., Cramm, R., Stellmacher, M., and Engebretson, M.: Magnetospheric field line resonances: A com-parative planetology approach, Surveys in Geophys. 20, 61–109, 1999.
Kivelson, M.G., Southwood, D.J.: Resonant ULF waves: A new interpretation, Geophys. Res. Lett., 12, 49–52, 1985.
Kivelson, M. G. and Southwood, D. J.: Coupling of global magne-tospheric MHD eigenmodes to field line resonances, J. Geophys. Res., 91, 4345–4351, 1986.
Lanzerotti, L. J., Fukunishi, H., Hasegawa, A., and Chen, L.: Ex-citation of the plasmapause at ultralow frequencies, Phys. Rev. Lett., 31, 624–628, 1973.
Lanzerotti, L. J., Lee, L. C., MacLennan, C. G., Wolfe, A., and Medford, L. V.: Possible evidence of flux transfer events in the polar ionosphere, Geophys. Res. Lett., 13, 1089–1092, 1986.
Lee, D.-H. and Lysak, R. L.: Monochromatic ULF wave excitation in the dipole magnetosphere, J. Geophys. Res., 96, 5811–5817, 1991.
Mitchell, D. G., Engebretson, M. J., Williams, D. J., Cattell, C. A., and Lundin, R.: Pc5 Pulsations in the outer dawn magnetosphere seen by ISEE 1 and 2, J. Geophys. Res., 95, 967–975, 1990. Moretto, T. and Yahnin, A.: Mapping travelling convection vortex
events with respect to energetic particle boundaries, Ann. Geo-phys., 16, 891–899, 1998,
SRef-ID: 1432-0576/ag/1998-16-891.
Nos´e , M., Iyemori, T., Sugiura, M., and Slavin, J. A.: A strong dawn/dusk asymmetry in Pc 5 pulsation occurrence observed by the DE-1 satellite, Geophys. Res. Lett., 22, 2053–2056, 1995. Olson, J. V. and Rostoker, G.: Longitudinal phase variations of Pc
4-5 micropulsations, J. Geophys. Res., 83, 2481–488, 1978. Potemra, T. A. and Blomberg, L. G.: A survey of Pc 5 pulsations
in the dayside high-latitude regions observed by Viking, J. Geo-phys. Res., 101, 24 801–24 813, 1996.
Samson, J. C., Harrold, B. G., Ruohoniem, J. M., Greenwald, R. A., and Walker, A. D. M.: Field line resonances associated with MHD waveguides in the magnetosphere, Geophys. Res. Lett., 19, 441–444, 1992.
Samson, J. C., Greenwald, R. A., Ruohoniemi, J. M., Hughes, T. J., and Wallis, D. D.: Magnetometer and radar observations of mag-netohydrodynamic cavity modes in the earth’s magnetosphere, Can. J. Phys., 69, 929–937, 1991.
Sarafopoulos, D. V. and Sarris, E. T.: Long-period standing waves at the plasma sheet boundary layer region observed by ISEE-1, Ann. Geophys., 9, 333–347, 1991.
Sarafopoulos, D. V., and Sarris, E.T.: Quiet-time Pc5 pulsations in the Earth’s magnetotail: IMP-8, ISEE-1 and ISEE-3 simultane-ous observations, Ann. Geophys., 12, 121-138, 1994,
SRef-ID: 1432-0576/ag/1994-12-121.
Sarafopoulos, D. V.: Long duration Pc 5 compressional pulsations inside the Earth’s magnetotail lobes, Ann. Geophys., 13, 926– 937, 1995,
SRef-ID: 1432-0576/ag/1995-13-926.
Sarafopoulos, D. V.: Distinct solar wind pressure pulses produc-ing convection twin-vortex systems in the ionosphere, Ann. Geo-phys., 22, 2201–2211, 2004a,
SRef-ID: 1432-0576/ag/2004-22-2201.
Sarafopoulos, D. V.: Repetitive X-line Hall current structures over the dawnside ionosphere induced by successive exo-magnetosphere pressure pulses, Ann. Geophys., 22, 4153–4163, 2004b,
SRef-ID: 1432-0576/ag/2004-22-4153.
Singer, H. J., Hughes, W. J., and Russell, C. T.: Standing hydro-magnetic waves observed by ISEE 1 and 2: Radial extent and harmonic, J. Geophys. Res., 87, 3519–3529, 1982.
Southwood, D. J.: Some features of field line resonances in the magnetosphere, Planet. Space Sci., 22, 483–491, 1974.
Takahashi, K.: ULF waves: 1997 IAGA division 3 reporter review, Ann. Geophys., 16, 787–803, 1998,
SRef-ID: 1432-0576/ag/1998-16-787.
Tamao, T.: Transmission and coupling resonance of hydromag-netic disturbances in the non-uniform Earth’s magnetosphere, Sci. Rept. Tohoku Univ., Series 5, Geophysics, Vol. 17, No. 2, 43–72, 1965.
Tsyganenko, N. A.: Effects of the solar wind conditions on the global magnetospheric configuration as deduced from data-based field models, European Space Agency Spec. Publ., ESA SP-389, 181, 1996.
Walker, A. D. M., Greenwald, R. A., Green, C. A., and Stuart, W.: STARE radar auroral observation of Pc5 geomagnetic pulsations, J. Geophys. Res., 84, 3373–3388, 1979.