COMPARATIVE KINETICS STUDY OF THE THERMAL AND
THERMO-OXIDATIVE DEGRADATION OF A POLYSTYRENE-CLAY
NANOCOMPOSITE BY TGA AND DSC
Ion Dranca*, Nicon Ungur, Tudor Lupascu, Oleg Petuhov
Institute of Chemistry, ASM, Center of Physical Chemistry and Nanocomposites 3 Academiei Str., Chisinau MD2028, Moldova
Tel. +37322 739 781 Fax. 37322 725 490 [email protected]
Abstract: The methods of thermogravimetry (TGA) and differential scanning calorimetry (DSC) have been used to study the thermal and thermo-oxidative degradation of polystyrene (PS) and a PS-clay nanocompoiste. An advanced isoconversional method has been applied for kinetic analysis. Introduction of the clay phase increases the activation energy and affects the total heat of degradation, which suggests a change in the reaction mechanism. The obtained kinetic data permit a comparative assessment of fi re resistance of the studied materials.
Keywords: degradation; fi re resistance; nanocomposites; thermogravimetric analysis (TGA); differential scanning calorimetry (DSC);
Introduction
Alexandre and Dubois found that implanting layered silicates into polymers is known[1] to modify dramatically various physical properties including thermal stability and fi re resistance.[2] A great deal of attention has been focused on the thermal behavior of polystyrene (PS) clay nanocomposites[3-9] as studied by using cone calorimetry as well as standard thermal analysis methods such as thermogravimetric analysis (TGA), differential scanning calorimetry (DSC), and dynamic mechanical analysis (DMA). It has been found that compared to virgin PS the clay nanocomposites have somewhat higher glass transition temperature, [4,6],decompose at signifi cantly greater temperatures, [4-9] and demonstrate a substantial decrease in the maximum heat release rate on combustion. [5-9] It should be stressed that even when clay content is as little as 0.1% the initial decomposition temperature is increased by 40°C and the peak heat release rate is decreased by about 40% relative to virgin PS. [7] The mechanism of such remarkable effect is not yet well understood. The effect is most commonly rationalized in terms of the barrier model that suggests the enhanced
fi re resistant properties to arise due to a carbonaceous-silicate char that builds up on the surface of the polymer melt and provides the mass and heat transfer barrier. [5-11]. It has also been suggested that the effect may be associated with radical trapping [8] by the structural iron in clays.
Although the thermal behavior of polymer clay nanocomposites has been studied extensively, the kinetic aspects of the thermal and thermo-oxidative degradation remain practically unknown. The importance of reliable kinetic analysis cannot be overestimated as it may provide information on the energy barriers of the process as well as offer mechanistic clues. Finding a reliable approach to kinetic analysis presents a certain challenge as the thermal analysis literature describes a great number of kinetic methods that make use of either single or multiple heating rate data. The shortcomings of the single heating rate methods have been repeatedly stressed. [12-13] The recent publication [14] summarizing the results of the ICTAC Kinetics Project has recommended the use of multiple heating rate methods such as isoconversional methods.[12]
In this paper, we employ Vyazovkin, advanced isoconversional method, [15,16] in order to obtain reliable kinetic information on the thermal and thermo-oxidative degradation of a PS-clay nanocomposite. We demonstrate that the obtained kinetic information provides important mechanistic conclusions about the effect of the clay phase on degradation of the polymer composites.
Experimental part
The PS clay nanocomposite was prepared by intercalating a monocationic free radical initiator into montmorillonite clay and the subsequent solution surface-initiated
exclusion chromatography (SEC) using PS standards. Details of the initiator synthesis and similar procedures of the SIP process and product analysis can be found in another publication, [18] in which the results have shown that this free radical SIP strategy can achieve exfoliated PS-clay nanocomposites with even higher clay loading by using the same monocationic initiator. The obtained material will be referred to as nPS90. For comparison purposes, we have used virgin PS that was purchased from Alfa Aesar and used as received. Its Mw value is 100,000 and it will be referred to as PS100.
The degradation kinetics have been measured as the temperature dependent mass loss by using a Mettler-Toledo TGA/SDTA851e module. Polymer samples of ~5mg have been placed in 40μL Al pans and heated from 30 to 600oC at
the heating rates 2.5, 5.0, 7.5, 10.0, and 12.5 oC min-1. Thermal and thermo-oxidative degradations have been respectively
performed in the fl owing atmosphere of N2 and air at a fl ow rate of 70 mL min-1. The buoyancy effect in TGA has been
accounted for by performing empty pan runs and subtracting the resulting data from the subsequent sample mass loss data. DSC measurements have been conducted by using a Mettler-Toledo DSC 822e module. The conditions of DSC
runs have been similar to those of TGA except that DSC runs have been carried at a single heating rate 10 oC min-1. Both
instruments have been calibrated by using an Indium standard. The amount of residue has been ~1%. Kinetic method
The overall rate of polymer degradation is commonly described by the following equation[12]
) ( exp d d
D
f RT E A t Į ¸ ¹ · ¨ © § (1)where α is the extent of polymer conversion, t is the time, T is the temperature, R is the gas constant, A is the pre-exponential factor, E is the activation energy, and f(α) is the reaction model. The latter is frequently taken in the form of the reaction order model (1-α)n. The de
fi ciencies of such model-based approach are well known. [12] In addition to the diffi culty of determining a unique reaction model, degradation of polymers tends to demonstrate complex kinetics [19] that cannot be described by single eq. 1 throughout the whole temperature region. [20, 21]
In order to adequately represent the temperature dependence of degradation, one may use a model that involves several steps such as recombination, random scission, and end chain scission each of which is represented by the respective eq. 1. [22] However, simultaneously solving of three kinetic equations presents a considerable computational problem. A simpler alternative is to use a model-free isoconversional method. The method is based on the isoconversional principle that states that at a constant extent of conversion the reaction rate is only a function of the temperature:
R E T t D D
D
»¼ º «¬ ª 1 d ) d / d ln( d (2)Henceforth the subscript α indicates the values related to a given conversion). While based on eq. 1, the method assumes that Eα is constant only at a given extent of conversion and the narrow temperature region related to this conversion at different heating rates. In other words, the isoconversional methods describe the degradation kinetics by using multiple eq. 1 each of which is associated with a certain extent of conversion and has its own value of Eα. By using the integral form of Equation (2) Vyazovkin [15,16] has developed an advanced isoconversional method. The method offers two major advantages over the frequently used methods of Flyn and Wall[27] and Ozawa.[28] The fi rst advantage is that the method has been designed to treat the kinetics that occur under an arbitrary variation in temperature, T(t), which allows one to account for self-heating/cooling detectable by the thermal sensor of the instrument. For a series of n experiments carried out under different temperature programs, T(t), the activation energy is determined at any particular value of α by fi nding Eα, which minimizes the function [Equation (3)].
)]
(
[
)
(
[
)
(
, ,1 D D
D D D
I
t
T
E
t
T
E
J
E
j i n i j n i¦
¦
r (3) where [Equation (4)]:dt
t
RT
E
t
Ti
E
J
t t i]
)
(
exp[
)]
(
,
[
³
'{
D D D DD
The second advantage is associated with performing the integration over small time segments (Equation (4)), which allows the elimination of a systematic error [16] occurring in the Flynn and Wall and Ozawa methods when Eα varies signifi cantly with α.
Results and discussion
Figure 1 provides a comparison of the mass loss curves for degradation of virgin polymer and nanocomposite under nitrogen and air. PS100 degrades without forming any residue. Degradation of nPS90 leaves some residue in amount of ~1% that remains practically constant up to 1000°C. Assuming PS has been completely volatilized; this number represents the amount of the clay phase in the nanocomposite. As seen in Figure 1, in both nitrogen and air the mass loss curves for nPS90 are found at markedly greater temperatures than the curves for PS100. The decomposition temperature increases by as much as 30-40°C that is consistent with the results of other workers.[7-9] Given the small amount of the clay phase, this obviously represents a dramatic increase in thermal stability.
200
300
400
500
600
0.0
0.2
0.4
0.6
0.8
1.0
N
2Air
PS100
nPS90
PS100
nPS90
T /
oC
Mass fraction
Figure 1. TGA curves for degradation of PS100 and nPS90 at heating rate 5°C min-1 in air and nitrogen.
Figure 2 displays the results of the isoconversional kinetic analysis for the thermal degradation of PS100 and nPS90 in the atmosphere of nitrogen. For PS100 the effective activation energy increases from ~100 to ~200 kJ mol-1
throughout degradation. The variation suggests a change in a limiting step of the process. It has been suggested [25, 26] that PS degradation is initiated at weak link sites inherent to the polymer itself. Similar increases from smaller values of Eα have been observed for degradation of other polymers (PE, PP, and PMMA). [20, 21]The values of Eα for nPS90 also show an increase with the extent of degradation that suggests a change in the rate limiting step. That latter occurs at the early stages of degradation (α < 0.25) after which the effective activation energy practically levels off at 220 – 230 kJ mol-1. The whole process of
0.0 0.2 0.4 0.6 0.8 1.0 50
100 150 200 250
PS100 nPS90
α
Eα
/ kJ mol
-1
nPS90 degradation demonstrates markedly larger effective activation energy as compared to that of PS100 degradation. According to our DSC data the degradation of PS100 and nPS90 demonstrates single endothermic peaks whose respective heats are –990 and –670 J g-1.
0.0 0.2 0.4 0.6 0.8 1.0
50 100 150 200 250
PS100
nPS90
α
Eα
/ kJ mol
-1
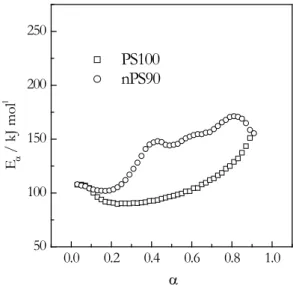
Figure 3. Dependence of the effective activation energy on the extent of conversion for the thermo-oxidative degradation of PS100 and nPS90 in air.
Figure 3 presents variations in Eα for thermo-oxidative degradation of PS100 and nPS90. For PS100 the initial stages of degradation occur with lower activation energy of ~90 – 100 kJ mol-1 that later (α > 0.6) rises to ~150 kJ mol-1.
This behavior is consistent with the mechanism of thermo-oxidative degradation of PS that assumes [19,27] the initial formation of hydroperoxide radicals whose decomposition determines the degradation at early stages. At later stages and higher temperatures these radicals are no longer stable so that the degradation rate becomes controlled by unzipping. This mechanism is consistent with our DSC data that show that initial stages of thermo-oxidative degradation are exothermic, whereas the later ones are endothermic. Putting the above results together we may conclude that the introduction of the clay phase into PS causes a considerable increase in the effective energy of degradation. The enhanced thermal stability of the PS clay nanocomposites is likely to be associated with this increase.
It does not seem that this result can be easily rationalized in terms of the barrier model that suggests that the degradation rate of a polymer clay nanocomposite should be limited by diffusion of gaseous decomposition products through the surface barrier of the silicate char. However, diffusion of gases in liquids and solids, including polymers tends to have a low activation energy of about 40 – 50 kJ mol-1.[28] Also the presence of the surface barrier cannot affect
the total value of the heat of degradation. Nevertheless, the degradation of the nanocomposite in nitrogen demonstrates a more than 30% smaller endothermic effect than that for virgin PS. In air, the degradation of nPS90 shows an exothermic effect followed by an endotherm as is observed for PS100. However, the exothermic effect appears somewhat smaller and endothermic effect is almost twice larger than the respective effects observed for PS100. These facts suggest that introduction of the clay phase in PS is likely to change the concentration distribution of degradation products and/or maybe cause the formation of some new products of degradation. This suggestion appears to correlate with the results of cone calorimetry experiments [5-9] which indicate that the clay enhanced PS composites tend to burn with releasing a signifi cantly smaller amount of the total heat. This may be because for the clay enhanced PS the concentration distribution of the polymer degradation products changes toward the formation of less combustible products.
Although the barrier model makes sense from both experimental [9, 10] and theoretical standpoint,[11] the barrier formation does not seem to be the only reason that contributes to the enhanced thermal and fi re stability of polymer clay nanocomposites. Indeed, there is still a lot to learn about the mechanism of enhancing these important properties. In particular, experimental comparison of the concentration distribution of degradation products in virgin polymer and in polymer clay composite should be of fundamental importance.
Conclusions
Acknowledgement: Partial support for this work from the State Program of Moldova under grant 169. PA/09.836.05.04A is gratefully acknowledged.
REFERENCES
M. Alexandre, P. Dubois,
[1]. Mater. Sci. Eng., R, 2000, 28, 1.
D. Porter, E. Metcalfe, M. J. K. Thomas,
[2]. Fire Mater. 2000, 24, 45
R. A. Vaia, H. Ishii, E. P. Giannelis,
[3]. Chem. Mater. 1993, 5, 1694
M. W. Noh, D. C. Lee,
[4]. Polym. Bull. 1999, 42, 619.
J. W. Gilman, C. L. Jackson, A. B. Morgan, R. Harris, E. Manias, E. P. Giannelis, M. [5].
M. Okamoto, S. Morita, H. Taguchi, Y. H. Kim, T. Kotaka, H. Tateyama,
[6]. Polymer 2000
J. Zhu, C. A. Wilkie,
[7]. Polym. Int. 2000, 49, 1158.
J. Zhu, F. M. Uhl, A. B. Morgan, C. A. Wilkie,
[8]. Chem. Mater. 2001, 13, 4649
A. B. Morgan, R. H. Harris, T. Kashiwagi, L. J. Chyall, J. W. Gilman,
[9]. Fire Mater. 2002, 26, 247.
J. Wang, J. Du, J. Zhu, C. A. Wilkie,
[10]. Polym. Degrad. Stab. 2002, 77, 249.
M. Lewin,
[11]. Fire Mater. 2003, 27, 1. J.H. Flynn, In
[12]. Encyclopedia of Polymer Science and Engineering; H.F. Mark, N.M. Bikales, C.V.Overberger, J.I. Kroschwitz, Eds.; J. Wiley & Sons, New York, 1989, Suppl. Vol., p. 690.
S. Vyazovkin, N. Sbirrazzuoli,
[13]. Macromol. Chem. Phys. 1999, 200, 2294.
M.E. Brown, M. Maciejewski, S. Vyazovkin, R. Nomen, J. Sempere, A. Burnham, J. Opfermann, R. Strey, [14].
H.L. Anderson, A. Kemmler, R. Keuleers, J. Janssens, H.O. Desseyn, C-R. Li, T.B.Tang, B. Roduit, J. Malek, T. Mitsuhashi, Thermochim. Acta 2000, 355, 125.
Vyazovkin, S.
[15]. J. Comput. Chem. 1997, 18, 393. Vyazovkin, S.
[16]. J. Comput. Chem. 2001, 22, 178. Fan, C. Xia, R. C. Advincula,
[17]. Collids and Surfaces: A 2003, 219, 75
X. Fan, C. Xia, R. C. Advincula,
[18]. Langmuir 2003, 19, 4381
J. H. Flynn “Polymer Degradation” in “
[19]. Handbook of Thermal Analysis and Calorimetry”, Vol.3, S. Z. D.
Cheng, ed., Elsevier, 2002, p. 587. J. D. Peterson, S. Vyazovkin, C. A. Wight,
[20]. J. Phys. Chem. B, 1999, 103, 8087.
J.D. Peterson, S. Vyazovkin, C. A.Wight,
[21]. Macromol. Chem. Phys. 2001, 202, 775.
Y. Kodera, B. J. McCoy,
[22]. Energy & Fuels 2002, 16, 119.
H. Flynn, L. A. Wall,
[23]. J. Res. Nat. Bur. Standards: A 1966, 70, 487. T. Ozawa,
[24]. Bull. Chem. Soc. Japan 1965, 38, 1881. S. L. Madorsky, “
[25]. Thermal Degradation of Organic Polymers”, Interscience Publishers, New York 1964. N. Grassie, G. Scott, “
[26]. Polymer Degradation and Stabilisation”, Cambridge University Press, Cambridge 1985. M. Celina, D. K. Ottesen, K. T. Gillen, R. L. Clough,
[27]. Polym. Degrad. Stabil. 1997, 58, 15.
W. Jost, “