Chemical Industry & Chemical Engineering Quarterly www.ache.org.rs/CICEQ
Chem. Ind. Chem. Eng. Q. 21 (1) 23−33 (2015) CI&CEQ
ODIVAN ZANELLA1,2 ISABEL CRISTINA TESSARO1,3
LILIANA AMARAL FÉRIS1,2
1Federal University of Rio Grande do Sul, Department of Chemical Engineering, Porto Alegre, Brazil 2Federal University of Rio Grande do Sul, Department of Chemical Engineering, Laboratory of separation and unit operations, Porto Alegre, Brazil 3 Federal University of Rio Grande do Sul, Department of Chemical Engineering, Laboratory of membrane separation process, Porto Alegre, Brazil
SCIENTIFIC PAPER
UDC 546.175:544.4:661.183.2:66.081 DOI 10.2298/CICEQ130830001Z
NITRATE SORPTION ON ACTIVATED
CARBON MODIFIED WITH CaCl
2:
EQUILIBRIUM, ISOTHERMS AND KINETICS
Article Highlights
• Activated carbon modified with CaCl2 is an effective sorbent to remove nitrate from
aqueous solutions
• Maximum removal was between pH 3 and 9
• The Langmuir, Redlich-Peterson and Sips model isotherms represent the experi-mental data well with R2 > 0.99
• The sorption kinetics obeyed a second order kinetic model
Abstract
In this study, nitrate removal from aqueous solutions was investigated using granular activated carbon (GAC) modified with CaCl2. Batch sorption studies
were performed as a function of sorbent dose, initial nitrate concentration and pH. Sorption was maximized between pH 3 and 9. Studies on the effect of pH showed that the ion exchange mechanism might be involved in the sorption process. The percentage of nitrate removed increased with increasing sorbent concentration, and the ideal sorbent dose was found to be 20 g·L-1. Four isot-herm models – Langmuir, Freundlich, Redlich-Peterson and Sips – were used to fit the experimental data. The Redlich-Peterson isotherm model explained the sorption process well and showed the best coefficient of determination (0.9979) and Chi-square test statistic (0.0079). Using the Sips isotherm model, the sorption capacity (qe) was found to be 1.93 mg nitrate per g of sorbent.
Kinetic experiments indicated that sorption was a fast process, reaching equi-librium within 120 min. The nitrate sorption kinetic data were successfully fitted to a pseudo-second-order kinetic model. The overall results demonstrated potential applications of modified GAC for nitrate removal from aqueous sol-utions.
Keywords: nitrate, isotherms, kinetic, activated carbon, modified sur-face.
High nitrate levels in drinking water supplies represent a significant risk to human health, as this substance is directly responsible for methemoglo-binemia in infants (blue baby syndrome) [1]. Nitrate is consequently absorbed by hemoglobin to form methe-moglobin. Nitrite, formed by bacteria starting nitrate, can also induce gastric cancer by reacting in the sto-mach with agents of human gastric cancer [2].
Correspondence: O. Zanella, Federal University of Rio Grande do Sul, Department of Chemical Engineering, Engineer Luis Englert Street, Central Campus, Postcode: 90040-040, Porto Alegre, Brazil.
E-mail: [email protected] Paper received: 30 August, 2013 Paper revised: 19 November, 2013 Paper accepted: 17 January, 2014
Researchers have described several sources of nitrate as being the causes of water resources conta-mination (surface and groundwater). Most research reports that water contamination by nitrate is primarily associated with agriculture practices [3]. Further sources of nitrate include nitrogen dissolved in pre-cipitation, return flows of irrigation water and dry deposition (gases and suspended particles dispersed) [4]. However, other sources of nitrate contamination also deserve attention, including domestic and indus-trial wastewater, septic systems, landfills and animal waste [5].
electrochemical techniques. According to Chiueh et al. [6], methods for the removal or reduction of nitrate in aqueous solutions may be grouped into two main categories: i) transport, such as reverse osmosis, ion exchange, electrodialysis and sorption and ii) des-truction, such as biological, chemical and catalytic denitrification.
Sorption processes are generally considered to the best in water treatment due to their simplicity and ease of operation. Moreover, these processes can eli-minate or reduce the different types of organic and inorganic pollutants in water or sewage and therefore have wide applications in pollution control [7].
Several sorption technologies have proven to be successful in removing different types of inorganic anions. Viswanathan and Meenakshi [8] reported suc-cessful removal of fluoride; Namasivayam and San-geetha [9] and Guan et al. [10] showed successful removal of nitrate; Bhatnagar et al. [11] reportedly removed bromate; and Mahmudor and Huang [12] were successful in removing perchlorate. All of these studies were performed with aqueous solutions using various materials as sorbents. It should be noted that the efficiency of removal strongly depends on the choice of sorbent material suitable for a specific anion [13].
In this study, activated carbon was modified with CaCl2 and used to remove nitrate from aqueous
sol-utions by sorption. Accordingly, the effects of various parameters on the adsorption process were inves-tigated such as the point of zero charge (pHPZC), pH,
sorbent concentration (cS) and time. This paper is
focused on the investigation of the activated carbon surface modified by CaCl2. Quick functionalization
and easy execution applied to the removal of nitrate in aqueous solutions can be considered an advance in this treatment.
MATERIALS AND METHODS
Specification of reagents and sorbent
Commercial granular activated carbon (GAC) was used as a solid sorbent, with a particle size between 1 and 2 mm (Synth®, Diadema, São Paulo, Brazil). Sodium nitrate (99%, ACS-PA, Dinâmica®,
Diadema, São Paulo, Brazil) was used as the sor-bate. Calcium chloride (Sigma-Aldrich®, São Paulo, São Paulo, Brazil) was used to chemically modify the activated carbon surface. Analytical-grade reagents and deionized water were used throughout this study unless stated otherwise.
Chemical modification of activated carbon
A 1000 mL solution of 2000 mg·L-1 CaCl2 was
prepared in a 1000 mL beaker. Ten grams of GAC was added, and the solution was stirred for 1 h. Following filtration of the solution, the coal retained by the filter was dried for 24 h at room temperature (∼25
°C).
To evaluate the surface modification of GAC, SEM analyses were performed using an electron microscope (TM 3000 – HITACHI) coupled with EDX. Specifically, the outer microstructure and the ele-mental composition of the activated carbon before and after chemical treatment surface were evaluated.
Point of zero charge (pHPZC) experiment
The point of zero charge (PZC), defined as the pH at which the surface of the sorbent has a neutral charge, was determined by the "experiment of the 11 points" methodology proposed by Herczynska [14]. Mixtures of 50 mg of sorbent and 50 mL of aqueous solution were prepared at 11 different initial pH values (2–12). The pH was adjusted with 0.1 mol·L-1 HCl or NaOH and was measured again after 24 h. The rel-ationship between the initial pH values and the change in pH with time determined the point at which the material became absorbent, pHPZC.
Batch sorption experiments
Sorption tests were performed with granular activated carbon modified with CaCl2 by adding in 200
mL of 10 or 20 mg·L-1 nitrate solution. The tests were performed at room temperature (25±3 °C) for 30 min under constant stirring in a shaker (Wagner, Marconi, Brazil). Subsequently, the solution was filtered with filter paper and the concentration of residual nitrate determined by UV spectroscopy (λ = 200 nm) as described in the Standard Methods [15]. The amount of nitrate adsorbed to the GAC-modified material was calculated by the following equation:
(
i e)
es
c c
q V
M
−
= (1)
where qe represents the amount of adsorbate
ads-orbed per unit mass of adsorbent at equilibrium (mg·g-1), ci is the initial sorbate concentration (mg·L-1),
ce is the equilibrium concentration (mg·L-1), V is the
volume of the solution (L) and Ms is the mass of
sorbent (g).
perform analysis of variance (ANOVA) tests for lack of fit and to determine the regression coefficients. Tukey’s test was used to compare all pairs. The test is based on the least significant difference, and it is used as to test for any difference between the two averages of treatment.
Equilibrium isotherms
Modeling of sorption isotherm data is important to predict and compare adsorption performance, as the sorption isotherm represents the equilibrium rel-ationship between the solute in solution and the sor-bate retained in the sorbent at a given temperature [16]. The model parameters often provide information about the mechanisms of sorption, surface properties of the sorbent and affinity between the sorbate and sorbent. Langmuir, Freundlich, Redlich-Peterson and Sips isotherm models are commonly used to describe the solid-liquid sorption system.
The Langmuir isotherm
The Langmuir isotherm has been used exten-sively by many authors to describe the adsorption of heavy metals, dyes and organic pollutants onto mat-erials such as activated carbon, clay and food ind-ustry waste [16-18]. This model is valid for monolayer adsorption on specific homogenous sites containing a finite number of identical sites and assumes uniform adsorption energies on the surface without trans-migration of the sorbate in the plane of the surface. The Langmuir isotherm model estimates the maxi-mum adsorption capacity produced from complete monolayer coverage on the adsorbent surface [19]. The non-linear Langmuir isotherm model can be expressed by the following equation:
m L e e
L e
1
q K c q
K c
=
+ (2)
where qm represents the maximum capacity of
sorp-tion (mg·g-1), and KL is the constant of surface energy
(L·mg-1).
The Freundlich isotherm
Suzuki [20] describes the Freundlich equation as an empirical relationship, because the sorption capacity is unlimited when the solution concentration increases. For strongly favorable isotherms, the Freundlich equation generally fits the empirical data well, particularly for solid-liquid sorption [21]. Equation (3) represents the Freundlich model [22]:
1 e f e n
q =K c (3)
where and Kf is the Freundlich parameter related to
adsorption capacity (mg·g-1)(L·mg-1)1/n.
The Redlich-Peterson isotherm
The Redlich–Peterson isotherm [23] contains three parameters, A, B and β (0 < β < 1), and involves the features of both the Langmuir and the Freundlich isotherms. It can be described as follows:
e e
e
1
Ac q
Bc β
=
+ (4)
A and B are constants, and β is the degree of heterogeneity. When coverage is very low, Eq. (4) becomes linear and leads to the Henry’s Law. For high coverage, Eq. (4) can be assimilated to the Eq. (3), as the ratio A/B and (1–β) corresponds to the parameters Kf and 1/n of the Freundlich isotherm (Eq.
(3)). For β = 1, Eq (4) can be likened to the Langmuir equation (2); A/B is numerically equal to the mono-layer capacity (qm), and B is the sorption equilibrium
constant.
The Sips isotherm
The Sips isotherm model considers the adsorp-tion capacity to be limited by high sorbate concen-trations [24]. This model is similar to the Langmuir model but includes a parameter that represents the heterogeneous system. The Sips isotherm can be described by the following equation:
m e e
e
1
q bc q
bc
γ γ
=
+ (5)
where b is the sorption constant, and γ is the dis-sociation parameter. The Sips model reduces to the Langmuir model when γ = 1.
Error analysis
Linear coefficients of determination and a non-linear Chi-square test were used in this study. The chi-square test statistic is the sum of the squares of the differences between the experimental and cal-culated values, with each squared difference divided by the corresponding data obtained by model calculations. The mathematical equivalent of this statement is Equation 3.5 [25]:
(
)
2e cal 2
cal
q q
q
χ =
− (6)where qcal is the equilibrium capacity obtained from
model calculations (mg·g-1), and qe is obtained from
the experimental data for the equilibrium capacity (mg·g-1). If data from the model are similar to the experimental data, χ2
they are different, χ2
will be a large number. There-fore, it is necessary to also analyze the data set using the Chi-square test to identify the isotherm that best fits the sorption system.
Kinectic studies
Kinetic studies were performed in 1.0 L conical flasks using initial nitrate concentrations of 20 and 10 mg·L-1 at pH 6. The solutions were shaken at room temperature (25 °C) for 2 h. Samples of 1.0 mL were collected from the triplicate flasks at required time intervals (5–120 min). The clear solutions were anal-yzed for residual nitrate concentration in the solution.
RESULTS AND DISCUSSION
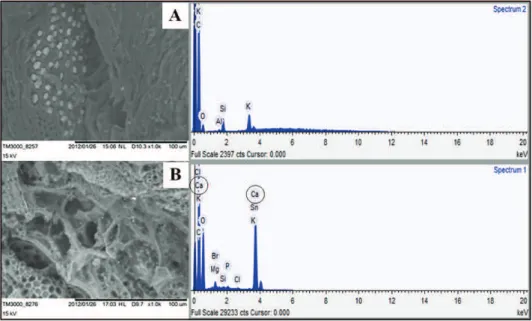
Structural and elemental analyses
Figure 1 shows the results of SEM and EDX analyses on the GAC before and after modification. Irregular, heterogeneous and disordered surfaces can be observed in both cases. The chemical modification caused by the CaCl2 showed no apparent changes in
surface morphology in the photomicrographs of the GAC and GAC+CaCl2 materials. This can be
con-firmed by the surface area, which was determined by BET and presented values of 726.4 and 724.1 m2·g-1
for GAC and GAC+CaCl2, respectively. It was
obs-erved that the total pore volume didn’t show sig-nificant difference. Pore volume of 0.33 was found for GAC and 0.32 cm3·g-1 for GAC+CaCl
2. However, the
spectrograms obtained for the GAC and GAC + CaCl2
samples showed that calcium appears in the ele-mental composition after GAC modification, indicating that the treatment seems to be effective.
Determination of the zero charge point (pHPZC)
The values of pHPZC for modified GAC and GAC
were 7.20 and 7.80, respectively. The sorbent is con-sidered to act as a buffer solution at this value.
These results were expected, as the sorbents have different surface characteristics; the sorbent that received chemical treatment with CaCl2 has more
positive active sites, which tend to retain more OH–. Consequently, the concentration of H+ in the solution increases, making it more acidic. Thus, this PZC value is lower than that of activated carbon without chemical treatment.
The pH of the system affects the sorption func-tional groups by dissociating the active sites on the sorbent surface. This change in pH influences the kinetics of the sorption processes.
The sorption of cations increases when the act-ual pH is greater than the pHPZC, while the sorption of
anions is favored at pH lower than pHPZC values [26].
However, the specific sorption of cations minimizes pHPZC. Thus, the particular sorption of anions
maxi-mizes pHPZC.
Study of the sorbent concentration (cS)
With solid sorbent concentration of approxi-mately 20 g·L-1, 78% of the nitrate was removed after equilibrium was reached. Similarly, at a solid sorbent concentration of approximately 40 g·L-1, 88% of the
nitrate was removed after equilibrium was reached. These results can be explained by evaluating the total sorption and active surface sites of the sor-bent. In accordance with Pavan et al. [27] and Vag-hetti et al. [28], increasing the amount of solid sorbent in the system causes an increase in sorption area,
and thus more active sites are available. This mech-anism reduces the nitrate concentration in the sol-ution. Accordingly, increasing the dosage of the sor-bent would completely remove the solute from the solution. However, this outcome does not occur in batch systems because the sorbent and the sorbate retained solute in the solution establish an equilibrium [29].
When the solute concentration in the solution was below 5.0 mg·L-1, continually increasing the sor-bent dosage did not significantly affect removal.
Influence of pH in the nitrate sorption in the modified GAC
The influence of pH on the nitrate sorption pro-cess using the modified GAC was evaluated for dif-ferent sorbent concentrations: 2, 4 and 6 g of sorbent per 200 mL of nitrate solution; the initial concentra-tions of nitrate were 10 and 20 mg·L-1.
The results indicate that a small change occurred in the sorption behavior at pH 6 for 2 g of sorbent in a 10 mg·L-1 nitrate solution; when the sor-bent concentration was increased while all other con-ditions were kept constant, the process appeared to be independent of pH. However, higher sorption was observed for 2 g of sorbent in a 20 mg·L-1 nitrate solution. At pH 4, the results obtained from this study are similar to the results reported by Ozturk and Bektas [30]. The process also seems to be pH inde-pendent for higher concentrations of sorbent and a 20 mg·L-1 initial concentration of nitrate.
The data indicate that pH has little influence on the sorption capacity. However, small variations in this capacity were identified for lower sorbent concen-trations. According Corapcioglu and Huang [31], the pH of the solution directly influences the surface charge of the sorbent and the ionization degree of several solutes. In other words, the pH interferes with the charge of the molecules that are present in solution. Changes in pH affect the sorption process by decoupling the functional groups present on the surface of the sorbent, specifically the active sites. The interaction between various cationic and anionic species with the sorbent could be explained by com-petitive sorption of H+ and OH– with sorbates.
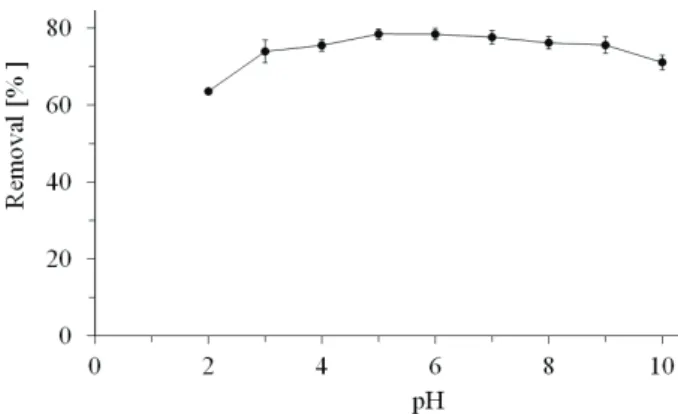
Figure 2 shows the results of a detailed pH test (pH range 2–10) that was performed to verify the influence of pH on the nitrate sorption process. The results show that the pH does not significantly affect the removal of nitrate. Tukey’s test was performed with a significance level of 95% to assess whether the mean values of removal at each pH were different. This test showed significant differences between the
mean values at pH 2 and 10 (p < 0.05). For pH 2, all mean values were significantly different, whereas at pH 10 the average values were significant when compared with the mean values at pH 5, 6 and 7. Thus, the mean values did not vary significantly from pH 3 to 9. This result is similar to the result presented by Namasivayam and Sangeetha [9], who reported an adsorption maximum between pH 3 and 10 when stu-dying nitrate removal from aqueous solutions using activated carbon modified with ZnCl2.
Figure 2. Effect of pH on the sorption for 4 g sorbent in 200 mL of 20 mg·L-1 nitrate solution.
Based on these results, it seems that the sur-face treatment with CaCl2 assigns positive character
to the GAC sites, confirming the existence of two sorption mechanisms involving electrostatic inter-actions and anion exchange.
The sorption capacity is close to 0.8 mg g-1 between pH 3 and 9. Sorption was lower at pH 2 and 10 (0.60 and 0.70 mg·g-1, respectively). The low sorp-tion observed at pH 2 can most likely be attributed to competition between NO3– and Cl– in the active sites,
which results from HCl added to adjust the pH. At pH 10, the surface of the sorbent is charged with nega-tive sites, which does not favor anion sorption due to electrostatic repulsion.
At pH values lower than pHPZC (7.20), the
move-ments on the surface of the sorbent result in positively charged sites. Thus, the sorption of anions seems to be primarily facilitated by electrostatic attraction.
According to Chintala et al. [32], at pH values more than pHPZC (7.20), the movements on the
sur-face of the sorbent result in negatively charged sites. Thus, the sorption of anions seems to be primarily facilitated by anion exchange.
According to Namasivayam and Sangeetha [26], the degree of protonation at the surface of the sorbent does not drop immediately to zero at pH values higher than pHPZC (7.20). However, the sorption of
mechanisms could account for the removal of anions in solutions with pH values approaching 10 and in solutions at pHPZC.
Nitrate can still be removed at pH values of 2 and 10, but this behavior is unusual since electro-static repulsion inhibits sorption when the surface of the sorbent is strongly negative. Ion exchange mech-anisms are inhibited in the same way.
Equilibrium of sorption
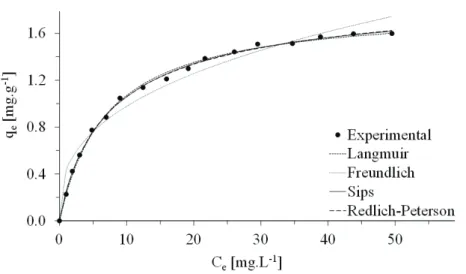
Figure 3 shows the experimental and predicted results obtained for the nitrate sorption process using modified GAC. The following mathematical models have been used to quantitatively analyze the sorption process: Langmuir (Eq. (2)), Freundlich (Eq. (3)), Redlich-Peterson (Eq. 4)) and Sips (Eq. (5)). These models were adjusted by nonlinear regression using the Origin 8.5.1 software (OriginLab Corporation).
Figure 3 shows an L-type experimental isotherm with a concave (favorable) shape relative to the axis Ce. Giles et al. [33] reported that the slope does not
increase with increasing solute concentration for a curve with this type of geometry, indicating a high affinity between the solute and sorbent. This affinity allows molecules (or ions) to sorb to the surface and to sometimes experience particularly strong inter-molecular attractions.
As shown in Figure 3, the experimental values of qe reach a plateau when the equilibrium
concen-tration of solute in the solution reaches 40 mg·L-1. This plateau value was defined as the experimental sorption capacity and equaled 1.60 mg·g-1. By
obs-erving the shape of the predicted isotherms, it is pos-sible to qualitatively assess the interaction between the ions in solution and the sorbent.
Figure 3 also indicates that the Redlich-Peter-son, Langmuir and Sips models accurately describe
the experimental data for the concentration ranges in this study.
The Freundlich isotherm, which has been suc-cessfully applied to many sorption processes [34,35], did not represent the best fit for the experimental data obtained in this study. Table 1 shows that the coef-ficient of determination, R2, and Chi-square test
sta-tistic, χ2, for the Freundlich model had values of 0.9676 and 0.1788, respectively. Figure 3 indicates that the Freundlich model better applies to solute concentrations of less than 30 mg·L-1. However, the
low value of R2 obtained with this model suggests that the initial concentration interval (ci), in this study is
high. Values greater than 30 mg·L-1 for the final NO-3
concentration (ce) lead to lower values of R2 and
con-sequently larger values of χ2. In other words, although the Freundlich model analyzed graphically in Figure 3 was initially described as an appropriate model for the process, this model generated errors to give NO
-3
concentrations beyond 30 mg·L-1. This result demon-strates that the Freundlich model best applies to low concentrations, which is a result also shown by Lang-muir [16] by applying the model for the sorption of gases in solids to their data.
Table 1. Comparison of non-linear regression coefficients of determination, R2, Chi-square test statistic, χ2, and isotherm parameters
Langmuir Freundlich Sips Redlich-Peterson
qm 1.8297 Kf 0.4254 qm 1.9311 A 0.2961 KL 0.1413 N 2.7656 b 0.1510 B 0.2070 R2
0.9972 R2
0.9676 γ 0.9048 Ǖ 0.9373
χ2 0.0113
χ2 0.1788
R2 0.9978
R2 0.9979
χ2
0.0095 χ2
0.0079
According to Giles et al. [33], the term 1/n in the Freundlich Equation indicates that when n > 1, the curve generated by plotting values of qe against ce is
concave relative to the axis of the abscissa, which indicates a process that favors sorption. The value of n shown in Table 1 indicates that this experiment is favorable.
The constant Kf may be used to compare the
sorption process for the same sorbent with different solutes. Conversely, Kf may also be used to compare
the sorption process for different sorbents in the same solute. These comparisons help establish the system with the most efficient sorption. Febrianto et al. [36] state that, unlike the Langmuir constant (qm), Kf does
not provide the sorption capacity, as the sorbent does not reach saturation in the Freundlich model.
The coefficients of determination (R2
) for the Redlich-Peterson, Sips and Langmuir models pre-sented in Table 1 are very similar; thus, the most approriate model cannot be chosen based on these values. To compare the three models, the Chi-square test statistic, χ2
, was used. The results of this analysis showed that the Redlich-Peterson model best fits the experimental data.
The value of KL indicates the favorability of the
process as well as the affinity between the sorbent and sorbate. Langmuir demonstrated with the use of mathematical equations that KL depends on the molar
mass of the sorbate, time, temperature and the num-ber of elementary areas per square meter of sorbent surface [19]. In other words, the number of sorbed molecules cannot exceed the number of elementary spaces (active sites) without the formation of addi-tional layers. However, the forces acting between two layers of sorbate molecules are usually much smaller than the forces acting between the sorbent and sor-bate. Thus, the higher the value of KL, the greater the
driving force for sorption. In fact, the Langmuir Equation (Eq. (2)) indicates a positive correlation between KL and the sorption capacity.
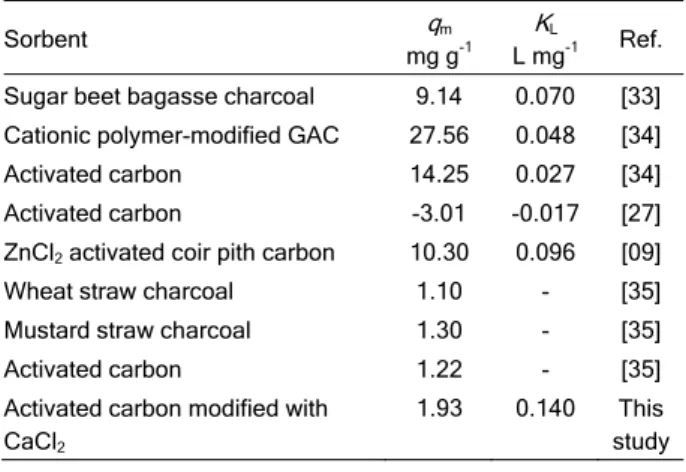
In general, KL values for the sorption of NO3– are
less than 1 L·mg-1. Table 2 shows the values of KL
found in the literature for the sorption of NO3– on
different types of coals. Therefore, based on the KL
values obtained by several authors, the value of KL
obtained in this study (0.1401 L·mg-1) indicates good affinity and a high-energy sorption process.
The qm values obtained with the Langmuir and
Sips models shown in Table 1 (1.8297 and 1.9311 mg·g-1, respectively) are similar to the experimental qe
value (1.60 mg·g-1). Furthermore, both of these
models fit the experimental data well (R² > 0.99). Therefore, the Langmuir and Sips models
appro-priately describe the sorption of NO-3 on modified
GAC with χ2
values of 0.0113 and 0.0095, respect-ively.
Table 2. qm and KL values for the sorption of nitrate on different types of coals
Sorbent qm mg g-1
KL
L mg-1 Ref. Sugar beet bagasse charcoal 9.14 0.070 [33] Cationic polymer-modified GAC 27.56 0.048 [34] Activated carbon 14.25 0.027 [34] Activated carbon -3.01 -0.017 [27] ZnCl2 activated coir pith carbon 10.30 0.096 [09]
Wheat straw charcoal 1.10 - [35] Mustard straw charcoal 1.30 - [35] Activated carbon 1.22 - [35] Activated carbon modified with
CaCl2
1.93 0.140 This study
Comparing the qm values in the literature (Table
2) with KL and analyzing the relationship between the
Langmuir sorption capacity and energy constant [37] indicates that sorption may be occurring in several layers for high values of qm. This notion is supported
by the intensity of KL. In the present work, KL values
are smaller than 0.1401 for large sorption capacities (qm is 9.14, 27.56 and 14.25 mg·g-1). This result also
demonstrates that the nitrate may be adsorbing in more than one layer when qm is high and KL is low.
Therefore, the Langmuir model does not apply. The exponent β in the Redlich-Peterson model (Eq. (4)) and the exponent ǖ in the Sips model (Eq. (5)) given in Table 1 also indicate that these models approximate the Langmuir isotherm.
Kinectic studies
Sorption kinetics are an important characteristic for evaluating the efficiency of sorption. The kinetic behavior of this process was studied at pH 6 and 25
°C using two different initial nitrate concentrations (Fig. 4). Figure 4, which represents the kinetics of nit-rate sorption, indicates that the process occurs in two phases: an initial rapid phase followed by a slower phase that ultimately reaches equilibrium.
The initial high rate of nitrate sorption is most likely due to the greater availability of binding sites near the surface of the modified GAC. The sorption capacity increases with an increase in the initial nit-rate concentration, but the time required to reach equilibrium appears to be almost independent of the initial concentration.
and pseudo-second-order kinetic rate models (Eq. (7)) [40], as well as an intra-particle diffusion model (Eq. (8)) [41] were used to fit the experimental kinetic data:
(
)
1e e
log log
2.303
t
k
q −q = q − t (6)
e
1 1
t
t
t q =h+q and
2 2 e
h=k q (7)
where qe (mg·g-1) and qt (mg·g-1) are the amounts of
nitrate adsorbed to the modified GAC at equilibrium and at different time intervals, respectively. The cons-tants k1 (min-1) and k2 (g·mg-1·min-1) are the
pseudo-first-order and pseudo-second-order rate constants, respectively. The variable h represents the initial adsorption rate (mg·g-1·min-1). The variable qt is
further defined as:
2 p t
q =k t (8)
where kp is the intra-particle diffusion rate constant
(mg·g-1·min-0.5).
Figure 4. Effect of contact time on nitrate sorption by modified GAC at two different initial nitrate concentrations.
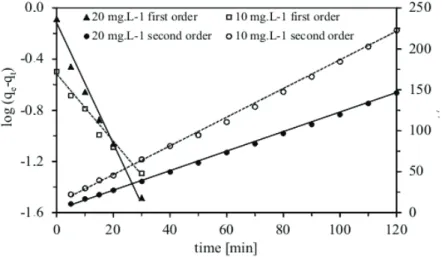
Correlations of the kinetic data with the two above kinetic rate models using different initial nitrate concentrations yielded linear plots (Figure 5). The curves for the pseudo-second-order rate model have higher correlation coefficients (R2
= 0.999 and 0.998) when compared with the correlation coefficient obtained from the linear plot of the pseudo-first-order rate model (R2 = 0.987 and 0.982).
The first order equation did not apply for all contact times and was only applicable over the initial 0-30 min sorption period. A plot of log (qe–qt) versus
time at different sorbate concentrations (Figure 5) deviated considerably from the data after a short period of time. The calculated slopes and intercepts from the plots were used to determine the rate cons-tant (k1) and equilibrium capacity (qcal). The values of
k1, qcal and the regression coefficient are provided in
Table 3. Figure 5 shows that the Lagergren model fits quite well for the first 30 min. However, the data deviate considerably from theory thereafter. In many cases, the pseudo-first-order rate model does not fit the entire range of contact time well and is generally applicable to only the initial stage of the sorption pro-cess. A similar trend was observed by Ho and McKay [39] for dyes on peat particles: The pseudo-first-order model represented the initial, rapid sorption stages well but could not be applied for the entire sorption process.
The best-fit model was selected based on two criteria: 1) the match between the experimental (qe)
and theoretical (qcal) sorption values, and 2) the linear
correlation coefficient (R2
) values for the concentra-tions tested in this work. The values obtained by the pseudo-second-order model (Figure 5) agreed well with experimental data and can be used to explain the
nitrate sorption to modified GAC. The resultant values from these calculations are given in Table 3.
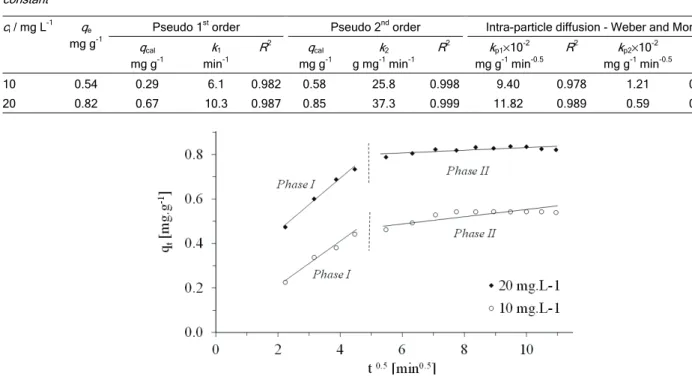
The intra-particle diffusion approach (Eq. (8)) can be used to predict if intra-particle diffusion is the rate-limiting step. The data can be represented in multiple linear plots, revealing that the process is governed by two or more steps (Figure 6) [42,28]. The first linear portion (phase I) at both concentrations can be attributed to the immediate utilization of the most readily available sorption sites on the sorbent surface. Phase II may be attributed to the very slow diffusion
of the sorbate from the surface site into the inner pores. Thus, nitrate sorption to modified GAC may be initially governed by the intra-particle transport of nit-rate controlled by surface diffusion processes and later by pore diffusion. The values of kp1 and kp2
(dif-fusion rate constants for phases I and II, respectively) obtained from the slope of linear plots are listed in Table 3.
CONCLUSIONS
This study shows that activated carbon modified with CaCl2 is an effective sorbent to remove nitrate
from aqueous solutions. The sorbent showed a lower surface pH after treatment, indicating that the surface modification of the activated carbon with CaCl2 was
successful. The increase in sorbent dosage
aug-mented the percent removal of nitrate due to an inc-rease in sorbent surface and dosage. Maximum rem-oval was observed between pH 3 and 9. In this range, 75% of the nitrate was removed, indicating that the sorption of nitrate with CaCl2-modified activated
car-bon can be accomplished over a wide pH range. The experimental sorption capacity (qe) was 1.60 mg·g-1,
while the sorption capacity (qcal) was calculated to be
1.93 mg·g-1 using the Sips model isotherm. The Lang-muir, Redlich-Peterson and Sips model isotherms represent the experimental data well. The coefficient of determination was greater than 0.99 and the
Chi-square test statistic was less than 0.1 for these three models. Finally, it was found that sorption kinetics obeyed a second order kinetic model.
REFERENCES
[1] A.H. Wolfe, J.A. Patz, Ambio. 31 (2002) 120–125 [2] B.P. Dash, S. Chaudhari, Water Res. 39 (2005)
4065-4072
[3] A. Liu, J. Ming, R.O. Ankumah, Sci. Total Environ. 346 (2005) 12–20
[4] M.N. Almasri, J.J. Kaluarachchi, Environ. Modell. Softw. 20 (2005) 851–871
[5] A. Terada, K. Hibiya, J. Nagai, S. Tsuneda, A. Hirata, J. Biosci. Bioeng. 95 (2003) 170–178
[6] P.T. Chiueh, Y.H. Lee, C.Y. Su, S. Lien Lo, J. Hazard. Mater. 192 (2011) 837-845
Table 3. Kinetic parameters for nitrate sorption to modified GAC for different initial nitrate concentrations; kp – intra-particle diffusion rate constant
ci / mg L-1 qe
mg g-1
Pseudo 1st order Pseudo 2nd order Intra-particle diffusion - Weber and Morris qcal
mg g-1
k1
min-1
R2
qcal
mg g-1
k2
g mg-1 min-1
R2
kp1×10 -2
mg g-1 min-0.5
R2
kp2×10 -2
mg g-1 min-0.5
R2
10 0.54 0.29 6.1 0.982 0.58 25.8 0.998 9.40 0.978 1.21 0.913 20 0.82 0.67 10.3 0.987 0.85 37.3 0.999 11.82 0.989 0.59 0.917
[7] Z. Aksu, Process Biochem. 40 (2005) 997–1026
[8] N. Viswanathan, S. Meenakshi, Appl. Clay Sci. 48 (2010) 607–611
[9] C. Namasivayam, D. Sangeetha, Indian J. Chem. Technol. 12 (2005) 513–521
[10] H. Guan, E. Bestland, C. Zhu, H. Zhu, D. Albertsdottir, J. Hutson, C.T. Simmons, M.M. Ginic, X. Tao, A.V. Ellis, J. Hazard. Mater. 183 (2010) 616–621
[11] A. Bhatnagar, Y. Choi, Y. Yoon, Y. Shin, B.H. Jeon, J.W. Kang, J. Hazard. Mater. 170 (2009) 134–140
[12] R. Mahmudov, C.P. Huang, Separ. Purif. Technol. 70 (2010) 329–337
[13] A. Bhatnagar, M.A. Sillanpaa, Chem. Eng. J. 168 (2011) 493-504
[14] E. Herczynska, J. Inorg. Nucl. Chem. 26 (1964) 2127-2133
[15] APHA, Standard methods for the examination of water and waste water, 23th ed., American Public Health,
Washington DC, 2000
[16] S. Shrestha, G. Son, S.H. Lee, T.G. Lee, Chemosphere, 92 (2013) 1053-1061
[17] M. Torab-Mostaedi, Chem. Ind. Chem. Eng. Q. 19 (2013) 79−88
[18] H. Bahrami, J. Safdari, M.A. Moosavian, M. Torab-Mos-taedi, Chem. Ind. Chem. Eng. Quarterly, 18 (2012) 497-508
[19] I. Langmuir, J. Am. Chem. Soc. 40 (1918) 1361-1403 [20] M. Suzuki, Adsorption and engineering. Chemical
eng-ineering monographs, 25, Kodansha, Japan, 1990 [21] W.L. McCabe, J.C. Smith, P. Harriott, Unit operations of
chemical engineering. 5th ed. McGraw-Hill, New York, 1993
[22] H.M.F. Freundlich, J. Phys. Chem. 57 (1906) 385–470 [23] O. Redlich, D.L. Peterson, J. Phys. Chem. 63 (1959)
1024
[24] R. Sips, J. Chem. Phys. 16 (1948) 490–495
[25] B. Boulinguiez, P. Le Clorec, D. Wolbert, Langmuir 24 (2008) 6420-6424
[26] V.C. Srivastava, I.D. Mall, I.M. Mishra, Chem. Eng. Pro-cess.: Proc. Intensification 47 (2008) 1269-1280
[27] F.A. Pavan. E.C. Lima, S.L.P. Dias, A.C. Mazzocato, J. Hazard. Mater. 150 (2008) 703-712
[28] J.C.P. Vaghetti, E.C. Lima, B. Royer, J.L. Brasil, B.M. da Cunha, N.M. Simon, N.F. Cardoso, C.P.Z. Norena, Bio-chem. Eng. J. 42 (2008) 67-76
[29] A. Ozer, D. Ozer, A. Ozer, Process Biochem. 39 (2004) 2183-2191
[30] N. Ozturk, T.E. Bektas, J. Hazard. Mater. 112 (2004) 155- –162
[31] M.O. Corapcioglu, C.P. Huang, Water Res. 21 (1987) 1031-1044
[32] R. Chintala, J. Mollinedo, T.E. Schumacher, S.K. Papier-nik, D.D. Malo, D.E. Clay, S. Kumar, D.W. Gulbrandson, Microp. Mesop. Mat. 179 (2013) 250-257
[33] C.H. Giles, T.H. Macewans, N. Nakhwa, D. Smith, J. Chem. Soc. (1960) 3973-3993
[34] S. Rengaraj, S.H. Moon, R. Sivabalan, B. Arabindoo, V. Murugeson, Waste Manage. 22 (2002) 543-548
[35] V.K. Gupta, C.K. Jain, I. Ali, S. Chandra, S. Agarwal, Water Res. 36 (2002) 2483-2490
[36] J. Febrianto, A.N. Kosasih, J. Sunarso, Y.H. Ju, N. Indra-swati, S. Ismadji, J. Hazard. Mater. 162 (2009) 616-645 [37] H. Demiral, G. Gunduzoglu, Bioresour. Technol. 101
(2010) 1675-1680
[38] S. Lagergren, About the theory of so-called adsorption of soluble substances, K. Sven. Vetenskapsakad. Handl. 24 (1898) 1–39
[39] Y.S. Ho, G. McKay, Water Res. 33 (1999) 578-584 [40] Y.S. Ho, G. McKay, Process Biochem. 34 (1999) 451–465 [41] W.J. Weber, J.C. Morris, J. Sanit. Eng. Div. 89 (1963) 31–
–59
ODIVAN ZANELLA1,2 ISABEL CRISTINA TESSARO1,3 LILIANA AMARAL FÉRIS1,2 1Federal University of Rio Grande do
Sul, Department of Chemical Engineering, Porto Alegre, Brazil
2
Federal University of Rio Grande do Sul, Department of Chemical Engineering, Laboratory of separation and unit operations, Porto Alegre, Brazil
3 Federal University of Rio Grande do
Sul, Department of Chemical Engineering, Laboratory of membrane separation process, Porto Alegre, Brazil
NAUČNI RAD
SORPCIJA NITRATA NA AKTIVNOM UGLJU
MODIFIKOVANOM SA CaCl
2: RAVNOTEŽA,
IZOTERME I KINETIKA
U radu je istraživano izdvajanje nitrata iz vodenih rastvora pomoću granularnog aktivnog uglja (GAU) koji je modifikovan CaCl2. Uticaj količine sorbenta, početne koncentracije nitrata i pH je istraživan u šaržnom sorpcionom sistemu. Maksimalna sorpcija se postiže iu oblasti pH 3-9. Proučavanje uticaka pH je pokazalo da bi mehanizam jonske izmene mogao biti uključen u ovaj sorpcioni process. Stepen izdvajanja nitrata se povećava sa povećanjem koncentracije sorbenta, a idealna količina sorbenta je 20 g/L. Od četiri
koriš-ćena modela sorpcione izoterme (Langmuir, Freundlich, Peterson i Sips), Redlich--Petersonov model je sa najvećim koeficijentom determinacije (0,990) i najboljim hi-kva-drat testom (0,0079). Sorpcioni kapacitet, određen Sipsovim modelom, iznosio je 1,93 mg nitrata/g sorbenta. Kinetička istraživanja su ukazala da je ova sorpcija brz process, koji dostiže ravnotežu za 120 min. Pokazano je da model pseudo-drugog reda uspešno fituje kinetičke podatke. Rezultati ovog rada su demonstrirala potencijalnu primenu mofikovanog GAU za izdvajanje nitrata iz vodenih rastvora.