ACPD
11, 28395–28443, 2011Part 2: Relationships with atmospheric physical parameters
H. Mao et al.
Title Page
Abstract Introduction
Conclusions References
Tables Figures
◭ ◮
◭ ◮
Back Close
Full Screen / Esc
Printer-friendly Version Interactive Discussion
Discussion
P
a
per
|
Dis
cussion
P
a
per
|
Discussion
P
a
per
|
Discussio
n
P
a
per
|
Atmos. Chem. Phys. Discuss., 11, 28395–28443, 2011 www.atmos-chem-phys-discuss.net/11/28395/2011/ doi:10.5194/acpd-11-28395-2011
© Author(s) 2011. CC Attribution 3.0 License.
Atmospheric Chemistry and Physics Discussions
This discussion paper is/has been under review for the journal Atmospheric Chemistry and Physics (ACP). Please refer to the corresponding final paper in ACP if available.
Speciated mercury at marine, coastal, and
inland sites in New England – Part 2:
Relationships with atmospheric physical
parameters
H. Mao1, R. Talbot2, J. Hegarty3, and J. Koermer4
1
Department of Chemistry, State University of New York, College of Environmental Science and Technology, Syracuse, NY 13219, USA
2
Department of Earth and Atmospheric Sciences, University of Houston, Houston, TX 77204, USA
3
AER, Inc., 131 Hartwell Avenue, Lexington, MA, 02421, USA 4
Department of Atmospheric Science & Chemistry, Plymouth State University, Plymouth, New Hampshire 03264, USA
Received: 27 September 2011 – Accepted: 7 October 2011 – Published: 21 October 2011
Correspondence to: H. Mao ([email protected])
ACPD
11, 28395–28443, 2011Part 2: Relationships with atmospheric physical parameters
H. Mao et al.
Title Page
Abstract Introduction
Conclusions References
Tables Figures
◭ ◮
◭ ◮
Back Close
Full Screen / Esc
Printer-friendly Version Interactive Discussion
Discussion
P
a
per
|
Dis
cussion
P
a
per
|
Discussion
P
a
per
|
Discussio
n
P
a
per
|
Abstract
Long-term continuous measurements of gaseous elemental mercury (Hgo), reactive
gaseous mercury (RGM), and particulate phase mercury (Hgp) were conducted at
coastal (Thompson Farm, denoted as TF), marine (Appledore Island, denoted as AI), and elevated inland (Pac Monadnock, denoted as PM) monitoring sites of the AIRMAP
5
Observing Network. Diurnal, seasonal, annual, and interannual variability in Hgo, RGM, and Hgpfrom the three distinctly different environments were characterized and compared in Part 1. Here in Part 2 relationships between speciated mercury (i.e., Hgo, RGM, and Hgp) and climate variables (e.g., temperature, wind speed, humidity, solar radiation, and precipitation) were examined. The best point-to-point correlations were
10
found between Hgoand temperature in summer at TF and spring at PM, but there was no similar correlation at AI. Subsets of data demonstrated regional impacts of episodic dynamic processes such as strong cyclonic systems on ambient levels of Hgo at all three sites, possibly through enhanced oceanic evasion of Hgo. A tendency of higher levels of RGM and Hgpwas identified in spring and summer under sunny conditions in
15
all environments. Specifically, the 10th, 25th, median, 75th, and 90th percentile mixing ratios of RGM and Hgpincreased with stronger solar radiation at both the coastal and marine sites. These metrics decreased with increasing wind speed at AI indicating en-hanced loss of RGM and Hgpthrough deposition. RGM and Hgplevels correlated with temperature positively in spring, summer and fall at the coastal and marine locations.
20
In the coastal region relationships between RGM and relative humidity suggested a clear decreasing tendency in all metrics from<40 % to 100 % relative humidity in all seasons especially in spring, compared to less variability in the marine environment. The effect of precipitation on RGM at coastal and marine locations was similar. At the coastal site, RGM levels were a factor of 3–4 higher under dry conditions than rainy
25
ACPD
11, 28395–28443, 2011Part 2: Relationships with atmospheric physical parameters
H. Mao et al.
Title Page
Abstract Introduction
Conclusions References
Tables Figures
◭ ◮
◭ ◮
Back Close
Full Screen / Esc
Printer-friendly Version Interactive Discussion
Discussion
P
a
per
|
Dis
cussion
P
a
per
|
Discussion
P
a
per
|
Discussio
n
P
a
per
|
rainy conditions. Precipitation had negligible impact on the magnitude and pattern of diurnal variation of Hgpin all seasons in the marine environment.
1 Introduction
Mercury is a dangerous toxin detrimental to human health and thus it is of paramount importance to understand the processes that control the ambient levels of atmospheric
5
mercury. Mercury exists in three forms, gaseous elemental mercury (Hgo), reactive gaseous mercury (RGM=HgCl2+HgBr2+HgOBr+. . . ), and particulate phase mer-cury (Hgp). Mercury cycling, i.e., transformation between the three forms, is intricately linked to dynamical, physical and chemical processes in the atmosphere. Moreover, source and sink strengths of Hgoare dependent on physical parameters such as
tem-10
perature and wind. However, Jacob and Winner (2008) pointed out that the effect of long-term changing physical parameters (i.e., climate changes) on mercury cycling has received no attention to date.
Previous research has been conducted to examine the relationships between mer-cury and physical variables over a limited time period ranging from days to one or two
15
years, which appeared to vary greatly at various geographic locations. For example, G ˚ardfeldt et al. (2003) found from their one month campaign over the Atlantic and two month measurements over the Mediterranean Sea that mercury evasion from sea wa-ter depended on temperature, wind, and salinity. Han et al. (2004) attributed a negative correlation between TGM and temperature to seasonal difference in emission rates of
20
coal-fired power plants (winter maximum) in the Northern Hemisphere based on two summers of measurement data. A negative correlation between temperature and TGM was shown by measurements during a winter month at a rural site in the central Pearl River Delta region (Li et al., 2011). A ten month data set at Elora, Ontario, Canada suggested highest Hgoconcentrations in late spring and fall possibly due to increases
25
ACPD
11, 28395–28443, 2011Part 2: Relationships with atmospheric physical parameters
H. Mao et al.
Title Page
Abstract Introduction
Conclusions References
Tables Figures
◭ ◮
◭ ◮
Back Close
Full Screen / Esc
Printer-friendly Version Interactive Discussion
Discussion
P
a
per
|
Dis
cussion
P
a
per
|
Discussion
P
a
per
|
Discussio
n
P
a
per
|
et al., 2009a) with significant positive correlation between seasonally averaged Hgo and temperature in spring and fall 2007 at a coastal and marine site from southern New Hampshire. Ambient levels of Hgoand TGM were also found to be correlated with solar radiation, relative humidity, and planetary boundary layer height (Cobbetta et al., 2007; Stamenkovic et al., 2007).
5
Reactive mercury was reportedly linked to temperature, radiation, humidity and pre-cipitation. Sigler et al. (2009a) presented a positive relationship between seasonal av-eraged RGM and temperature at a coastal site whereas none from the marine site. Transformation from Hgo to RGM by oxidation involves photochemistry (Lin et al., 1999), which indicates a link between RGM concentrations and solar radiation.
In-10
deed, studies have shown the diurnal patterns of RGM and radiation flux were close in phase (Mason and Sheu, 2002; Spovieri et al., 2003; Sigler et al., 2009a). Laurier et al. (2003) observed the concurrence of highest RGM and maximum UV radiation flux in the marine boundary layer over the North Pacific Ocean. Highest RGM levels were observed around midday after nights of high relative humidity, while lowest
concen-15
trations were found during high relative humidity and rainfall (Mason and Sheu, 2002; Laurier et al., 2003, 2007; Poissant et al., 2004, 2005).
There are limited long-term data sets of Hgp, and their relationships with physical variables suggested that high levels were mostly associated with wind driven trans-port, chemical and physical transformation processes. For instance, the one-year Hgp
20
dataset from Poissant et al. (2005) exhibited higher levels of Hgpassociated with trans-port, RGM gas-particle partitioning, and Hgooxidation. Liu et al. (2007) suggested that the diurnal pattern of Hgp(as well as that of Hgo) was strongly influenced by boundary layer dynamics, temperature and humidity based on their one year measurements in Detroit, MI. Similarly, Brooks et al. (2010) found that peaks of Hgp(as well as Hgoand
25
ACPD
11, 28395–28443, 2011Part 2: Relationships with atmospheric physical parameters
H. Mao et al.
Title Page
Abstract Introduction
Conclusions References
Tables Figures
◭ ◮
◭ ◮
Back Close
Full Screen / Esc
Printer-friendly Version Interactive Discussion
Discussion
P
a
per
|
Dis
cussion
P
a
per
|
Discussion
P
a
per
|
Discussio
n
P
a
per
|
Wind data have been used to trace back the origin of high mercury concentrations. Some studies often found association between high concentrations of mercury and wind direction which points to upwind source regions (e.g., Gabriel et al., 2005; Pois-sant et al., 2005; Aucott et al., 2009; Sigler et al., 2009a; Baya and van Heyst, 2010), while others detected no correlation (Castillo et al., 2011). In addition, our previous
5
study found a relationship between wind speed and possible oceanic evasion (Sigler et al., 2009b). We hypothesized the impact of the April 2007 Nor’easter on ambient levels of Hgothat were reflected in sudden enhancements of 52 ppqv and 26 ppqv over a span of 14 and 12 h at a coastal and inland site, respectively.
Few studies have been dedicated to the investigation of long-term relationships
be-10
tween speciated mercury and physical parameters. Six-year measurement datasets from Mace Head, Ireland and Zingst, Germany showed a strong positive correlation TGM bore with wind and dew point (Kock et al., 2005). Cole and Steffen (2010) found a positive correlation between Hgo and air temperature from their 12 yr (1995–2007) measurement data in Alert, Canada although it was not clear if temperature was the
15
direct cause of the Hgo variability. Multiple-year continuous measurements of Hgo,
RGM, and Hgp have been conducted at inland, coastal, and marine locations from
the AIRMAP Observing Network. A comprehensive analysis was presented in Part 1 (Mao and Talbot, 2011a) for Hgo, RGM, and Hgo variations ranging from diurnal to interannual time scales at locations with distinct geographical characteristics. In this
20
study we investigated how the three forms of mercury are associated with atmospheric conditions via their relationships with climate variables in different environments.
2 Measurements and approach
As stated in Mao and Talbot (2011a), multiple-year measurements of Hgo, RGM,
and Hgp have been conducted at three AIRMAP (www.airmap.unh.edu) Observatory
25
ACPD
11, 28395–28443, 2011Part 2: Relationships with atmospheric physical parameters
H. Mao et al.
Title Page
Abstract Introduction
Conclusions References
Tables Figures
◭ ◮
◭ ◮
Back Close
Full Screen / Esc
Printer-friendly Version Interactive Discussion
Discussion
P
a
per
|
Dis
cussion
P
a
per
|
Discussion
P
a
per
|
Discussio
n
P
a
per
|
The PM and TF sites are 185 and 25 km, respectively, inland from the Atlantic Ocean, while AI is 10 km offshore in the Gulf of Maine. The locations of the three sites form a unique west-east oriented transect with site surroundings composed of heav-ily forested, coastal, and marine boundary layer environments. Moreover, due to the remote central location of PM in New England and its 700 m elevation (i.e., above the
5
nocturnal inversion and in the middle of the daytime boundary layer), the site is ide-ally located to determine regional trends in trace gases, including mercury (Mao and Talbot, 2004; Mao et al., 2008).
Mercury instruments were operated in a manner identical at TF, PM, and AI to ensure data consistency. Details of the instruments can be found in Mao et al. (2008), Sigler
10
et al. (2009a), and Mao and Talbot (2011a). Briefly, a Tekran 1130 denuder module operated in series with the 2537A provided continuous measurements of RGM and Hgo respectively. Ambient mixing ratios of Hgo were measured continuously using the 2537A cold vapor atomic fluorescence spectrometer with 5-minute time resolution and a limit of detection (LOD) of∼10 ppqv (1 ng m−3
=112 ppqv). RGM is measured
15
with a 90 min sampling interval yielding a LOD of∼0.1 ppqv based on three times the standard deviation of the field blank values determined at TF during 2007. The inlet of the 1135 Hgp Tekran at AI was modified by replacing the elutriator with one that contained no impaction plate to facilitate collection of coarse aerosols on the quartz frit in the Tekran 1135 (Talbot et al., 2011).
20
Continuous Hgo measurements with 5-minute resolution have been ongoing since November 2003 at TF, December 2004 at PM, and June 2007 on AI. Measurements of RGM with 2-h resolution were added at TF in November 2006, December 2006 at PM, and on AI in June 2007. Measurements of Hgpstarted at TF in February 2009 and on AI in April 2009.
25
ACPD
11, 28395–28443, 2011Part 2: Relationships with atmospheric physical parameters
H. Mao et al.
Title Page
Abstract Introduction
Conclusions References
Tables Figures
◭ ◮
◭ ◮
Back Close
Full Screen / Esc
Printer-friendly Version Interactive Discussion
Discussion
P
a
per
|
Dis
cussion
P
a
per
|
Discussion
P
a
per
|
Discussio
n
P
a
per
|
at http://www.ncdc.noaa.gov/crn/products.html), as well as 6-hourly precipitation data from NOAA’s National Weather Service site at Pease, NH which is the closest approx-imation for data on AI. There were a significant fraction of wind and temperature data missing on AI due to power shortage under extreme weather conditions when Go-MOOS meteorological data from the site on Star Island was used as substitute. The
5
two islands were merely a few tens meters apart and their overlapping data of temper-ature and wind were verified to be correlated atr2>0.9. GoMOOS data are publicly available (http://www.gomoos.org/data/recent.html).
Measurement data of carbon monoxide (CO) were used in this study in determining anthropogenic influence. A detailed study of relationships between Hgo/RGM/Hgpand
10
other chemical compounds will be presented in Part 3 (Mao et al., 2011b). A descrip-tion of CO measurement can be found in Mao and Talbot (2004a).
3 Relationships between Hgo/RGM/HgPand meteorological parameters
3.1 Wind
One of significant sources of mercury is anthropogenic emissions, and the AIRMAP
15
Observing Network is located downwind of major industrial sources and metropolitan areas. Moreover, Sigler et al. (2009b) reported enhancements of 30–50 ppqv in Hgo mixing ratios at TF a coastal and at PM an elevated inland site in southern NH during the most intense period of the April 2007 Nor’easter and hypothesized that it was due to strong wind induced oceanic emissions. Therefore, it is logical to speculate on an
20
association between Hgo levels and wind speed and direction. Yet, seasonal scatter plots of Hgomixing ratios versus wind speed and directions at TF, AI, and PM did not reveal distinct relationships (not shown).
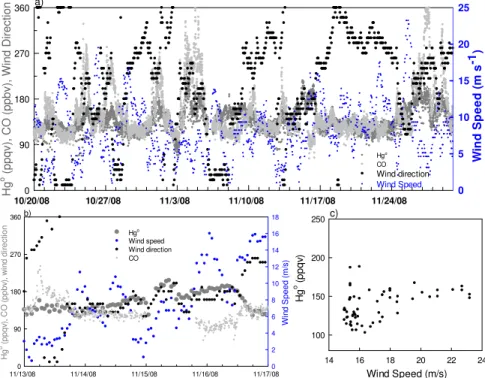
However, a close examination of a subset of data revealed association between Hgo mixing ratios and wind speed at AI, as suggested in Fig. 1a, where the majority of the
25
ACPD
11, 28395–28443, 2011Part 2: Relationships with atmospheric physical parameters
H. Mao et al.
Title Page
Abstract Introduction
Conclusions References
Tables Figures
◭ ◮
◭ ◮
Back Close
Full Screen / Esc
Printer-friendly Version Interactive Discussion
Discussion
P
a
per
|
Dis
cussion
P
a
per
|
Discussion
P
a
per
|
Discussio
n
P
a
per
|
November 2008. Interestingly there appeared to be a 3–4 day periodicity in Hgomixing ratios during the time period of 22 October–30 November 2008 (Fig. 1a). Some periods of higher Hgo levels coincided with higher CO levels and others showed Hgo and CO in opposite phases. A particular interesting case is the one over 14–16 November 2008, when Hgo and wind speed was correlated atr2=0.18 and slope=3.7 ppqv per
5
m s−1 (Fig. 1b, c). The Hgo mixing ratio started increasing in the early morning and was enhanced by∼70 ppqv reaching 205 ppqv in 24 h, and this increase, somewhat dampened later on, lasted through midday 16 November. During the hours of the first Hgo peak on 15 November CO measurements were not available; during the hours of the second Hgopeak on 16 November, CO mixing ratios were decreased by∼40 ppbv
10
to as low as∼90 ppbv at 00:00. The wind direction appeared to be varying in the two easterly quadrants and was mostly southerly and southeasterly at the times of the CO minimum and Hgo maximum. This indicates that the increase of Hgo on 16 November was likely influenced by an influx of air from the relatively clean oceanic region.
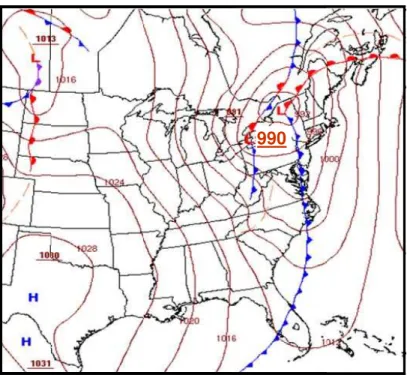
To support our speculation, we examined the dynamic patterns during 14–16
Novem-15
ber 2008. During this time period New England was impacted by a strong cyclone with sustained coastal surface winds exceeding 15 m s−1and periods of widespread heavy rainfall. At 00:00 UTC on 16 November the cyclone was located in upstate New York near the Canadian border with a central sea level pressure of 990 hPa (Fig. 2) and produced strengthening southerly and southeasterly surface winds at AI and
surround-20
ing coastal and marine locations during the afternoon of 15 November and into the morning of 16 November. The wind speed measured at AI increased from∼3 m s−1at 00:00 UTC on 15 November to ∼8 m s−1 after 12 h, then after a slight slowing during that afternoon increased steadily to a peak value greater than 16 m s−1by 00:00 UTC on 16 November. The winds at AI shifted into the southwesterly and then
northwest-25
ACPD
11, 28395–28443, 2011Part 2: Relationships with atmospheric physical parameters
H. Mao et al.
Title Page
Abstract Introduction
Conclusions References
Tables Figures
◭ ◮
◭ ◮
Back Close
Full Screen / Esc
Printer-friendly Version Interactive Discussion
Discussion
P
a
per
|
Dis
cussion
P
a
per
|
Discussion
P
a
per
|
Discussio
n
P
a
per
|
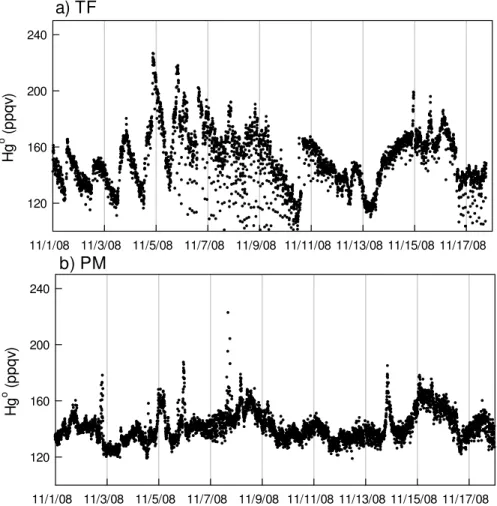
We also examined Hgo mixing ratios during the same time period for TF and PM (Fig. 3). Prior to the storm there were distinct diurnal cycles at TF with the daily maximum in the late afternoon followed by a steady decrease to the daily minimum before sunrise. On 13 November the Hgo mixing ratio kept rising after reaching the daily maximum and the increasing trend continued through 14 November leveling offat
5
173 ppqv on 15 November and then hovered around that level until 12:00 of 16 Novem-ber (Fig. 3a). PM experienced an increase during 14–15 NovemNovem-ber that was similar to the one at TF followed by a slowed decrease on 15 November (Fig. 3b). These some-what synchronized changes in Hgo mixing ratios at the three sites during the storm echoed our hypothesis in Sigler et al. (2009b) that strong wind induced enhancement
10
in oceanic emissions of Hgo can have a regional influence on ambient levels of Hgo that can reach far inland.
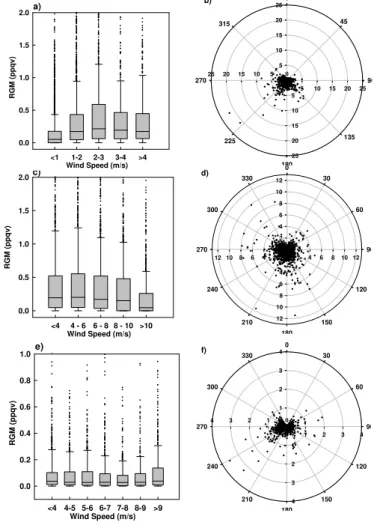
The relationship between RGM and wind speed at TF revealed that 50 % of the to-tal data were collected under wind speed<1 m s−1. The examination represented in Fig. 4a suggested that: (1) the largest 75th percentile value (0.6 ppqv) was associated
15
with wind speed 2–3 m s−1, and (2) the median and 75th percentile values were lowest
for all data collected when wind speed is less than 1 m s−1. The implications of these features are threefold. First, under relative calm conditions RGM levels tended to be lower compared to windier conditions, indicating that air masses with higher RGM lev-els were most likely transported from upwind sources. Second, there are opposing
20
effects of windier conditions on the ambient level of RGM at TF, increased dry depo-sitional loss and enhanced transport of RGM. In addition, stronger winds are often associated with precipitation resulting in scavenging via wet deposition. The wind rose of RGM (Fig. 4b) showed that mixing ratios over 0.6–3 ppqv occurred in all wind di-rections except over the ranges of 330◦–360◦ and 0◦–45◦. RGM>3 ppqv occurred in
25
ACPD
11, 28395–28443, 2011Part 2: Relationships with atmospheric physical parameters
H. Mao et al.
Title Page
Abstract Introduction
Conclusions References
Tables Figures
◭ ◮
◭ ◮
Back Close
Full Screen / Esc
Printer-friendly Version Interactive Discussion
Discussion
P
a
per
|
Dis
cussion
P
a
per
|
Discussion
P
a
per
|
Discussio
n
P
a
per
|
combustion sources, which will be further investigated in a separate manuscript on the relationships between mercury and key chemical compounds (Mao et al., 2011b).
Compared to TF, winds were stronger at AI, and RGM mixing ratios appeared to be less dependent on wind speed, which is evidenced in median values of 0.2 ppqv in all wind speed ranges except the median value below the LOD for wind speed greater than
5
10 m s−1 (Fig. 4c). The 75th percentile value varied from 0.3 ppqv at winds exceeding
10 m s−1 to 0.6 ppqv at winds<6 m s−1. RGM at AI is a result of Hgo oxidation, trans-port, and deposition, of which the net effect seemed to be most positive to the ambient level over the<6 m s−1 wind speed range. The wind rose (Fig. 4d) suggested that the
majority of RGM mixing ratios>1 ppqv were observed in all directions, but the few ones
10
>4 ppqv, which occurred in spring, were mostly from the south and the west, whose upwind source regions are the greater Boston area and southern NH. It is curious that RGM could survive the transport over a distance of 4–5 h, i.e.,∼80 km, in the marine air laden with sea salt aerosols. It implies strong net production of RGM in transit, largely in the marine environment in addition to possible anthropogenic contributions.
15
At PM median values of RGM mixing ratios in all wind ranges remained consistently below the LOD; the 75th percentile values barely reach the LOD (Fig. 4e). The majority of RGM mixing ratios>0.2 ppqv were observed in two primary wind direction ranges, east and southwest (Fig. 4f) in the four seasons of 2007, with a few samples from the southeast. There are two coal-fired power plants southwest of PM near Springfield,
20
MA (Solution, Inc. and Northeastern Utilities), one southeast of PM in Salem, MA (Do-minion Salem Harbor), and two east of PM in NH. Possibly on days with favorable wind conditions influence of these power plant emissions could reach PM.
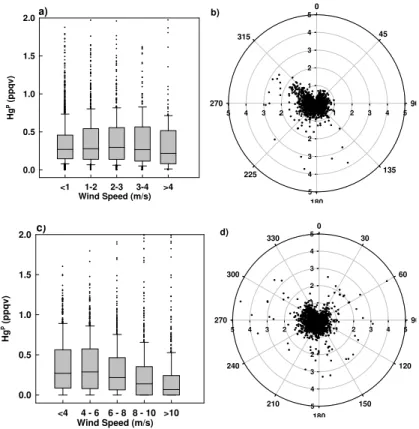
The relationship between Hgp and wind speed at TF suggested no dependence of
all metrics of Hgp, including 25th percentile, median, or 75th percentile values, on wind
25
ACPD
11, 28395–28443, 2011Part 2: Relationships with atmospheric physical parameters
H. Mao et al.
Title Page
Abstract Introduction
Conclusions References
Tables Figures
◭ ◮
◭ ◮
Back Close
Full Screen / Esc
Printer-friendly Version Interactive Discussion
Discussion
P
a
per
|
Dis
cussion
P
a
per
|
Discussion
P
a
per
|
Discussio
n
P
a
per
|
Unlike the TF location, at AI there appeared to be a decreasing tendency in Hgp mixing ratios with increasing wind speed (Fig. 5c). In particular, the 75th percentile value decreased from 0.6 ppqv at wind speed <6 m s−1 to 0.2 ppqv at wind speed >10 m s−1, and the trend in median values for all wind speed ranges was similar but the decrease rate was slowed by one-half. This suggests a strong impact of dry
de-5
positional loss of aerosols on ambient mixing ratios. For samples with Hgp>1.5 ppqv, air masses seemed to come from all directions, whereas air with Hgp over the range of 0.5–1.5 ppqv was more prevalent in the westerly flow indicating a land influence (Fig. 5d).
3.2 Solar radiation
10
The relationship of Hgo, RGM, or Hgp with solar radiation was examined using Hgo, RGM, or Hgp versus surface solar radiation flux at TF while versus jNO2 at AI for daytime: 12:00–18:00 UTC and 18:00–00:00 UTC. No measurements of solar radiation were available at PM. No relationship between Hgo and solar radiation was observed at TF and AI for the two daytime quadrants in all seasons, and thus we focus on RGM
15
and Hgp.
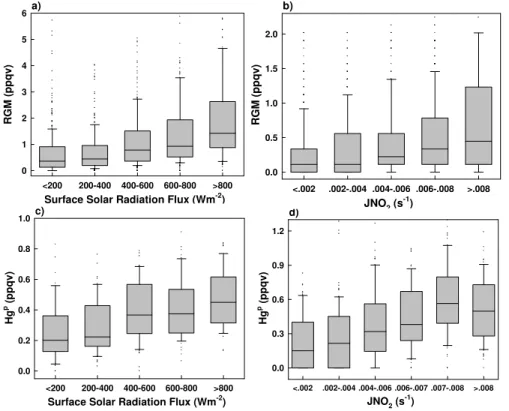
For RGM at TF, a positive relationship with solar radiation in spring was observed in the 25th, median, and 75th percentile values, while at AI a positive relationship was found in both spring and summer (Fig. 6a, b). The increase with radiation flux was more significant at TF with the median value rising from 0.4 to 1.4 ppqv compared
20
to a lesser increase from 0.1 to 0.4 ppqv at AI. For Hgp, its positive relationship with solar radiation was observed in summer at both TF and AI (Fig. 6c, d). One exception is that at AI, the increasing trends in the 25th, median, and 75th percentile values of Hgp turned downward at jNO2>0.008 s−1. These results indicate that production processes of RGM and Hgp are closely linked to solar radiation in the coastal and
25
ACPD
11, 28395–28443, 2011Part 2: Relationships with atmospheric physical parameters
H. Mao et al.
Title Page
Abstract Introduction
Conclusions References
Tables Figures
◭ ◮
◭ ◮
Back Close
Full Screen / Esc
Printer-friendly Version Interactive Discussion
Discussion
P
a
per
|
Dis
cussion
P
a
per
|
Discussion
P
a
per
|
Discussio
n
P
a
per
|
At the coastal site TF the positive net effect of solar radiation on RGM and Hgpwas observed in spring and summer, respectively, indicating that the solar radiation driven production processes for the two forms of mercury became predominant in different seasons. In the marine boundary layer at AI, the positive effect of solar radiation on
both RGM and Hgp appeared to be dominant in the 12:00–18:00 UTC time quadrant,
5
which was reduced by removal processes in the 18:00–00:00 UTC time quadrant. This is consistent with the monthly averaged diurnal variation of RGM (not shown) where the mixing ratio exhibited a steady increase over 12:00–15:00 UTC and leveled offafter that as rates of loss and production became comparable.
Also, compared to TF more factors can affect RGM production in the marine
environ-10
ment at AI in addition to solar radiation, including halogen radical concentrations and sea salt aerosol concentrations. The seasonal and diurnal variabilities in these factors may not be synchronized and thus different combinations of factors may weigh in on their influences on RGM production at different times. Halogen radical concentrations are dependent on solar radiation, which is indirectly supported by observed
halocar-15
bons reaching annual minimum in summer due to faster photodissociation (Zhou et al., 2008) conducive to higher levels of halogen radical concentrations. This may explain why the effect of solar radiation on RGM was observed in both spring and summer at AI.
3.3 Temperature
20
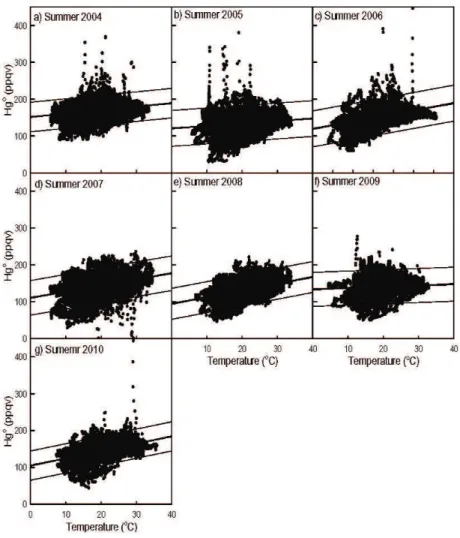
Examination of seasonal data of Hgoversus temperature at TF indicated a scattered, correlative relationship between Hgo and temperature in all summers during the time period of 2004–2010 (Fig. 7) whereas no correlation appeared to exist in other seasons (not shown). Ther2value varied over the range of 0.12–0.20 with slope values over 0.7–2.0 ppqv/◦C at the 95 % confidence interval. At PM the Hgo versus temperature
25
ACPD
11, 28395–28443, 2011Part 2: Relationships with atmospheric physical parameters
H. Mao et al.
Title Page
Abstract Introduction
Conclusions References
Tables Figures
◭ ◮
◭ ◮
Back Close
Full Screen / Esc
Printer-friendly Version Interactive Discussion
Discussion
P
a
per
|
Dis
cussion
P
a
per
|
Discussion
P
a
per
|
Discussio
n
P
a
per
|
of r2=0.2 and a 1.2 ppqv/◦C slope value at the 95 % confidence interval, and this correlation was not reproduced in the following winter.
In summary these relationships suggested a somewhat positive correlation between Hgo and temperature in spring at a remote rural location situated above the boundary layer half of the time and in summer at a sea level coastal site, whereas no such
5
correlation was found at a site in the marine boundary layer. The positive correlation at the former two sites was reproducible during the study period of 4–7 yr with slightly varying correlation coefficients and slope values, which indicates the consistency of the relationship. Our previous study found significant correlation between Hgo and temperature averaged at each hour of a day over the seasons of spring and fall 2007
10
at TF and AI (Sigler et al., 2009a), and speculated that higher Hgo may be attributed to thermally and/or photochemically mediated release from soil (e.g., Poissant and Casimir, 1998; Sigler and Lee, 2006). No consistent Hgo-temperature correlation in the marine boundary layer during the warm season seems to support this speculation. The box plot of RGM versus temperature at TF, PM, and AI suggested higher levels
15
of RGM, be it the 25th percentile, median, or 75th percentile value, at warmer tem-peratures during the warm season (i.e., spring and summer) and this tendency was enhanced for daytime data (Fig. 9, PM not shown). At TF, in spring the majority of RGM mixing ratios>2 ppqv occurred at temperature >9◦C, and 10 % of the daytime data in the highest temperature bin (>18◦C) had mixing ratios >5 ppqv (Fig. 9a). In
20
summer, daytime data for temperatures<21◦C had median levels below the LOD, and the median showed a distinct increase from around the LOD over the temperature bin 21–24◦C to 0.3 ppqv for temperatures >27◦C (Fig. 9b). Wintertime data showed no discernible pattern; in the fall, median values were below the LOD in all temperature bins except the highest one (>18◦C) where it barely reached the LOD.
25
Similar to TF, larger RGM levels corresponded to higher temperatures in the marine boundary layer based on measurements at AI, and this relationship was enhanced in daytime data (Fig. 9c, d). In fall, only in the highest temperature bin (>16◦C)
ACPD
11, 28395–28443, 2011Part 2: Relationships with atmospheric physical parameters
H. Mao et al.
Title Page
Abstract Introduction
Conclusions References
Tables Figures
◭ ◮
◭ ◮
Back Close
Full Screen / Esc
Printer-friendly Version Interactive Discussion
Discussion
P
a
per
|
Dis
cussion
P
a
per
|
Discussion
P
a
per
|
Discussio
n
P
a
per
|
pattern in the 75th percentile value (not shown). One unique feature at AI was that in winter higher median values (0.2–0.3 ppqv) were found in the temperature bins −6–0◦C while hovering around the LOD in temperature bins below −6◦C or above 0◦C (Fig. 9e). This pattern was slightly enhanced in the daytime and lessened at night. Close examination revealed that 68 % of the wintertime RGM samples below
5
the LOD corresponded to temperatures below −6◦C or above 0◦C and were
col-lected in February 2010, which was ranked as the 104th warmest and 104th wettest February in New Hampshire based on the 116 yr of record running from 1895 to 2010 (http://www.nrcc.cornell.edu/page summaries.html). This implies that more RGM was possibly washed out by more precipitation in a warm winter season such as 2010.
10
More wintertime data in the future is needed to verify this hypothesis.
At PM the median and even the 75th percentile values rarely exceeded the LOD and thus the box plot of RGM vs. temperature at PM is not shown. However, there were two exceptions: (1) in spring the median barely reached the LOD and the 75th percentile values rose to 0.3–0.4 ppqv as temperature went beyond 8◦C, and (2) in winter the 75th
15
percentile value varied over 0.1–0.2 ppqv in all temperature bins with an increasing tendency at warmer temperatures. Since PM is situated above the boundary layer, i.e., in the free troposphere, half of the time and hundreds of kilometers downwind of major source regions, measurements from this site capture variability in RGM in the free troposphere over rural areas. The seasonal variability described here suggests
20
that in the midlatitude free troposphere without direct influence of major anthropogenic sources: (1) RGM mixing ratios were mostly below the LOD, (2) when exceeding the LOD the mixing ratios exhibited a tendency of higher levels at warmer temperature. These inferences lead us to speculate that lesser scavenging in winter possibly led to detectable 75th percentile values, and production dominating over loss processes
25
resulted in an annual maximum in spring.
Relationships between Hgp and temperature were examined for TF and AI where
measurements were available. At TF total measurement data showed two
ACPD
11, 28395–28443, 2011Part 2: Relationships with atmospheric physical parameters
H. Mao et al.
Title Page
Abstract Introduction
Conclusions References
Tables Figures
◭ ◮
◭ ◮
Back Close
Full Screen / Esc
Printer-friendly Version Interactive Discussion
Discussion
P
a
per
|
Dis
cussion
P
a
per
|
Discussion
P
a
per
|
Discussio
n
P
a
per
|
temperatures below and above 8◦C, respectively (Fig. 10a). Similar to RGM, Hgp ex-hibited an increasing tendency with warming temperatures in spring and summer, es-pecially during daytime at TF (Fig. 10b, c), which was consistently evidenced in the tendency of nearly all of the median, 75th, and 90th percentile values. The magni-tude of such tendency was an increase of ∼0.3 ppqv from the lower to upper end of
5
temperature range (about 15◦C di
fference). In winter the tendency was reversed with the highest median and 75th values corresponding to the lower temperatures (<-6◦C) (Fig. 10d), and this tendency was enhanced in the nighttime data. The decrease in median and 75th percentile values was around 0.7 ppqv from<−8◦C to>2◦C of tem-perature. In the fall, the median and 75th percentile values over all temperature bins
10
hovered around the LOD except at the upper end of the temperature range (>17◦C) with Hgpreaching 0.3–0.4 ppqv (not shown) which occurred mostly close in time to the warm season.
At AI there was only one month data for the winter season during the study period, and thus the Hgpversus temperature relationship for all data largely represents the
re-15
lationship in spring, summer and fall. Temperature ranged from<6◦C to>21◦C, much narrower than at TF, due in part to the buffered marine climate. Perhaps because of the missing wintertime data, there is only one pattern showing in all metrics, which is that the 10th, 25th, median, 75th, and 90th percentile values increased with warming temperature (Fig. 11a). This tendency was enhanced in spring and summer (Fig. 11b,
20
c). In the fall, the median values exceeded the LOD at temperatures<10◦C and tem-peratures>16◦C; the latter was primarily close in time to the warm season (Fig. 11d).
The positive relationship between Hgp and temperature in warmer seasons
pos-sibly reflects the effect of solar radiation on Hg cycling, i.e., stronger solar radiation conducive to more radicals with subsequent impact on Hgo oxidation leading to more
25
RGM and subsequently more Hgpin the coastal and marine environments. Needless
ACPD
11, 28395–28443, 2011Part 2: Relationships with atmospheric physical parameters
H. Mao et al.
Title Page
Abstract Introduction
Conclusions References
Tables Figures
◭ ◮
◭ ◮
Back Close
Full Screen / Esc
Printer-friendly Version Interactive Discussion
Discussion
P
a
per
|
Dis
cussion
P
a
per
|
Discussion
P
a
per
|
Discussio
n
P
a
per
|
mechanisms that drive variation in them than a direct link. This hypothesis is in fact supported by the relationship between RGM (Hgp) and radiation flux under no precipi-tation conditions at TF as well as between RGM (Hgp) andjNO2at AI as described in the previous subsection.
3.4 Relative humidity
5
No overall well-defined relationships were observed between Hgoand relative humidity at TF, PM, and AI for all seasons. Two points are noted. First, at TF, in summer and fall there were very low levels of Hgo, reaching as low as 40–50 ppqv corresponding to 95– 100 % relative humidity, which occurred on nights with nocturnal inversions. Second, in summer at AI there appeared to a linear upper boundary enveloping the data, which
10
was reproduced in the three summers (2007, 2008, and 2010) with available relative humidity data (Fig. 12a, b, c).
A close examination of the upper boundary in the summertime data at AI revealed that nearly all samples were collected in the month of August during those three sum-mers. Specifically, August data comprised 93 % of the data forming the upper
bound-15
ary, and these data points did not suggest preferential time quadrants of the day. Cor-responding to these data points, there was a vague anti-correlation between Hgoand temperature as well as between temperature and relative humidity (Fig. 12d, e, f, g). In the meantime no systematic patterns were observed between Hgo and jNO2, as well as betweenjNO2and temperature. It indicates that solar radiation may not be the
20
dominant driving force for the linear relationship between Hgo and relative humidity in August; it may result from the dominance of thermal processes in the marine boundary layer during that time of a year. Future research is warranted to understand the driving mechanism for this curious linearity in August.
Relationships between RGM and relative humidity at TF suggested a clear
decreas-25
ACPD
11, 28395–28443, 2011Part 2: Relationships with atmospheric physical parameters
H. Mao et al.
Title Page
Abstract Introduction
Conclusions References
Tables Figures
◭ ◮
◭ ◮
Back Close
Full Screen / Esc
Printer-friendly Version Interactive Discussion
Discussion
P
a
per
|
Dis
cussion
P
a
per
|
Discussion
P
a
per
|
Discussio
n
P
a
per
|
values were nearly 2 and 4 ppqv respectively for relative humidity<40 %, followed by a steep decrease over the 50–60 % range and a continuous decrease to a median level below the LOD over the 90–100 % range. Similar patterns were found in all other seasons. At PM, only in spring and winter for relative humidity below 60 % the median level of RGM exceeded the LOD (not shown).
5
The largest difference in RGM versus relative humidity at AI (Fig. 13f–j) compared to TF and PM was less variability of the metrics, except the 90th percentile value, over all bins of relative humidity. Specifically, in the overall relationship (Fig. 13f) the 25th, median, and 75th percentile values varied over a narrow range of 0.17–0.36 ppqv except the 90–100 % bin where the median was below the LOD. Another difference
10
was the highest levels of RGM, represented in metrics, were observed in summer for relative humidity<50 % compared to the highest levels of RGM occurring in spring at TF.
The one-to-one plots of RGM versus relative humidity at TF suggested a better de-fined negative correlation in spring and summer (r2=0.25 and 0.30 respectively) than
15
in fall and winter (Fig. 14). Since at night humidity reaches>90 % most of the time and removal of RGM and Hgpis rapid, we will consider the relationship for daytime only (i.e., 12:00–23:59 UTC) and no precipitation. Fifteen percent of the total 1336 samples dur-ing the four sprdur-ings exceeded 2 ppqv which corresponded to relative humidity<60 %. In the four summers, 20 % the total 1395 samples exceeded 0.5 ppqv corresponding to
20
relative humidity varying over 40 %–100 % with the largest under drier conditions grad-ually decreasing to wetter conditions. Overall, it is not straightforward to link directly the cause of higher RGM to lower relative humidity, because in both seasons over 90 % of those higher RGM samples were measured in the time window of 14:00–24:00 UTC, which is the time period of lower relative humidity, stronger solar radiation, and daily
25
maximum RGM production.
ACPD
11, 28395–28443, 2011Part 2: Relationships with atmospheric physical parameters
H. Mao et al.
Title Page
Abstract Introduction
Conclusions References
Tables Figures
◭ ◮
◭ ◮
Back Close
Full Screen / Esc
Printer-friendly Version Interactive Discussion
Discussion
P
a
per
|
Dis
cussion
P
a
per
|
Discussion
P
a
per
|
Discussio
n
P
a
per
|
In springs 2008–2010, with constraints of daytime and no precipitation, about 10 % of the total 542 points showed RGM mixing ratios exceeding 2 ppqv, which were observed from 14:00–23:59 UTC and corresponded to relative humidity<70 %. With the same constraints, in summers 2007, 2008, and 2010 (relative humidity measurements miss-ing in summer 2009) a total of 48 data points were found with mixmiss-ing ratios>2 ppqv
5
and∼90 % of them (42 out of 48) in the time window of 12:00–14:00 UT. Higher RGM mixing ratios were observed at all levels of relative humidity ranging from 40 %–100 %. These results suggest that in the marine environment the RGM production rate in sum-mer dominated over the dependence of loss rate on humidity yielding a rather even spread of higher levels of RGM over the spectrum of relative humidity.
10
There seems to be no relationship between relative humidity and Hgp mixing ratios for all seasons at AI. At TF a correlation was observed for summers 2009 and 2010 withr2=0.38 and 0.29 respectively and slope values of−0.006–−0.007 ppqv Hgpper 1 % relative humidity (not shown). The reason for this relationship is unclear.
3.5 Precipitation
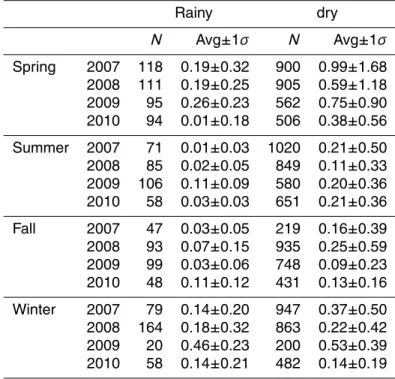
15
Effects of precipitation on RGM and Hgp were examined for all seasons at TF and AI. The seasonal averages (±1σ) for RGM at TF under rainy and dry conditions are summarized in Table 1. Note that precipitation data are not available at PM, and thus PM is not considered. In the four summers of 2007–2010, the average levels of RGM under dry conditions varied from 0.1 to 0.2 ppqv, whereas those under rainy
condi-20
tions were nearly all below the LOD. During springs of 2007–2010 seasonal averages under rainy conditions varied around 0.2 ppqv and those under dry conditions were a factor of 3–4 to two orders of magnitude higher, suggesting that the RGM production rate dominated over the washout effect of precipitation in spring. In winters of 2007– 2010, only snowfalls were considered, and three-hourly accumulated precipitation from
25
ACPD
11, 28395–28443, 2011Part 2: Relationships with atmospheric physical parameters
H. Mao et al.
Title Page
Abstract Introduction
Conclusions References
Tables Figures
◭ ◮
◭ ◮
Back Close
Full Screen / Esc
Printer-friendly Version Interactive Discussion
Discussion
P
a
per
|
Dis
cussion
P
a
per
|
Discussion
P
a
per
|
Discussio
n
P
a
per
|
less scavenging efficiency from snow compared to liquid precipitation. This is consis-tent with the findings of Lombard et al. (2011) in that both the total seasonal Hg wet deposition and volume-weighted Hg concentration in rain water reached the annual minimum in winter during their three year sample collection at TF.
Further examination of RGM at TF separated the data into three subsets: days
with-5
out rain (i.e., dry), with nighttime rain, and with daytime rain. Diurnal cycles were averaged seasonally each year for each subset (Fig. 15). Five main characteristics are summarized here. First, the diurnal cycle on dry days was well-defined with minimum values before sunrise and peaks over 15:00–17:00 UTC, and the annual maximum daily amplitude (daily maximum–minimum) occurred in spring varying from 0.8 ppqv in
10
2010 to 1.8 ppqv in 2007. Second, in contrast to the dry days, the diurnal variation was dampened greatly on days with nighttime rain, e.g. a daily amplitude of 0.3 ppqv in spring 2010 and 0.7 ppqv in spring 2007, and there was little to no variability on days with daytime rain. In other words, even if it rained before sunrise and it was dry during the daytime, the daily peak did not go back to the levels of dry days. This suggests that
15
RGM in the residual layer was washed out at night leading to less contribution to the surface level of RGM via downward mixing from aloft after sunrise. Third, for springtime dry days, the daytime RGM mixing ratios were the largest of all seasons and under all conditions with discernible year-to-year fluctuations in the daily maximum, varying from 1 ppqv in spring 2010 to 2.3 ppqv in spring 2007. Fourth, for dry days the magnitude
20
and pattern of diurnal variation appeared to be similar between summer and fall, al-though there seemed to be larger year-to-year variability in daytime RGM levels in the fall. Fifth, nighttime RGM levels in winter, be it dry or wet, were lower than those in spring but higher than in summer and fall.
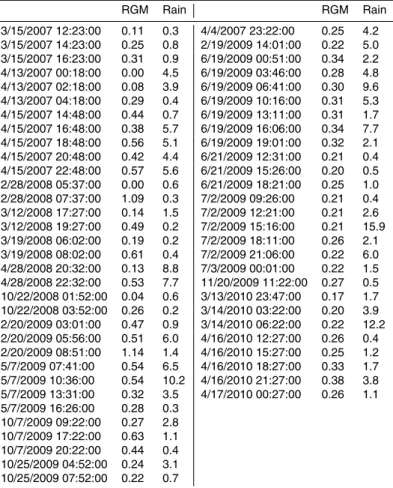
Closer examination of changes in RGM at the onset of and during rainfalls in summer
25
ACPD
11, 28395–28443, 2011Part 2: Relationships with atmospheric physical parameters
H. Mao et al.
Title Page
Abstract Introduction
Conclusions References
Tables Figures
◭ ◮
◭ ◮
Back Close
Full Screen / Esc
Printer-friendly Version Interactive Discussion
Discussion
P
a
per
|
Dis
cussion
P
a
per
|
Discussion
P
a
per
|
Discussio
n
P
a
per
|
consistently hovering at levels above the LOD (Table 2). These exceptions were cases in which the RGM source strengths (e.g., in situ production and transport) apparently overpowered its removal, which is different from the findings of Yatavelli et al. (2006) and Laurier et al. (2007) who observed that RGM was invariably washed out by precip-itation in the continental and marine boundary layers.
5
Diurnal and seasonal variability in Hgp at TF appeared to be smaller than that of RGM at TF in the three subsets of data (Fig. 16). On dry days, the magnitude of Hgpvariability in spring was close to that in winter, with both hovering around 0.5 ppqv compared to mostly below 0.5 ppqv in summer and fall. The diurnal variability and patterns on days with night- and daytime rain did not differ from those on dry days as
10
much as RGM, meaning Hgpwas rarely washed out entirely by precipitation and most
samples remained above the LOD. A few sample points of Hgp below the LOD were
found during snowfalls: (1) when a snowfall started at night and lasted throughout the night, or (2) when rain preceded the snowfall, and likely reduced the Hgpmixing ratio substantially before the snow began.
15
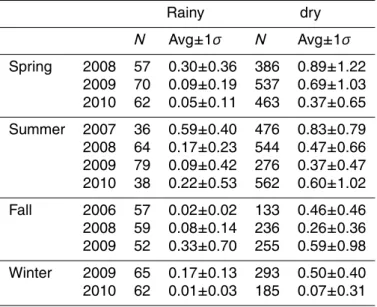
It should be noted that the time resolution of the precipitation data used for AI is different from TF, because the National Weather Service monitoring site at the Pease Airport, which is the site closest to AI with available precipitation data, reported 6-hourly precipitation data. To match that, we integrated RGM over the 6-h interval. Without hourly precipitation data it is impossible to examine in detail the effects of precipitation
20
on RGM; therefore, we can only report the general features observed in the 6-hourly averaged data. At AI under dry conditions, seasonally averaged mixing ratios remained well above the LOD in all seasons with remarkable year-to-year variability (Table 3). For example, in spring the average was lowest in 2010 at 0.37 ppqv and highest in 2008 at 0.89 ppqv, and in fall the lowest average was found to be 0.26 ppqv in 2008 and highest
25
0.59 ppqv in 2009.
ACPD
11, 28395–28443, 2011Part 2: Relationships with atmospheric physical parameters
H. Mao et al.
Title Page
Abstract Introduction
Conclusions References
Tables Figures
◭ ◮
◭ ◮
Back Close
Full Screen / Esc
Printer-friendly Version Interactive Discussion
Discussion
P
a
per
|
Dis
cussion
P
a
per
|
Discussion
P
a
per
|
Discussio
n
P
a
per
|
lowering RGM levels throughout the day except in winter when nighttime precipitation suppressed mixing ratios only during the nighttime and conversely daytime precipita-tion only lowered the daytime mixing ratios. Summer 2007 and fall 2009 appeared to be quite different with much higher mixing ratios on days with night- or daytime precip-itation. A closer look revealed that the RGM mixing ratio was only slightly decreased
5
by precipitation events in summer 2007, and in fall 2009 there were∼10 days over 21 October–1 November when particularly strong precipitation events were accompanied by unusually high levels of RGM. A preliminary examination of limited chemical trac-ers (only CO and O3 were available) and trajectories did not suggest any particularly dominant mechanisms driving the unusual behavior in RGM during those two seasons
10
(Mao et al., 2011b).
There were three distinct characteristics of the impacts of precipitation on Hgpat AI: (1) seasonal averaged mixing ratios hovered around the LOD under rainy conditions in all seasons, (2) highest seasonal averaged levels under dry condition occurred in fall and summer and lowest in winter, and (3) compared to RGM, there appeared to be
15
smaller variability in seasonal average levels for both rainy and dry conditions (Table 4). The three subsets of Hgp data, i.e., dry, with nighttime rain, and with daytime rain, suggested that occurrence of rain, be it at night or during the day, had negligible impact on the magnitude and pattern of diurnal variation of Hgpat AI in all seasons (Fig. 18). Moreover, there was little variability in the four seasons under the three conditions,
20
except in fall 2009 which was a unique case.
Talbot et al. (2011) found that ∼90 % of the Hgp was contained in aerosols with aerodynamic diameters>2 micrometer (µm) at AI and TF in summer, in winter it shifted almost entirely to the fine fraction (<1 µm) below 0.5 µm with little detectable in the coarse sizes, and in spring, there was a mixture of fine and coarse fractions. They also
25
ACPD
11, 28395–28443, 2011Part 2: Relationships with atmospheric physical parameters
H. Mao et al.
Title Page
Abstract Introduction
Conclusions References
Tables Figures
◭ ◮
◭ ◮
Back Close
Full Screen / Esc
Printer-friendly Version Interactive Discussion
Discussion
P
a
per
|
Dis
cussion
P
a
per
|
Discussion
P
a
per
|
Discussio
n
P
a
per
|
of Tekran 1135 is warranted before we can further study the causes for the observed seasonal difference in the effect of precipitation or any other climate variables on Hgp.
4 Summary
In this study, we present a comprehensive analysis of relationships that Hgo, RGM, and Hgp bore with climate variables in inland elevated rural, coastal, and marine
environ-5
ments using 3–7 yr of continuous data sets of high temporal resolution. This extensive analysis of long term measurement data suggested great complexity in the climate im-pact on ambient levels of speciated mercury. More specifically, there did not appear to be simple and direct linkage between Hgo/RGM/Hgp and any physical variables; positive or negative effects were indicated by the trends in Hgo/RGM/Hgp mixing
ra-10
tios corresponding to varying climatic conditions. A few key points on such trends are summarized as follows.
– The impact of wind speed on ambient mixing ratios of Hgo in all three environ-ments was best captured during an occurrence of a strong cyclonic system in November 2008 when winds exceeded 15 m s−1at AI, in agreement with our case 15
study of the April 2007 Nor’easter in Sigler et al. (2009b). The RGM and Hgp me-dian, 75th, and 90th percentile values decreased with increasing wind speed in the marine environment indicating enhanced loss through deposition associated with strong winds in the marine boundary layer. At the coastal site RGM mix-ing ratios were lowest under calm conditions (wind speed<1 m s−1) and highest
20
at southerly and southeasterly winds>2 m s−1suggesting that transport was the
primary source of RGM to our study location.
ACPD
11, 28395–28443, 2011Part 2: Relationships with atmospheric physical parameters
H. Mao et al.
Title Page
Abstract Introduction
Conclusions References
Tables Figures
◭ ◮
◭ ◮
Back Close
Full Screen / Esc
Printer-friendly Version Interactive Discussion
Discussion
P
a
per
|
Dis
cussion
P
a
per
|
Discussion
P
a
per
|
Discussio
n
P
a
per
|
– The best point-to-point correlation was found between Hgo and temperature in summer at the coastal location and spring at the inland elevated rural site. No correlation was found in the marine boundary layer. This supports the specula-tion from our previous study on thermally and/or photochemically mediated re-lease of Hgo from soil. RGM and Hgp at all sites were positively correlated with
5
temperature in spring, summer, and fall.
– Relationships between RGM and relative humidity in the coastal area suggested a clear decreasing tendency in all metrics, including 10th, 25th, median, 75th, and 90th percentile values, from less than 40 % to 100 % relative humidity levels in all seasons especially in spring. No relationship between relative humidity and Hgp
10
mixing ratios was observed for all seasons in the marine boundary layer, whereas at the coastal location correlation was observed for summers.
– The effect of precipitation on RGM at the coastal and marine locations was similar. RGM levels remained around 0.2 ppqv under rainy conditions and a factor of 3–4 to two orders of magnitude higher under dry conditions in spring. In winter RGM
15
mixing ratios appeared to be mostly above LOD during snowfalls at 0.14±0.20, 0.18±0.33, 0.45±0.23, and 0.14±0.21 ppqv for the 2007–2010 winters at TF, suggesting less scavenging efficiency of snow. Hgp did not seem to be washed out entirely by precipitation as RGM would be most of the time; most samples remained above the LOD. Precipitation had negligible impact on the magnitude
20
and pattern of diurnal variation of Hgpat the marine site AI in all seasons.
Many questions from this study remain to be addressed, e.g., quantifying strong wind induced oceanic evasion, mechanisms driving the positive correlations between mer-cury and temperature/solar radiation, and less impact of relative humidity and precipi-tation on Hgp than on RGM. In addition, longer continuous measurement data of Hgo,
25
ACPD
11, 28395–28443, 2011Part 2: Relationships with atmospheric physical parameters
H. Mao et al.
Title Page
Abstract Introduction
Conclusions References
Tables Figures
◭ ◮
◭ ◮
Back Close
Full Screen / Esc
Printer-friendly Version Interactive Discussion
Discussion
P
a
per
|
Dis
cussion
P
a
per
|
Discussion
P
a
per
|
Discussio
n
P
a
per
|
Acknowledgements. Funding for this work is provided by the National Science Foundation under grant# ATM0837833, the National Oceanic and Atmospheric Administration AIRMAP program under grant# NA07OAR4600514, and the Environmental Protection Agency under contract #EP09H000355. We thank Cheryl Parker and Kevan Carpenter for their technical as-sistance. We thank J. Sigler for his work on initiating and maintaining RGM measurement at
5
AIRMAP sites.
References
Aucott, M. L., Caldarelli, A. D., Zsolway, R. R., Pietarinen, C. B., and England, R.: Ambient el-emental, reactive gaseous, and particle-bound mercury concentrations in New Jersey, U.S.: measurements and association with wind direction, Environ. Monit. Assess., 158, 295–306,
10
2009.
Baya, A. P. and Van Heyst, B.: Assessing the trends and effects of environmental parameters on the behaviour of mercury in the lower atmosphere over cropped land over four seasons, Atmos. Chem. Phys., 10, 8617–8628, doi:10.5194/acp-10-8617-2010, 2010.
Brooks, S., Luke, W., Cohen, M., Kelly, P., Lefer, B., and Rappengl ¨uck, B.: Mercury species
15
measured atop the Moody Tower TRAMP site, Houston, Texas, Atmos. Envrion., 44, 4045– 4055, 2010.
Castillo, A., Valdes, J., Sibaja, J., Vega, I., Alfaro, R., Morales, J., Esquivel, G., Barrantes, E., Black, P., and Lean, D.: Seasonal and diel patterns of total gaseous mercury concentration in the atmosphere of the Central Valley of Costa Rica, Appl. Geochem., 26, 242–248, 2011.
20
Cobbetta, F. D., Steffen, A., Lawson, G., and Van Heyst, B. J.: GEM fluxes and atmospheric mercury concentrations (GEM, RGM and Hgp) in the Canadian Arctic at Alert, Nunavut, Canada (February–June 2005), Atmos. Environ., 41, 6527–6543, 2007.
Cole, A. S. and Steffen, A.: Trends in long-term gaseous mercury observations in the Arctic and effects of temperature and other atmospheric conditions, Atmos. Chem. Phys., 10, 4661–
25
4672, doi:10.5194/acp-10-4661-2010, 2010.
Feddersen, D., Talbot, R., and Mao, H.: Size distribution of particulate mercury in marine and continental atmospheres, Atmosphere, in preparation, 2011.
G ˚ardfeldt, K., Sommar, J., Ferrara, R., Ceccarini, C., Lanzilotta, E., Munthe, J., Wangberg, I., Lindqvist, O., Pirrone, N., Sprovieri, P., and Pesenti, E.: Evasion of mercury from Atlantic
ACPD
11, 28395–28443, 2011Part 2: Relationships with atmospheric physical parameters
H. Mao et al.
Title Page
Abstract Introduction
Conclusions References
Tables Figures
◭ ◮
◭ ◮
Back Close
Full Screen / Esc
Printer-friendly Version Interactive Discussion
Discussion
P
a
per
|
Dis
cussion
P
a
per
|
Discussion
P
a
per
|
Discussio
n
P
a
per
|
coastal water and the Mediterranean sea, coastal and open water, Atmos. Environ., 37, Suppl. 1, 73–84, 2003.
Gabriel, M. C., Williamson, D. G., Brooks, S., and Lindberg, S.: Atmospheric speciation of mercury in two contrasting Southeastern US airsheds, Atmos. Environ., 39, 4947–4958, 2005.
5
Han, Y.-J., Holsen, T. M., Lai, S.-O., Hopke, P. K., Yi, S.-M., Liu, W., Pagano, J., Falanga, L., Milligan, M., and Andolina, C.: Atmospheric gaseous mercury concentrations in New York State: relationships with meteorological data and other pollutants, Atmos. Environ., 38, 6431–6446, 2004.
Jacob, D. and Winner, D. A.: Effect of climate change on air quality, Atmos. Environ., 43, 51–63,
10
2009.
Kim, S. Y., Talbot, R., and Mao, H.: Cycling of Gaseous Elemental Mercury: Importance of Water Vapor, Geophys. Res. Lett., submitted, 2011.
Kock, H. H., Bieber, E., Ebinghaus, R., Spain, T. G., and Thees, B.: Comparison of long-term trends and seasonal variations of atmospheric mercury concentrations at the two European
15
coastal monitoring stations Mace Head, Ireland, and Zingst, Germany, Atmos. Environ., 39, 7549–7556, 2005.
Laurier, F. and Mason, R.: Mercury concentration and speciation in the coastal and open ocean boundary layer, J. Geophys. Res., 112, D06302, doi:10.1029/2006JD007320, 2007.
Laurier, F. J. G., Mason, R. P., and Whalin, L.: Reactive gaseous mercury formation in the North
20
Pacific Ocean’s marine boundary layer: A potential role of halogen chemistry, J. Geophys. Res., 108, 4529, doi:10.1029/2003JD003625, 2003.
Li, Z., Xia, C., Wang, X., Xiang, Y., and Xie, Z.: Total gaseous mercury in Pearl River Delta region, China during 2008 winter period, Atmos. Environ., 45, 834–838, 2011.
Lombard, M. A. S., Bryce, J. G., Mao, H., and Talbot, R.: Mercury deposition in
South-25
ern New Hampshire, 20062009, Atmos. Chem. Phys., 11, 7657–7668, doi:10.5194/acp-11-7657-2011, 2011.
Mao, H. and Talbot, R.: O3and CO in New England: Temporal variations and relationships, J. Geophys. Res., 109, D21304, doi:10.1029/2004JD004913, 2004a.
Mao, H. and Talbot, R.: The role of meteorological processes in two New
Eng-30
land ozone episodes during summer 2001, J. Geophys. Res., 109, D20305,
doi:10.1029/2004JD004850, 2004b.
ACPD
11, 28395–28443, 2011Part 2: Relationships with atmospheric physical parameters
H. Mao et al.
Title Page
Abstract Introduction
Conclusions References
Tables Figures
◭ ◮
◭ ◮
Back Close
Full Screen / Esc
Printer-friendly Version Interactive Discussion
Discussion
P
a
per
|
Dis
cussion
P
a
per
|
Discussion
P
a
per
|
Discussio
n
P
a
per
|
– Part 1: Temporal Variability, Atmos. Chem. Phys. Discuss., submitted, 2011a.
Mao, H., Talbot, R., et al.: Speciated Mercury at Marine, Coastal, and Inland Sites in New England – Part 3: Relationships with Key Trace Gases, to be submitted to Atmos. Chem. Phys. Discuss., 2011b.
Mao, H., Talbot, R. W., Sigler, J. M., Sive, B. C., and Hegarty, J. D.: Seasonal and diurnal
5
variations of Hg◦ over New England, Atmos. Chem. Phys., 8, 1403–1421,
doi:10.5194/acp-8-1403-2008, 2008.
Mason, R. P. and Sheu, G.-R.: Role of the ocean in the global mercury cycle, Global Bio. Cycles, 16, 1093, doi:10.1029/2001GB001440, 2002.
Obrist, D., Tas, E., Peleg, M., Matveev, V., Fa¨ın, X., Asaf, D., and Luria, M.:
Bromine-10
induced oxidation of mercury in the mid-latitude atmosphere, Nature Geosci., 4, 22–26, doi:10.1038/NGEO1018, 2011.
Pacyna, E. G., Pacyna, J. M., Steenhuisen, F., and Wilson, S.: Global
an-thropogenic mercury emission inventory for 2000, Atmos. Environ., 40, 4048, doi:10.1016/j.atmosenv.2006.03.041, 2006.
15
Poissant, L., Pilote, M., Xu, X., Zhang, H., and Beauvais, C.: Atmospheric mercury speci-ation and deposition in the Bay St. Franc¸ois wetlands, J. Geophys. Res., 109, D11301, doi:1029/2003JD004364, 2004.
Poissant, L., Pilote, M., Xu, X., Beauvais, C., Constant, P., and Zhang, H., A year of continuous measurements of three atmospheric mercury species in southern Quebec, Canada, Atmos.
20
Environ., 39, 1275–1287, 2005.
Sigler, J. M., Mao, H., and Talbot, R.: Gaseous elemental and reactive mercury in Southern New Hampshire, Atmos. Chem. Phys., 9, 1929–1942, doi:10.5194/acp-9-1929-2009, 2009a. Sigler, J. M., Mao, H., Sive, B. C., and Talbot, R.: Oceanic influence on atmospheric mercury
at coastal and inland sites: a springtime noreaster in New England, Atmos. Chem. Phys., 9,
25
4023–4030, doi:10.5194/acp-9-4023-2009, 2009b.
Sprovieri, F., Pirrone, N., Ebinghaus, R., Kock, H., and Dommergue, A.: A review of worldwide atmospheric mercury measurements, Atmos. Chem. Phys., 10, 8245–8265, doi:10.5194/acp-10-8245-2010, 2010.
Stamenkovic, J., Lyman, S., and Gustin, M. S.: Seasonal and diel variation of atmospheric
30
mercury concentrations in the Reno (Nevada, USA) airshed, Atmos. Environ., 41, 6662– 6672, 2007.
ACPD
11, 28395–28443, 2011Part 2: Relationships with atmospheric physical parameters
H. Mao et al.
Title Page
Abstract Introduction
Conclusions References
Tables Figures
◭ ◮
◭ ◮
Back Close
Full Screen / Esc
Printer-friendly Version Interactive Discussion
Discussion
P
a
per
|
Dis
cussion
P
a
per
|
Discussion
P
a
per
|
Discussio
n
P
a
per
|
trace gases in New England, J. Geophys. Res., 110, D09307, doi:10.1029/2004JD005449, 2005.
Talbot, R., Mao, H., Feddersen, D., Smith, M., Kim, S. Y., Sive, B., Haase, K., Ambrose, J., Zhou, Y., and Russo, R.: Comparison of particulate mercury measured with manual and automated methods, Atmosphere, 2, 1–20, doi:10.3390/atmos2010001, 2011.
5
Yatavelli, R. L. N., Fahrni, J. K., Kim, M., Crist, K. C., Vickers, C. D., Winter, S. E., and Connell, D. P.: Mercury, PM2.5 and gaseous co-pollutants in the Ohio River Valley region: Preliminary results from the Athens supersite, Atmos. Environ., 40, 6650–6665, 2006.
Zhou, Y., Mao, H., Russo, R. S., Blake, D. R., Wingenter, O. W., Haase, K. B., Varner, R. K., Talbot, R., and Sive, B. C.: Bromoform and dibromomethane measurements in
10