Applications of simulation technique on debris-flow hazard zone
delineation: a case study in Hualien County, Taiwan
S. M. Hsu1, L. B. Chiou2, G. F. Lin2, C. H. Chao1, H. Y. Wen1, and C. Y. Ku3
1Geotechnical Engineering Research Center, Sinotech Engineering Consultants, Inc., Taipei, Taiwan 2Department of Civil engineering, National Taiwan University, Taipei, Taiwan
3Department of Harbour and River Engineering, National Taiwan Ocean University, Keelung, Taiwan
Received: 23 October 2009 – Revised: 12 February 2010 – Accepted: 16 February 2010 – Published: 23 March 2010
Abstract. Debris flows pose severe hazards to communities in mountainous areas, often resulting in the loss of life and property. Helping debris-flow-prone communities delineate potential hazard zones provides local authorities with use-ful information for developing emergency plans and disaster management policies. In 2003, the Soil and Water Conser-vation Bureau of Taiwan proposed an empirical model to de-lineate hazard zones for all creeks (1420 in total) with poten-tial of debris flows and utilized the model to help establish a hazard prevention system. However, the model does not fully consider hydrologic and physiographical conditions for a given creek in simulation. The objective of this study is to propose new approaches that can improve hazard zone de-lineation accuracy and simulate hazard zones in response to different rainfall intensity. In this study, a two-dimensional commercial model FLO-2D, physically based and taking into account the momentum and energy conservation of flow, was used to simulate debris-flow inundated areas.
Sensitivity analysis with the model was conducted to de-termine the main influence parameters which affect debris flow simulation. Results indicate that the roughness coef-ficient, yield stress and volumetric sediment concentration dominate the computed results. To improve accuracy of the model, the study examined the performance of the rainfall-runoff model of FLO-2D as compared with that of the HSPF (Hydrological Simulation Program Fortran) model, and then the proper values of the significant parameters were eval-uated through the calibration process. Results reveal that the HSPF model has a better performance than the FLO-2D model at peak flow and flow recession period, and the vol-umetric sediment concentration and yield stress can be esti-mated by the channel slope. The validation of the model for
Correspondence to: S. M. Hsu ([email protected])
simulating debris-flow hazard zones has been confirmed by a comparison of field evidence from historical debris-flow dis-aster data. The model can successfully replicate the influence zone of the debris-flow disaster event with an acceptable er-ror and demonstrate a better result than the empirical model adopted by the Soil and Water Conservation Bureau of Tai-wan.
1 Introduction
Occasional rainfall, steep relief and sufficient debris-flow materials are three major components triggering debris-flow events in a potential debris-flow torrent. Since the topo-graphic, geologic and hydrologic characteristics of Taiwan correspond to the components of debris-flow occurrence, Taiwan is frequently beset by debris flow problems during ty-phoons and heavy rainfall. These fast-moving flows accom-panied by mud and rock are capable of destroying houses and lives, washing out roads and bridges, or obstructing streams and roadways. To mitigate and manage hazards induced by debris flows, it is necessary to simulate the debris-flow route and deposition process. This simulation outcome is very im-portant for determining a possible affected area, which is an essential element for producing hazard maps (Petrascheck and Kienholz, 2003).
536 S. M. Hsu et al.: Simulation technique on debris-flow hazard zone delineation
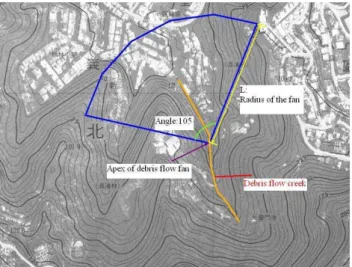
Fig. 1. Debris flow fan delineated by Iketani and Uehera equation.
and thickness, Lin et al. (2004) developed a reliability based methodology for the delineation of debris-flow deposition ar-eas. At the same time, many authors (O’Brien et al., 1993; Han and Wang, 1996; Laigle and Coussot, 1997; Ming and Fread, 1999; Cetina, 2000; Takahashi, 2001; Sosio et al., 2007) utilized dynamic approaches to develop various nu-merical models for the simulation of debris flows based on different rheological models. By comparing both methods, the advantage of empirical-statistical methods is easy to uti-lize, but can only to be applied to certain conditions. Dy-namic approaches are physically based and take into account the momentum and energy conservation of flow. Thus, they usually produce better results than empirical-statistical meth-ods. Nevertheless, a major difficulty in developing dynamic models for a potential hazard area prediction is the choice of the appropriate model parameters.
An empirical method initiated by Iketani and Ue-hara (1980) for identifying the debris-flow hazard zones was adopted by the Soil and Water Conservation Bureau (SWCB) of Taiwan. This empirical method consists of certain rules, as well as an empirical equation, which is a function of the debris-flow volume and the slope angle below the apex of a debris-flow fan (CSWCS, 2003). The procedure for de-termining the depositional extent of a debris flow is to firstly assign the location of debris-flow fan apex, which is the high-est point where flow is last confined and then spreads out as sheetflood, debris slurries, or in multiple channels along un-certain paths, such as the mouth of the valley or downstream of the topographic apex. Subsequently, the debris-flow fan is drawn from the apex point with a radius of the fan and 105 degree of angle as shown in Fig. 1, in which the radius L is given as the following equation:
log(L)=0.42·log(V·tanθ )+0.935 (1)
Lis named as the depositional length as well;θis the slope
angle at the downstream of a potential debris-flow creek;V
is the debris-flow volume (V is determined by the empiri-cal equationV=70.992A0.61;Ais the area of a debris-flow watershed, km2). Equation (1) shows that the depositional length, which is derived from a fully empirical approach, depends on the slope angle and the area of watershed and does not vary with rainfall intensity. However, the delin-eating zone for each potential debris-flow torrent is often underestimated or overestimated because of a comparison made with data from aerial photos of historical debris-flow disaster events. In order to improve the accuracy of the em-pirical model for predicting debris-flow hazard zones, it is necessary to establish a model which can simulate hazard zones under different rainfall intensities to maintain a reli-able level.
In this study, a two-dimensional commercial model FLO-2D (O’Brien et al., 2006), which is physically based and takes into account the momentum and energy conser-vation of flows, was used to predict areas potentially en-dangered by debris flows for downstream guarded areas of potential debris-flow creeks. Sensitivity analysis with the model was conducted to determine the main influential pa-rameters which affect debris-flow simulation. To improve the accuracy of the model, the study examined the perfor-mance of the rainfall-runoff model of FLO-2D as compared with that of the HSPF (Hydrological Simulation Program-Fortran) model, and then the proper values of the signifi-cant parameters were evaluated with the calibration process. Other parameters used in the model were retrieved from the literature and field investigations. The validation of the pro-posed model for simulating debris-flow hazard zones was confirmed by a comparison of field evidence from historical debris-flow disaster data.
2 The study area
The study area was located in Hualien County, on the eastern coast of Taiwan, as shown in Fig. 2. Hualien County faces the immense Pacific Ocean to the east and leans against the grand Central Mountain Range in the west. The area is on the boundary of the Philippine and Eurasian Plates. Because the plates collide, the county has plenty of metamorphic rock. Because of strong erosion, the sea terraces, river terraces, alluvial fans, meanders and a river valley basin can be easily found in this area.
Fig. 2. Location of study area and distribution of potential
debris-flow creeks in Hualien County.
debris flows and flood disasters prevail in the region during typhoon season. Figure 2 shows the distribution of potential debris-flow creeks in Hualien County. Out of 1503 potential debris-flow creeks in Taiwan, the county contains 162 creeks spread throughout 13 towns. In the past, debris flows oc-curred in some of the potentially debris-flow-prone creeks, especially in the villages of Tonmeng, Dasing, Fongyi and Jiancing and which resulted in casualties and serious prop-erty damage. Figure 3 shows a devastating debris-flow calamity caused by Typhoon Toaji in 2001 which occurred in Dashing village. The typhoon brought heavy rainfall with the maximum rainfall intensity of about 101 mm/h and a 3-day accumulated rainfall of about 922 mm/h, triggering landslides that produced a large amount of slope material which transformed into debris flows. According to the of-ficial disaster statistics issued by the Hualien office of the SWCB, the event produced approximately 150 million m3of rock and debris that flowed down to guarded areas and killed 43 people, as well as buried 150 houses. It is these types of calamities that make the study of debris flows an urgent and challenging task in the region.
Fig. 3. Debris flow disaster caused by Typhoon Toaji occurring on
28 July 2001 in Dashing village.
3 Methods
The location and size of an affected area induced by de-bris flow in a potential dede-bris-flow creek usually depend on hydrologic and physiographical conditions of the creek. A more suitable model to predict the debris-flow hazard zone should be dynamic and should take into account these con-ditions. The method used and developed in this study was intended for improving drawbacks and limitations of the em-pirical method adopted by the SWCB of Taiwan. The study proposes a new debris-flow hazard zone delineation proce-dure to enhance the accuracy of the current method.
3.1 Numerical model
538 S. M. Hsu et al.: Simulation technique on debris-flow hazard zone delineation can describe the continuum of flow regimes from viscous to
turbulent/dispersive flow (O’Brien et al., 1993). This model can avoid the modelling problem of not knowing the flow regime in advance (Cetina et al., 2006).
FLO-2D has been successfully used for practical cases of debris flow simulations by many researchers (Julien and O’Brien, 1997; Garcia and Lopez, 2005; Lin et al., 2005; Cetina et al., 2006). O’Brien et al. (2006) also reported that FLO-2D has been applied in a list of countries including the United States, Italy, Switzerland, Austria, Mexico, Ecuador, Venezuela, South Korea, Taiwan and Thailand. Due to its acceptable applicability, the FLO-2D model is on FEMA’s (Federal Emergency Management Agency, USA) list of ap-proved hydraulic models for both riverine and overland flow (alluvial fan) flood studies. The SWCB of Taiwan has ap-proved the model for debris flow study as well. Thus, the present paper chose the model to serve the purpose of this study.
The FLO-2D model is a two-dimensional flood routing model that can simulate flows over complex topographies and roughness on urbanized alluvial fans. Hyperconcen-trated sediment flows, such as mudflows and the transition from water flows to fully developed mud and debris flows, can be simulated as well.
FLO-2D routes a flood hydrograph using the full dynamic wave momentum equation to accurately predict the area of inundation. The fluid viscous and yield stress terms are accounted for in the model for hyperconcentrated sediment flows. The basic equations used in the model include the continuity equation ∂h ∂t + ∂hu ∂x + ∂hv
∂y =i (2)
and the two-dimensional equations of motion
Sfx=Sox− ∂h ∂x− u g ∂u ∂x− v g ∂u ∂y− 1 g ∂u ∂t (3)
Sfy=Soy− ∂h ∂y− v g ∂v ∂y− u g ∂v ∂x− 1 g ∂v ∂t (4)
in whichh= flow depth; uandv= depth-averaged velocity components along x- and y-coordinates; i= excess rainfall intensity; Sfx andSfy= friction slope components along
x-and y-coordinates;SoxandSoy= bed slope components along
x- and y-coordinates; andg= gravity acceleration. The total friction slope can be expressed as
Sf=Sy+Sv+Std= τy
γmh
+ Kηw
8γmh2
+n
2w2
h4/3 (5)
in whichSy= yield slope;Sv= viscous slope;Std=
turbulent-dispersive slope;γm= specific weight of the sediment
mix-ture; K= resistance parameter; η= viscosity; τy= yield
stress; w= depth-averaged velocity. Equation (5) evaluates rheological behaviour of hyperconcentrated sediment flows.
θ 0 500 1000 1500 2000 2500 3000 3500 4000
2001/7/29 00:00 2001/7/30 00:00 2001/7/31 00:00 Time(hr) Q( cms ) 0 50 100 150 200 250 300 rain fa ll( mm /h r) Rainfall Observed Q HPSF Model Q Flo-2D Model Q
Fig. 4. Comparisons of recorded, FLO-2D and HSPF hydrographs
at Wanlishi bridge streamflow station during Typhoon Toaji.
In addition, the yield stressτyand the viscosityηvary
prin-cipally with sediment concentration, and can be expressed in empirical relationships as
τy=α1eβ1C (6)
η=α2eβ2C (7)
in which C= volumetric sediment concentration; αi and
βi= empirical coefficients defined by laboratory experiment. Data required for the model simulation include a digital terrain model, channel geometry, estimates of channel and floodplain roughness, inflow flood hydrographs or rainfall and rheological properties of the sediment water mixture. For the rheological properties, the volumetric sediment con-centration and yield stress are not easy to measure from a field investigation, especially since 162 potential debris-flow creeks exist in Hualien County Selecting representative val-ues for the above parameters for each debris-flow creek is critical. They can help characterise debris-flow on alluvial fans in a range of varied environments.
(a)
(b)
(c)
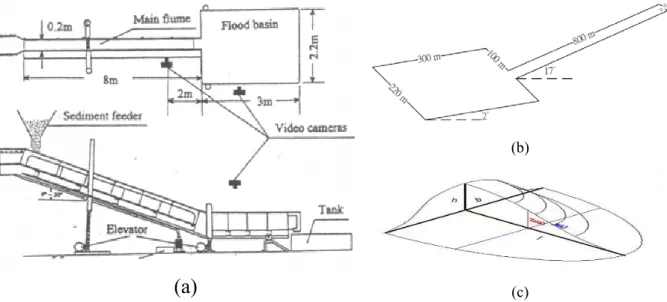
Fig. 5. (a) Schematic of numerical flume from both top and side views; (b) flume dimension and gradients at upstream and downstream of
the flume; (c) Schematic of the maximum depositional depth (h), maximum depositional length (l) and maximum depositional width (b) in the deposition area.
Table 1. Model sensitivity to various parameters.
Parameter Basic Range h−hbasic/ hbasic l−lbasic/ lbasic b−bbasic/bbasic
case (%) (%) (%)
τy(Pa) 1500 800∼3000 –46%∼36% 48%∼–39% 13%∼–13%
η(Pa-s) 10 0.1∼30 –2%∼1% –0.01%∼0.01% –0.01%∼0.01%
Gs 2.65 2.00∼3.00 8%∼-6% –19%∼5% –12%∼6%
n 0.2 0.01∼0.40 –15%∼8% 5%∼–33% 0.01%∼–24%
Cv 0.5 0.30∼0.70 –19%∼115% –33%∼47% –29%∼29%
K 1000 100∼10 000 –2%∼2% –0.01%∼0.01% –0.01%∼0.01%
Note: the last three columns show differences from the basic case in percent.
3.2 Sensitivity analysis
The purpose of performing a sensitivity study is to determine the main influence parameters which affect debris-flow sim-ulation. For these parameters, adopted values in simulation should be carefully calibrated in order to ensure accurate re-sults. A numerical regular flume, as shown in Fig. 5, was used as a tool to study sensitivity of various parameters used in the FLO-2D model. The study tested computational vari-ations by comparing the maximum depositional depth (h), maximum depositional length (l) and maximum depositional width (b) from a basic case for six parameters, including: yield stress, dynamic viscosity, specific gravity, roughness coefficientn, volumetric sediment concentration and the re-sistance parameter for laminar flow. The study chose a set of parameters as a basic case, as shown in Table 1, to proceed with the parametric study. The influence of various
param-eters is summarized in Table 1. It was found that the yield stress, roughness coefficientnand volumetric sediment con-centration have a relatively large influence on the simulated results as compared with other testing parameters. The re-sult is identical to that of other researches (Lin et al., 2005; Arattano et al., 2006; Sosio et al., 2007).
3.3 Determination of rheological parameters of debris flow
540=(ρ −ρρ)( φθ− θ) S. M. Hsu et al.: Simulation technique on debris-flow hazard zone delineation
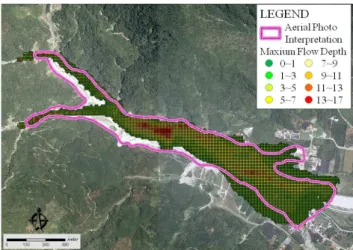
Fig. 6. Comparison of debris-flow affected area from aerial photo
interpretation and model simulation in the Haulien 061 creek in Dasing village.
(ρ ρ )( φ θ)
θ ρ
− − =
Fig. 7. Comparison of debris-flow affected area from aerial photo
interpretation and model simulation in the Haulien 069 creek in Jiancing village.
The volumetric sediment concentration (Cv) is defined as
the volume of sediment divided by volume of water plus sediment. By introducing Takahashi’s equilibrium concen-tration formula (Takahashi, 1980), the volumetric sediment concentration can be estimated by the equilibrium concentra-tion (CD) divided by the volume concentration of solid
frac-tion on the bed (Cb), in whichCbcan be estimated from the
porosity of solid fraction on the bed; andCDis given as the
following equation,
CD=
ρwtanθ (ρs−ρw)(tanφ−tanθ )
(8) whereθis the inclined angle of the channel bed andφis the internal friction of debris;ρs andρw are densities of solids
Fig. 8. Comparison of debris-flow affected area from aerial photo
interpretation and model simulation in the Haulien A112 creek in Fongyi village.
and water, respectively. Since the equilibrium concentration is dependent on the bed inclination, the volumetric sediment concentration in a given potential debris-flow creek is a func-tion of the channel slope.
For the determination of yield stress, the study utilized real cases to calibrate the variable by means of back anal-yses to fit the field evidence from historical debris-flow dis-aster data. The calibration was made using data from the past debris-flow events, which occurred in three debris-flow-prone creeks (Hualien 061, Hualien 069, and Hualien A112, respectively) in Hualien County during the Typhoon Toraji (July 2001). Parameters used in the model calibration were retrieved from the literature and field investigations (Sinotech, 2007). By adjusting values of the yield stress in the model to fit the observed hazard zone, Figs. 6, 7 and 8 show comparison results of debris-flow affected ar-eas from aerial photo interpretation and model simulation in the creeks Haulien 061, Hualien 069 and Haulien A112, respectively. The solid polygon in three figures represents debris-flow influenced areas delineated from aerial photos. The calibration results indicate the error between simulated and observed is within 10% with the check of influenced ar-eas and 20% with the check of overlapped area referred to the area of polygon.
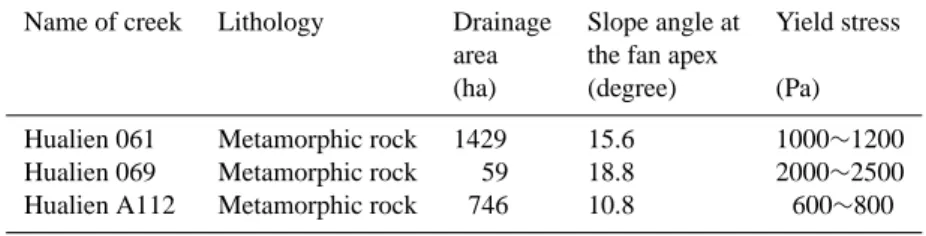
Hualien 061 Metamorphic rock 1429 15.6 1000∼1200
Hualien 069 Metamorphic rock 59 18.8 2000∼2500
Hualien A112 Metamorphic rock 746 10.8 600∼800
significantly. Based on the outcome, the results suggest that the relationship between the yield stress and the slope angle can be classified into three different categories, as shown in Table 3. The table is beneficial to the selection of the yield stress in modelling a debris-flow hazard zone with different slope angles for creeks with metamorphic rock.
3.4 Simulation procedure of debris flow
Since the impact of debris flow often threatens the down-stream area where the debris starts to deposit, the deposition and propagation of debris flow in the deposition area are the main interest in this paper. Some assumptions such as homo-geneous fluid, non-erodible bed, and constant rheology along the channel and in time were made in the simulation. The procedure for determining the depositional extent of debris flow is given as follows:
1. Assign the location of debris-flow fan apex based on the highest point where the flow was last confined, then spread out as sheetflood, debris slurries, or in multi-ple channels along paths that are uncertain, such as the mouth of valley or downstream of the topographic apex. The location of fan apex for a given debris-flow-prone creek can be obtained from field investigation.
2. Prepare input data which can be grouped into the cat-egories of geometry, hydrology and sediment. Geo-metric data include DEMs of watersheds with a res-olution of 5 m by 5 m, channel and floodplain rough-ness coefficientnvalues which can be referred to from the FLO-2D user’s manual (O’Brien et al., 2006) and other data such as channel geometry. Hydrologic data include rainfall data and input data for the used rainfall-runoff model (herein, HSPF). Sediment data include yield stress, dynamic viscosity, specific gravity, volu-metric sediment concentration and resistance parameter
Kfor laminar flow.
3. Produce an inflow hydrograph for a simulated water-shed using the HSPF rainfall-runoff model. In addi-tion, hydrological analysis, including rainfall frequency analysis and design storms, can be done in this step.
Table 3. Relationship between yield stress and bed slope.
Slope angle at Suggested the fan apex yield stress
(degree) (Pa)
>16 2500
12∼16 1200
<12 800
The results can be used to simulate a debris flow for ex-treme events in the future if needed.
4. Determining the debris flow hydrograph by the bulk-ing factor and resultbulk-ing inflow hydrograph. The bulkbulk-ing factor (BF=1/(1-Cv)) can be calculated by assigning the
volumetric sediment concentration, which can be deter-mined by Eq. (8) and the value ofCb.
5. Proceed with debris-flow simulation by assigning all other required input data and the resulting debris flow hydrograph. From this, the inundated area of debris flow can be obtained. Based on the result, the poten-tial debris-flow hazard zone for a study creek can be delineated.
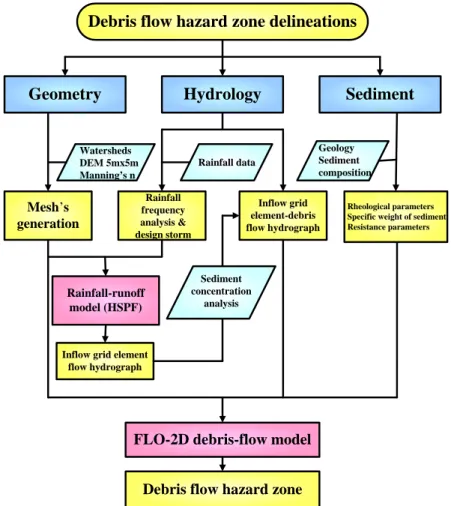
A flowchart showing the steps for simulation of debris flow using the FLO-2D model can be found in Fig. 9.
4 Model validation
4.1 Debris-flow event description
542 S. M. Hsu et al.: Simulation technique on debris-flow hazard zone delineation
Geometry
Mesh’s generation
Hydrology
Sediment
Inflow grid element-debris flow hydrograph
Rainfall-runoff model (HSPF)
Inflow grid element flow hydrograph
FLO-2D debris-flow model
Debris flow hazard zone
Debris flow hazard zone delineations
Rainfall data Watersheds
DEM 5mx5m Manning’s n
Geology Sediment composition
Rheological parameters Specific weight of sediment Resistance parameters
Rainfall frequency analysis & design storm
Sediment concentration
analysis
Fig. 9. Flowchart for simulation of debris flow using FLO-2D.
resulted in loss of lives and property. In Hualien County, debris flows occurred in the Hualien A124 creek located in Dama Village and Hualien 072 creek located in Shuhu Vil-lage, leading to heavy debris deposits around the outlet of debris-flow creeks. Figures 10 and 11 show the photos be-fore and after Typhoon Fenghung in the Hualien A124 creek and in the Hualien 072 creek, respectively. The after photos were taken one week after the typhoon. One notable dif-ference that occurred after the event was that the riverbed became wider and deeper. The elevation of the riverbed in-duced by debris deposits caused damage to property and the cross section of an existing bridge.
4.2 Numerical simulation and model verification To verify the accuracy of the presented model, we replicated the debris-flow hazard zones caused by Typhoon Fenghung of the Hualien 124 and Hualien 072 creeks. The proposed numerical model as described in previous sections was ap-plied to simulate the debris-flow hazard zones. The volu-metric sediment concentration and yield stress for the two creeks were determined by Eq. (8) and Table 3, respectively.
Other parameters used in the model were obtained from the in situ investigation. Rainfall data for Hualien A124 and Hualien 072 were collected from the rainfall records of the Taian and Shilin Rainfall Stations during the Fenghung Ty-phoon, respectively.
Before After
Before After
Fig. 10. Before and after photos of Typhoon Fenghung in the
Hualien A124 creek.
Before After
Before After
Fig. 11. Before and after photos of Typhoon Fenghung in the
Hualien 072 creek.
Because of the lack of observable data on sediment yields and flow depths and velocities, the study compared only in-undated areas of debris flow between observed and simulated results for the model verification. The model verification re-sults for the case of Haulien A124 indicated the error be-tween simulated and observed was 9.09%, with the check of influenced areas and 13.40%, with the check of the over-lapped area referred to in the area of aerial photos interpre-tation. The presented method can successfully replicate the influential zone of the debris-flow disaster event with an er-ror of less than 15%. The model verification results for the case of Haulien 072 indicated the error between simulated and observed was 9.17% with the check of influenced areas and 28.27%, with the check of the overlapped area referred
Fig. 12. Comparison of debris-flow hazard zone predicted by
SWCB method and presented method for the case of Hualien A124.
Fig. 13. Comparison of debris-flow hazard zone predicted by
SWCB method and presented method for the case of Hualien 072.
544 S. M. Hsu et al.: Simulation technique on debris-flow hazard zone delineation 5 Conclusions
The increased frequency with which debris and hyper-concentrated flows occur, and the impact they have both on the environment and human life, merit close attention. This paper presents a numerical simulation using the FLO-2D model to predict areas potentially endangered by debris flows in Hualien County, Taiwan. The main conclusions which can be drawn from this study are as follows:
1. The modelling procedures using FLO-2D for delin-eation of risk areas induced by debris flow were estab-lished. The model verification results indicate that the FLO-2D model can successfully replicate the influence zone of the past debris-flow event with an acceptable error and demonstrate a better result than the empirical model adopted by the Soil and Water Conservation Bu-reau of Taiwan.
2. This study introduced the HSPF model to produce an inflow hydrograph from a watershed and compared its results with that of the FLO-2D rainfall-runoff model. The result shows the HSPF model has a better perfor-mance than the FLO-2D model at peak flow and flow recession periods. Thus, the HSPF model can be incor-porated into the FLO-2D model to enhance the accuracy of debris flow simulation.
3. The sensitivity analysis shows that the parameters for the yield stress, roughness coefficientnand volumetric sediment concentration have significant effects on the simulation results. For those parameters, proper values should carefully be given in debris-flow simulation in order to maintain a reliable computational result. 4. The calibration results for the yield stress from the three
case studies indicate that this parameter tends to in-crease with the gradient of the debris flow fan apex. However, the rule can only be applied to creeks with lithology of metamorphic rocks. Further case studies are needed to verify the finding.
5. This verified model appeared to be capable of predict-ing and delineatpredict-ing potentially hazardous zones approx-imately associated with debris flows for a selected fre-quency design flood event, which would be very helpful in understanding the extent of debris flow inundation in extreme climatic events, as well as developing emer-gency plans and disaster management policies.
Acknowledgements. The study was supported by a grant from the
Hualien Office of Soil and Water Conservation Bureau, the Council of Agriculture and the Executive Yuan, Taiwan. The authors would also like to acknowledge all the individuals who participated in the field data collections and investigation of debris flows associated with the Typhoon Fenghung.
Edited by: M. Arattano
Reviewed by: B. Zanuttigh and another anonymous referee
References
Arattano, M., Franzi, L., and Marchi, L.: Influence of rheology on debris-flow simulation, Nat. Hazards Earth Syst. Sci., 6, 519– 528, 2006,
http://www.nat-hazards-earth-syst-sci.net/6/519/2006/.
Cetina, M.: Two-dimensional modelling of free surface flow, Acta hydrotechnica, University of Ljubljana, 18(29), 23–27, 2000. Cetina, M., Rajar, R., Hojnik, T., Zakrajsek, M., Krzyk, M., and
Mikos, M.: Case study: numerical simulations of debris flow be-low Stoze, Slovenia, J. Hydraul. Eng.-ASCE, 132(2), 121–130, 2006.
CSWCS (Chinese Soil and Water Conservation Society): Technical manual for soil and water conservation, Chinese Soil and Water Conservation Society, Taipei, Taiwan, 2003.
Garcia, R. and Lopez, J. L.: Debris flows on December 1999 in Venezuela, in: Chapter 20 of Debris-flow Hazards and Related Phenomena, edited by: Jakob, M. and Hungr, O., Springer Verlag Praxis, Berlin, 2005.
Han, G. and Wang, D.: Numerical modelling of Anhui debris flow, J. Hydraul. Eng.-ASCE, 122(5), 262–265, 1996.
Iketani, H. and Uehara, S.: Study on sediment control and preven-tion, Sedimentation Prevenpreven-tion, 114, 37–44, 1980.
Johanson, R. C., Imhoff, J. D., and Davis Jr., H. H.: Users man-ual for hydrological simulation program – Fortran (HSPF), Envi-ronmental Research Laboratory, EPA-600/9-80-015, Athens, Ga, 1980.
Julien, P. Y. and O’Brien, J. S.: Selected notes on debris flow dy-namics, Recent developments on debris flows, Lecture note in earth sciences, Springer, Berlin, 144–162, 1997.
Laigle, D. and Coussot, P.: Numerical modelling of mudflows, J. Hydraul. Eng., 123(7), 617–623, 1997.
Lin, G. F., Chen, L. H., and Lai, J. N.: Reliability-based delineation of debris-flow deposition areas, Nat. Hazards, 32(3), 395–412, 2004.
Lin, M.-L., Wang, K.-L., and Huang, J.-J.: Debris flow run off simu-lation and verification – case study of Chen-You-Lan Watershed, Taiwan, Nat. Hazards Earth Syst. Sci., 5, 439–445, 2005, http://www.nat-hazards-earth-syst-sci.net/5/439/2005/.
Ming, J. and Fread, D. L.: Modeling of mud/debris unsteady flows, J. Hydraul. Eng.-ASCE, 125(8), 827–834, 1999.
O’Brien, J. S., Julien, P. Y., and Fullerton, W. T.: Two-dimensional water flood and mudflow simulation, J. Hydraul. Eng.-ASCE, 119(2), 244–261, 1993.
O’Brien, J. D.: FLO-2D user’s manual, Version 2006.01, FLO En-gineering, Nutrioso, 2006.
Petrascheck, A. and Kienholz, H.: Hazard assessment and mapping of mountain risks in Switzerland, in: Debris-flow Hazards Miti-gation: Mechanics, Prediction, and Assessment, Proceedings 3rd International DFHM Conference, Davos, Switzerland, edited by: Rickenmann, D. and Chen, C.-L., Millpress, Rotterdam, 25–38, 2003.
Rickenmann, D., Laigle, D., Lamberti, A., Zanuttigh, B., Armanini, A., Fraccarollo, L., Giuliani, M., Rosati, G., McArdell, B. W., Ng, D., Swartz, M., and Graf, C.: Evaluation of existing numer-ical simulation models for debris flow, Report on work package 3 of the research project THARMIT of the European Union, EU Contract EVG1-CT-1999-00012, EU, Brussels, 2003.
Shieh, C. L. and Tsai, Y. F.: Experimental study on the configu-ration of debris-flow fan, in: Proceedings of the First Interna-tional Conference on Debris-flow Hazards Mitigation: Mechan-ics, Prediction and Assessment, San Francisco, California, 133– 142, 1997.
logical testing and numerical modelling of a debris-flow event, Earth Surf. Proc. Land., 32, 290–306, 2007.
Takahashi, T.: Debris Flow, A.A. Balkema Publishers, Rotterdam, Netherlands, 1991.