www.clim-past.net/3/155/2007/
© Author(s) 2007. This work is licensed under a Creative Commons License.
of the Past
Change in ice rheology during climate variations – implications for
ice flow modelling and dating of the EPICA Dome C core
G. Durand1, F. Gillet-Chaulet2, A. Svensson1, O. Gagliardini2, S. Kipfstuhl3, J. Meyssonnier2, F. Parrenin2, P. Duval2, and D. Dahl-Jensen1
1Niels Bohr Institute, University of Copenhagen, Copenhagen, Denmark
2Laboratoire de Glaciologie et de G´eophysique de l’Environnement, Saint Martin d’H`eres, France 3Alfred Wegener Institute, Bremerhaven, Germany
Received: 1 November 2006 – Published in Clim. Past Discuss.: 20 November 2006 Revised: 13 February 2007 – Accepted: 5 March 2007 – Published: 19 March 2007
Abstract. The study of the distribution of crystallographic orientations (i.e., the fabric) along ice cores provides infor-mation on past and current ice flow in ice-sheets. Besides the usually observed formation of a vertical single maximum fabric, the EPICA Dome C ice core (EDC) shows an abrupt and unexpected strengthening of its fabric during termina-tion II around 1750 m depth. Such strengthening has already been observed for sites located on an ice-sheet flank. This suggests that horizontal shear could occur along the EDC core. Moreover, the change in the fabric leads to a modi-fication of the effective viscosity between neighbouring ice layers. Through the use of an anisotropic ice flow model, we quantify the change in effective viscosity and investigate its implication for ice flow and dating.
1 Introduction
Ice core studies have yielded a large set of paleoclimatic data for the last few hundred thousand years. They record cli-mate signals such as temperature, as well as forcing factors such as greenhouse gas concentrations (EPICA Community Members, 2004; North Greenland Ice Core Project members, 2004). Since absolute dating techniques for deep Antarctic ice cores are not available so far, climatic interpretations of ice core records are deeply dependent on the accuracy of ice flow models to relate the depth of ice to its age. Thus, a better understanding of ice rheology is at the root of ice core dating improvement.
Ice is an aggregate of crystals with hexagonal structure (ice Ih). The orientation of each crystal can be specified by its
caxis, which is orthogonal to the basal planes. Deforma-tion occurs mainly by dislocaDeforma-tion glide along basal planes which leads to an outstanding anisotropy of the ice
crys-Correspondence to:G. Durand ([email protected])
tal (Duval et al., 1983). Due to this anisotropy, c-axes ro-tate during deformation towards the direction of compression and away from the tensional direction (Azuma and Higashi, 1985; Van der Veen and Whillans, 1994). The c-axes dis-tribution (referred to as fabric in what follows) is a conse-quence of the strain-rate history experienced by ice during its journey from the ice sheet surface (Alley, 1988). How-ever, three recrystallization processes are believed to occur in ice-sheets, and their effect on the polycrystal cannot be neglected (Alley, 1992). Normal grain growth, driven by the decrease of the total grain boundary energy within the material leads to a linear increase of the mean grain area with time. A few hundred meters below the surface, different parts of a grain can experience different stresses, leading to the organization of dislocations into walls (polygonization) and ultimately to the splitting of the grain into new smaller grains. This mechanism, known asrotation recrystallization
is believed to slow down fabric strengthening under uni-axial compression (Castelnau et al., 1996a). Finally, for the very bottom part of ice-sheets, where temperature is higher than roughly –10◦C, nucleation of new grains is associated with a rapid migration of grain boundaries. With thismigration re-crystallizationprocess, the orientation of grains reflects the stress state which can vary very rapidly near the bedrock (Thorsteinsson et al., 2003). In this last case, fabric no longer reflects the strain history of the considered ice layer.
Fig. 1. Measured parameters from the EPICA Dome C ice core between 1500 and 2000 m. (a)Deuterium (‰) evolution averaged over 3.85 m sections and(b)dust concentration (µg.kg−1), sam-pled every 5.5 m (EPICA Community Members, 2004). (c)Mean crystal radius measured every 11 m, error bars correspond to 1σ
variability. (d)Eigenvalues of the second order orientation tensor:
a1(2)black symbols,a2(2)gray symbols,a(32)light gray symbols. Er-ror bars correspond to 1σ variability. Note the break in the vertical axis.a(i2)andhRihave been measured on the same thin sections.
New measurements of the texture (i.e., fabric and grain boundaries network) have been made along the EPICA Dome C (EDC) ice core across Marine Isotope Stages (MIS) 5 and 6 (from 1500 to 2000 m depth) and are presented in Sect. 2. A discontinuous evolution of the fabric is observed within this interval, as a strong and significant strengthening of the fabric appears during Termination II. Such a
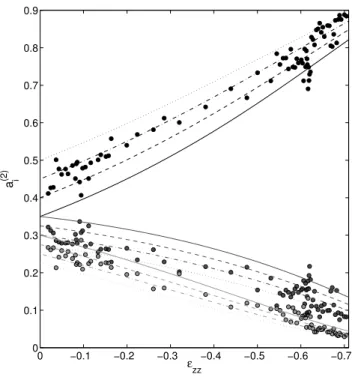
strength-Fig. 2. (a)Evolution of depth as a function of the cumulative strain
ǫzz, along the EDC (red lines), DF (Blue line) and GRIP (black line) cores. This corresponds to the thinning function as calculated by the current dating models (Parrenin, 2006??; Parrenin et al., 2006??; Johnsen and Dansgaard, 1992).(b)Evolution ofa(12)as a function ofǫzzexperienced by the considered layer for the EDC (red circles),
DF (open blue circles) and GRIP cores (open black circles). Arrows point out some specific Marine Isotope Stages (MIS) along the DF core (Watanabe et al., 1999).
ening has already been reported for sites located on a flank but is unexpected for a dome (Paterson, 1991). A local higher order anisotropic ice flow model briefly described in Section 3 attempts to explain the possible origins of the observed fab-ric heterogeneities (Sect. 4) as well as their implications for the ice flow and dating (Sect. 5).
2 Measurements
2.1 New measurements of texture along EDC
evolution has already been observed along the GRIP (Green-land, Thorsteinsson et al. (1997)) and Dome F (DF, Antarc-tica, Azuma et al. (1999)) cores. Such single-maximum for-mation is characteristic of uni-axial compression which is the main deformation mechanism at a dome (Alley, 1988).
Fig. 1 shows the evolution of measured parameters (deu-terium and dust content) along EDC within the interval 1500–2000 m. Note that our plots will be described with in-creasing depth, i.e., backwards in time. New vertical (par-allel to the core axis) thin sections sampled every 11 m be-tween 1500 and 2000 m have been prepared using standard procedures, and fabrics as well as microstructures (i.e. the grain boundaries network) have been measured using an Au-tomatic Ice Texture Analyzer. As suggested by Woodcock (1977), the essential features of an orientation distribution can be characterize through the use of the second-order ori-entation tensora(2)defined as:
a(2)= Ng
X
k=1
fkck⊗ck, (1)
whereck is the c-axis orientation of the grain k andfk is the corresponding volume fraction of the grain. By con-struction,a(2)is symmetric and there exists a symmetry ref-erence frame, in which a(2) is diagonal. ai(2) (i=1,2,3), arranged in decreasing order, denote the three correspond-ing eigenvalues. As examples, a random fabric will have
a1(2)∼a2(2)∼a(32)∼1/3, whereas a strong single maximum fab-ric presents 1>a(12)>>a2(2)∼a(32)∼0+ǫ>0. The mean grain (crystal) radiushRiand the three eigenvaluesai(2)(i=1,2,3)
are also presented in Fig. 1. Details on the calculation ofhRi
anda(2)can be found in Durand et al. (2006a).
In relation to an increased aridity of surrounding conti-nents and a more intense atmospheric transport, cold periods in Antarctica are characterized by much greater dust fallout compared to interglacials (see Fig. 1a) (EPICA Community Members, 2004). A high content of insoluble impurities de-creases the grain growth rate owing to the pinning of grain boundaries by dust particles. This pinning effect can quan-titatively explain the concomitant decrease ofhRi with the climatic transition MIS5-MIS6 (see Fig. 1b) (Durand et al., 2006b). In phase with the decrease ofhRi,a(12)significantly increases (see Fig. 1c). All together, we observe a sharp change of the texture at termination II: smaller crystals and strengthened fabrics in glacial ice with respect to interglacial ice. Note that such a change has not been observed for Ter-mination I. It is also worth mentioning that a significant de-crease ofa(12) is observed below 1680 m and a 60 m thick layer presents less concentrated fabrics than the surrounding layers (see Fig. 1). This layer corresponds to the maximum of stadial 5.5.
2.2 Comparison with GRIP and DF
In what follows, we will compare the present results with those of the GRIP and DF cores. The glaciological contexts at the drilling sites are summarized in Table 1. According to Castelnau et al. (1996b) if ice is only submitted to uni-axial compression the strain-induced fabric is only a function of the cumulative strainǫzz related to the thinning function as ǫzz=thinning−1. On Fig. 2,a(12)measured along EDC has been plotted as a function ofǫzz. The evolution along EDC is compared to those of the DF and GRIP cores also plotted as a function of their respectiveǫzz. The cumulative strain for each core is deduced from the thinning function as calcu-lated by the current dating models (Parrenin, 2007; Parrenin et al., 2007; Johnsen and Dansgaard, 1992). As a conse-quence of higher strain-rate at GRIP, rotation recrystalliza-tion is more effective and counteracts normal grain growth (Thorsteinsson et al., 1997). Indeed, recrystallization rates have been estimated for GRIP and EDC and expressed as the time needed to subdivide a grain into two parts : 2000 years for GRIP (Castelnau et al., 1996b) and 12 000 years for EDC (Durand et al., 2006b). Despite the fact that recrystallization rates are different between these two sites, the overall agree-ment between the data-sets shown on Fig. 2 indicates that the fabric still reflects the cumulative strain. Note however that, below EDC termination II (ǫzz<−0.63) and for a given strain, GRIP and DF fabrics fit nicely, whereas EDC fabrics are slightly more clustered.
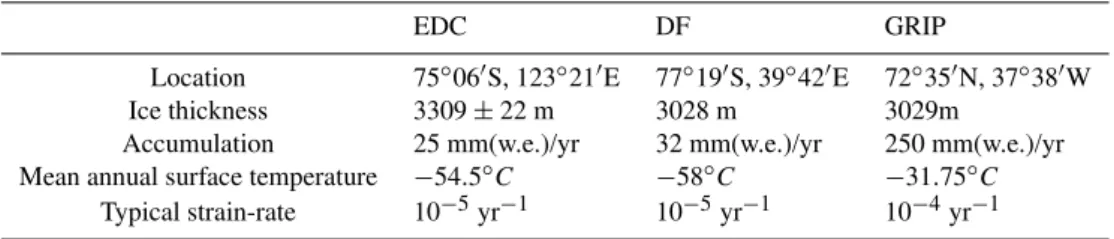
Table 1. Surface conditions at the EDC (EPICA Community Members, 2004), DF (Dome-F Deep Coring Group, 1998) and GRIP drilling sites (Schott Hvidberg et al., 1997). Strain rates are estimated from the ratio of accumulation to ice thickness.
EDC DF GRIP
Location 75◦06′S, 123◦21′E 77◦19′S, 39◦42′E 72◦35′N, 37◦38′W Ice thickness 3309±22 m 3028 m 3029m
Accumulation 25 mm(w.e.)/yr 32 mm(w.e.)/yr 250 mm(w.e.)/yr Mean annual surface temperature −54.5◦C −58◦C −31.75◦C
Typical strain-rate 10−5yr−1 10−5yr−1 10−4yr−1
evolutions of fabric at climatic transitions: (i) no remarkable change, (ii) a strengthening or (iii) a weakening.
It is also worth mentioning that DC and DF datings present a slight disagreement during stage 5.5. As far as it is under-stood, the annual layer thickness during stage 5.5 is underes-timated along EDC and/or overesunderes-timated along DF (Parrenin, 2006??). If we suppose that the discrepancy is caused by the
EDC thinning function (i.e., accumulation estimations along EDC are correct and DF dating is correct too), this corre-sponds to an overestimation of the thinning during stage 5.5. To correct for this possible overestimation of thinning, the corresponding data on Fig. 2 (red circles withǫzz ≈ −0.62) would have to be shifted to the left, which would lead to a better agreement of the profiles. Such an exercise would give important indications for future improvement of EDC and DF datings during stage 5.5.
After a brief description of the local higher order anisotropic ice flow model we are currently using, we will discuss the possible origins and the implications of the fabric clustering observed at Termination II along the EDC core.
3 A local ice flow model
In this section, we present briefly the anisotropic ice flow model used to simulate both the rheology and the fabric evo-lution at EDC. It is made up of a constitutive equation for the anisotropic behaviour of the ice polycrystal as a function of its fabric, an equation for the evolution of the fabric as a function of the strain-rates and deviatoric stresses experi-enced by ice, and a finite element code to solve the equations that govern the anisotropic ice flow. Details on the model and its applications can be found in Gillet-Chaulet et al. (2005, 2006).
3.1 Anisotropic behaviour
As mentioned in the introduction, the existence of non-randomly distributed fabric leads to anisotropic behaviour, so that Glen’s flow law which is generally used for ice sheet modelling is no longer applicable.
To relate the deviatoric stresses S¯ to the strain-rates D¯
we use the General Orthotropic Linear Flow law (GOLF)
(Gillet-Chaulet et al., 2005, 2006):
¯ S= ¯η0
3 X
r=1
¯
ηrtr(M¯r.D¯)M¯ D
r + ¯ηr+3(D¯.M¯r+ ¯Mr.D¯)D, (2) where
-η¯0is a reference viscosity,
- the GOLF parameters,η¯r andη¯r+3, (r=1,2,3), are six di-mensionless viscosities relative toη¯0, which depend on the fabric strength,
-M¯rare the three structure tensors given by the dyadic
prod-uct of the three basis vectors of the orthotropic reference frameoer⊗oer,(r=1,2,3),
- superscriptDdenotes the deviatoric part of a tensor. A linear behaviour is sound in central parts of ice sheets where the magnitude of the deviatoric stress is very low, so that the stress exponent is less than 2 and possibly close to 1 (Doake and Wolff, 1985; Lliboutry and Duval, 1985; Lipenkov et al., 1997).
In practice, the measured fabrics are not far from or-thotropic symmetry and a good estimate for the oror-thotropic reference frame is given by the eigenframe of the second or-der orientation tensor.
For an isotropic fabric, the GOLF reduces to
¯
S=2η¯0D¯, (3)
which is Glen’s flow law with a stress exponent equal to 1. Consequentlyη¯0is the viscosity of isotropic ice conveniently chosen asη¯0=1/B1, whereB1is the temperature dependent fluidity parameter commonly used in Glen’s law
B1(T )=B(To)e Q R(
1
To −1
T) (4)
whereB(To)is a reference fluidity at temperatureTo,Rthe gas constant and Q is the activation energy, equal to 60 kJ.mol−1 for temperatures less than −8◦C (Lliboutry and Duval, 1985).
linear grain behaviour is such that a grain deforms 25 times faster by shear parallel to basal plane compared to shear or-thogonal to the basal plane. Moreover, the viscosity of a grain under compression is the same whatever the direction. This leads to a viscosity of a polycrystal with an isotropic fabric that is 10 times larger than the shear viscosity per-pendicular to the mean direction of a single maximum fabric polycrystal. This value is in agreement with experimental results obtained by Pimienta et al. (1987).
3.2 Fabric evolution
Following Gillet-Chaulet et al. (2006), the material derivative ofa(2)is expressed as:
Da(2)
Dt = ¯
W.a(2)−a(2).W¯−(C¯.a(2)+a(2).C¯)+2a(4): ¯C, (5)
wherea(4) is the fourth order orientation tensor, W¯ is the
rotation rate tensor, :corresponds to the double contracted product (A=B :C ⇔Aij=Bij klCkl) andC¯ is a tensor that is homogeneous to a strain-rates, such as:
¯
C=(1−α)D¯ +αS¯ψ/2 , (6) whereψis the fluidity for shear parallel to the basal plane, andα is a scalar interaction parameter. A constant value
α=6.15×10⁻², allows one to fit the results of the self-consistent model with the grain behaviour used in this work. To close these equations, the fourth order orientation ten-sora(4)is assumed to be a function of the second order
ori-entation tensor. The adopted closure approximation is the so called “invariant based optimal fitting closure approxima-tion” proposed by Chung and Kwon (2002) and adapted to ice by Gillet-Chaulet et al. (2006).
3.3 Ice flow model
The equations presented above have been implemented in the finite element code Elmer (http://www.csc.fi/elmer/). For the gravity driven ice flow we solve the set of the Stokes equa-tions, i.e., the equation of continuity for ice considered as incompressible and the conservation of momentum, neglect-ing inertia terms. The constitutive equation is given by (2), the equation for the fabric evolution is given by (5), and the model allows to calculate the free surface elevation. More details on the numerics can be found in Gillet-Chaulet et al. (2006).
4 Possible origins of the observed fabric strengthening
4.1 Change in recrystallization processes
As mentioned in the introduction, recrystallization processes affect the fabric and a change in their relative contribution during climatic transitions could be envisaged. Therefore,
one has to study if such modification of recrystallization rate could explain the observed fabric strengthening.
Normal grain growthaffects the size of the grains, but does not change their crystallographic orientations (Alley, 1992). Changes innormal grain growth rate between glacials and interglacials are obvious (i.e.change of the grain size), but it cannot explain the observed change in fabric.
Rotation recrystallizationdivides crystals in subgrains and is believed to oppose fabric concentration in compression (Castelnau et al., 1996b). Moreover, high concentrations of impurities impede grain growth so that the highly elongated grains are subdivided easily by deformation:rotation recrys-tallizationis enhanced and this could lead to a weakening of the fabric in glacial ice. This explanation was considered by (Azuma et al., 1999) to explain DF observations, but it is obviously not relevant in the EDC case.
In the studied depth range, temperature increases from
−38◦Cat 1500 m to−30◦Cat 2000 m. Therefore,migration recrystallizationshould not occur as temperatures are much below −10◦C. Moreover, migration recrystallization pro-duces large interlocking grains (Duval and Castelnau, 1995), and the c-axis pattern is a circle girdle at about 30◦ from the direction of compression (Jacka and Maccagnan, 1984), which is not observed for the EDC core.
Whatever the recrystallization process, and even if the re-crystallization rates could change depending on the consid-ered climatic period, this cannot explain the fabric strength-ening during termination II in EDC.
4.2 Change in the initial fabric at the time of deposition It is usually postulated that the fabric is isotropic at the sur-face of the ice-sheet. This is mainly based on the extrap-olation of measurements made at firn-ice transition (around 100 m in EDC). However Diprinzio et al. (2005) have mea-sured some sections already clustered at 22 m depth along the Siple Dome core (a1(2)≈0.55). If, conditions at the time of deposition influence the snow microstructure (altitude, type of precipitation, wind stress, change in ice flow...), a slight change in the initial fabric could occur. Could this have an impact on the fabric thousands of years later?
−0.7 −0.6 −0.5 −0.4 −0.3 −0.2 −0.1 0 0 0.1 0.2 0.3 0.4 0.5 0.6 0.7 0.8 0.9
ε
zz a i
(2)
Fig. 3. Evolution of the eigenvalues of a(2) as a function of
ǫzz along the EDC core: a1(2) in black, a2(2) in gray anda3(2) in
light gray. Closed symbols are data points, whereas lines show the output of the model for different initial fabricsa(12), a2(2), a(32)
:
(0.35,0.35,0.30)continuous line,(0.40,0.325,0.275)dashed line,
(0.45,0.30,0.25) dashed-dotted line, (0.50,0.275,0.225) dotted line.
data, the self-consistent model predicts a too fast concen-tration of the fabric. This result is attributed to the effect of the rotation recrystallization on the fabric development in compression (Castelnau et al., 1996b). To take this ef-fect into account in the model and slow down the fabric concentration, we use a value of the interaction parameter
α in (6) lower than that which allows to fit the results of the self-consistent model (i.e., α=6.15×10⁻²). A good accordance between the model and the data is found with
α=0.01. Four runs were performed with different initial fabrics defined by the following triplets a1(2), a2(2), a3(2):
(0.35,0.35,0.30), (0.40,0.325,0.275), (0.45,0.30,0.25),
(0.50,0.275,0.225).
Results of the model are shown together with the evolu-tion ofai(2) along EDC on Fig. 3. The general evolution of the three eigenvalues ofa(2)is well reproduced by the model
with the initial fabric equal to(0.45,0.30,0.25). This re-sult indicates that the general trend of the thinning function is probably good and that the shape of the dome probably did not change significantly with time. Figure 3 shows that a change in the initial fabric is still observable even after a strainǫzz= −0.7, and that almost all the data can be
repro-duced by the model depending on the initial fabric. How-ever, at this stage, this hypothesis is still speculative and raises more questions than it solves: (i) what are the mech-anisms responsible of fabric clustering in the very top part of ice-sheets and are they changing with surface conditions, (ii) could these mechanisms lead to a different behaviour be-tween EDC and DF? These points need to be clarified in the future by making accurate measurements of fabric at the very top part of ice sheets at different locations.
4.3 Change in the shape of the dome
With our model for the fabric evolution (see Eq. 5), the fab-ric is only a function of the cumulative strain as far as the ice is only submitted to compression and as far as the ratios between the diagonal termsD¯ii of the strain-rate tensor are
constant with time. If we assume that the dome did not move in the past, and that ice was always and only submitted to compression during its journey, then fabric heterogeneities could only be explained by a change in the ratioD¯22/D¯33.
For the upper part of the ice core, this ratio is mostly gov-erned by the shape of the dome. At larger depth,D¯22/D¯33 is affected by the bedrock topography. According to Siegert et al. (2001), in the vicinity of EDC, below approximately 2000 m the structure of the ice sheet is controlled by sub-glacial topography and former flow.
Therefore, due to the change in the shape of the dome or to bedrock influences, even if compression only occurred, each layer could have been submitted to its own strain-rate his-tory, different from that experienced by other layers. A part of the differences between the data and the model in Fig. 3 could be attributed to this effect. But because extrusion flow is not possible (Nye, 1952), the vertical profile of the diag-onal strain-rates has to be continuous so that the difference on the strain-rates between two adjacent layers must remain small. Thus, the abrupt strengthening of the fabric can not be attributed entirely to this effect.
4.4 Change in the effective viscosity of ice related to cli-mate
is quite unclear: it is believed that this process spreads the fabric under compression (Castelnau et al., 1996b), whereas Paterson (1991) argues that it could cluster the fabric under shearing. This will have to be clarified in the future. How-ever, the important point in Paterson’s theory is the pres-ence of an initial differpres-ence in shear viscosity between lay-ers. Such a difference could also be explained by a difference in grain size or in impurities content (see also discussion in Sect. 5.1). Then we have a positive feedback: strengthened fabric is easier to shear which again leads to more strength-ened fabric. However, this scenario will not hold, when we approach a dome because horizontal shear becomes negligi-ble in comparison to compression.
Consequently, such a scenario could be envisaged for EDC, only if shear is occurring. Many indications lead us to believe that it is not unrealistic. First, actual ice caps are usually not symmetric, because of the bedrock topog-raphy and/or the accumulation pattern, thus the flow cen-tre, i.e., zero horizontal velocity, is not inevitably co-located with the highest surface elevation. Moreover, Castelnau et al. (1998) have shown that an horizontal shear strain-rate could be observed even exactly below an ice divide where the shear stress is expected to be small. Near an ice divide, the strain-rate direction is highly sensitive to the stress direction when ice is anisotropic. A slight deviation of the mean symme-try axis of the fabric in relation to the symmesymme-try axis of stresses can induce a significant shear strain-rate. The iso-line corresponding to the absence of shear strain-rate has a sinuous shape just below the GRIP site in Greenland as shown by Schott Hvidberg et al. (1997) and Gagliardini and Meyssonnier (2000). Furthermore, the location of the dome could have moved in the past, and it has been shown that shear becomes rapidly predominant with increasing distance from a dome, especially with anisotropy (Mangeney et al., 1997). Finally, observations have shown some evidence of the occurrence of shearing along EDC. The microstructure geometry indicates that shear could occur even in the upper part of the core (Durand et al., 2004), and Hodgkins et al. (2000) concludes from radio-echo-sounding that ice below about 1000 m has experienced horizontal shear. Borehole measurements in the coming years would be crucial to prop-erly quantify the amount of shear along EDC. We will fur-ther discuss this shearing-hypothesis in Sect. 5. Using the local flow model, we will look at the consequences of a fab-ric strengthening on the ice flow in the vicinity of a dome.
Finally, it is worth mentioning that the current dating model is based on the assumption that the shape of the verti-cal velocity profile is fixed with time (Parrenin et al., 2006??). However, this assumption is not verified if the shape/location of the dome has change with time. Then, the observed strengthening of the fabric could be explained by an under-estimation of the thinning function.
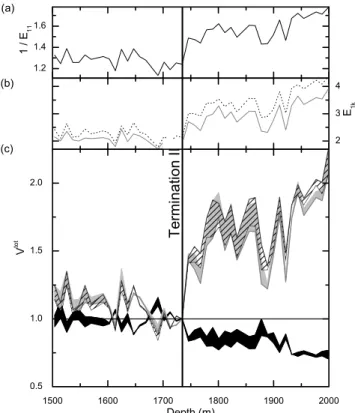
Fig. 4. Evolution of the enhancement factors as a function of depth:
(a)1/E11,(b)E12(dotted line) andE13(gray line)(c)Evolution
of the viscosity ratios resulting from textural effects (grain size and fabric). The hatched area (respectively the gray area) corresponds to the viscosity ratio for shear in direction 2 (respectively direction 1), whereas the black one corresponds to the viscosity ratio for uni-axial compression.
5 Consequence of the strengthening of the fabric
5.1 Termination II: a change in ice rheology
According to Cuffey et al. (2000), the enhanced strain-rate in glacial ice can be explained by a combination of fabric and grain size effects. Variations in dust and impurities content from glacial to interglacial periods may also play a role in the ice viscosity but the additional enhancement factor is actually difficult to estimate. According to Paterson (1991) these vari-ations directly influence the ice viscosity but for Cuffey et al. (2000), the difference of the ice viscosity between glacial and interglacial periods is more related to the grain size effects. Here, by the help of the orthotropic flaw law (2), we first estimate the contribution of the fabric strengthening during termination II before using Cuffey et al. (2000) results to es-timate the part attributed to the grain size variations. We will neglect the potential effect of impurities. Note, however, that their possible contribution would increase the calculated en-hancement factors.
frame, to :(i)a uni-axial compressive test defined byD¯11=− 2D¯22= −2D¯33 <0 and(ii) two shear tests defined byD¯1k (k=2,3)with the other components of the strain-rate tensor equal to 0. As mentioned previously, the eigenvector associ-ated toa1(2)does not deviate from the vertical for more than few degrees, and therefore test(i)corresponds approximately to an in-situ vertical uni-axial compression, whereas tests(ii)
correspond to horizontal simple shear in directionsk=2,3. Under these conditions, the GOLF can be expressed as fol-lows:
¯ S1k=2η¯0
1
E1k
¯
D1k, (7)
wherek=1 for test(i) andk=2,3 for tests(ii). Analytical resolution of the GOLF allows to express enhancement fac-tors relative to isotropic ice. It is worth noting that an en-hancement factor is related to the applied strain-rate. The enhancement factors in (7) are expressed using (2):
E11=
3
(η¯1+0.25(η¯2+ ¯η3)+2η¯4+0.5(η¯5+ ¯η6))
E1k= 2
(η¯4+ ¯ηk+3)
k=2,3
(8)
By definition, E1k=1 for isotropic ice, E11=2/5 and
E12=E13=10 for a polycrystal with all its grains aligned along direction 1.
Evolutions ofE1k are plotted versus depth on Fig. 4. As expected the enhancement factors for shear perpendicular to the eigenvector 1 increase with increasinga1(2). On the other hand, the enhancement factor for vertical uni-axial compres-sion decreases with increasinga1(2) (see Fig. 1). Also note that because fabrics are not exactly axisymmetric we observe a small difference betweenE12 andE13. The discontinuity of the eigenvaluea(12)during termination II implies disconti-nuities for the enhancement factors: just above the climatic transition ice is approximately 1.8 to 1.9 (respectively 1.5) times easier to shear (respectively harder to compress) than isotropic ice whereas just below the transition, ice is 3 to 3.4 (respectively 1.25) times easier to shear (respectively harder to compress) than isotropic ice. Consequently, only by the effect of the fabric, glacial ice is 1.7 to 1.8 times easier to shear and 1.2 times harder to compress than the interglacial ice, even if only a few tens of meters separate the two layers. We will assume that the grain size has an isotropic effect so that the enhancement factors for shear and compression are equal. According to Cuffey et al. (2000), the viscosity ra-tioVABcorresponding to the ratio of the enhancement factor EA in a layer with a grain size equal toDAto the enhance-ment factorEBin a layer with a grain size equal toDB, lies
between the two following lower and upper bounds:
VAB= EA EB
=1+0.2D
−1.8 A 1+0.2DB−1.8 VAB=
EA EB
=
D B DA
0.6 (9)
Around the climatic transition the grain size is approximately 3.4 mm for interglacial ice and 2.7 mm for glacial ice (see Fig. 1). This implies that glacial ice is 1.01 to 1.15 times easier to deform than interglacial ice only by the effect of the grain size variation from MIS5 to MIS6.
The total viscosity ratioVtotbetween MIS5 and MIS6 in the EDC core is obtained as
Vtot=Vcryst×Vfab (10)
whereVcrystis the viscosity ratio due to the grain size vari-ations (Eq. 9) and Vfab is the viscosity ratio due to fabric variations (Eq. 8). Note that all the viscosity ratios have been calculated relative to the deepest texture sampled in MIS5 at 1735 m andVtot evolution is shown on Fig. 4. Taking into account the effects of grain size and fabric we find that the glacial ice below 1750 m is between 1.4 to 2.2 times easier to shear than the interglacial ice just above, and approximately 1 to 1.2 times harder to compress. Note that these values are in good agreement with measurements made along different ice cores and reviewed by Paterson (1991).
For comparison we estimate the change of the ice viscos-ity due to the temperature change. Preliminary results indi-cate that the temperature is approximately−35◦Cat 1700 m and−33◦Cat 1800 m, taking into account equation (4) this change of the temperature implies that the ice at 1800 m is approximatively 1.3 times more fluid than at 1700 m. Note that the vertical evolution of the temperature increases the viscosity ratio for shear but decreases the viscosity ratio for compression. Variations of viscosity induced by the modi-fication of the textural properties with depth are usually ne-glected compared to the viscosity changes induced by the temperature increase with increasing depth. Such an approx-imation seems reasonable at the ice-sheet scale. However, as illustrated above, this hypothesis no longer holds as soon as one looks at a smaller scale.
Note that the effects of these changes of the ice properties, certainly influence the in-situ ice flow, but it is impossible to predict in which way without modelling properly the ice flow around the drilling site. Possible effects are illustrated in the following.
−1 −0.8
−0.6 −0.4
−0.2 0
0 0.1 0.2 0.3 0.4 0.5 0.6 0.7 0.8 0.9 1
ε
zz
a
(2) i SOFT HARD SOFT HARD SOFT
Fig. 5. Evolution of the eigenvalues ofa(2)versus deformation in an ice core situated at 30 km from the ice divide. The stationary solution is represented by thin solid lines. For the transient run
ai(2)are plotted with thick solid lines and layers withB1=0.0428
MPa−1.yr−1are highlighted by a white area, whereas layers with
B1=0.0140 MPa−1.yr−1appears in gray. The dark gray layer just
above the bedrock corresponds to the oldest layers of the stationary run. Dotted lines correspond to the solution obtained by assuming only a bi-axial compression.
ice sheet over a flat bedrock in the vicinity of an ice divide, under plane strain conditions. The horizontal direction is de-noted byxand the vertical direction byz.
5.2.1 Conditions of the numerical experiment
The domain studied extends from the ice divide atx=0 km tox=xL=120 km. The stress on the ice sheet free surface is such that
¯
σ.n=σ0n, (11)
whereσ0is the atmospheric pressure andnthe outward unit
vector normal to the surface. The accumulation rate at the surface is constant and equal to 8 cm.yr−1. To avoid infinite age at the base of the ice sheet, a constant vertical velocity equal to−0.1 mm is prescribed at the bedrock. At the ice di-vide (symmetry axis) the horizontal velocity is equal to 0. A horizontal velocity profile is imposed at the lateral boundary atx=xL. This horizontal velocity profile derives from the shallow ice approximation for an anisotropic ice sheet with orthotropic ice (Gagliardini and Meyssonnier, 2002), and
sat-0 500 1000 1500 2000 2500 3000
−4 −3 −2 −1 0
x 10−5 Dzz
(
×
10
−5
yr
−1
)
Depth (m)
0 1 2 3 4 5 6
Dxz
×
10
−4
(yr
−1
)
0 0.5 1 1.5
u (m.yr
−1
)
SOFT
SOFT
SOFT HARD HARD SOFT
0 500 1000 1500 2000 2500 3000
−0.1 −0.08 −0.06 −0.04 −0.02 0
v (m.yr
−1
)
Depth (m) (a)
(b)
(c)
(d)
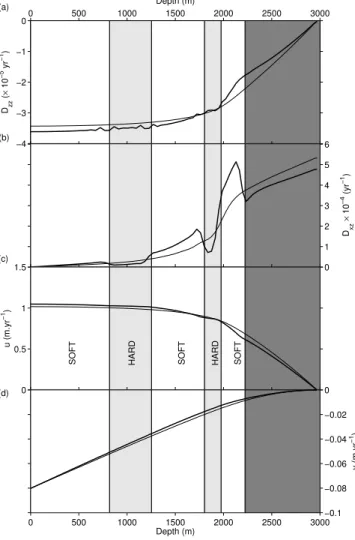
Fig. 6. Evolution of: (a)the longitudinal strain-rateDzz,(b)the shear strain-rateDxz,(c)the horizontal velocityuand(d)the verti-cal velocityvas a function of depth in an ice core situated at 30 km from the ice divide. The stationary solution is represented by a thin solid lines, whereas the transient run is plotted with a thick solid line.
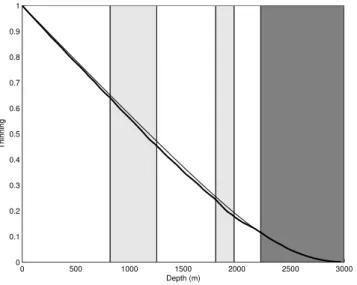
0 500 1000 1500 2000 2500 3000 0
0.1 0.2 0.3 0.4 0.5 0.6 0.7 0.8 0.9 1
Depth (m)
Thinning
Fig. 7. Evolution of the thinning with depth at 30 km from the ice divide. The stationary solution is represented by a thin solid lines, whereas the transient run is plotted with a thick solid line.
The initial ice sheet surface elevationE(x)is a Vialov’s profile (Vialov, 1958)
E(x)=E0
1− 0.01x E0
!2
1/4
, (12)
where E0=E(x=0)=3000 m. The fabric field is initial-ized using a polynomial fit from the data of the GRIP ice core. The fluidity of ice is constant and equal toB1=0.0245 MPa−1.yr−1 (see Eq. 4). The interaction parameter α in Eq. (6) is selected to fit the results of the self-consistent model, i.e., α=6.15×10⁻². The ice fabric at the surface is isotropic. Then the model is run with a transient numeri-cal scheme until a stationary solution is obtained for the free surface elevation, fabric and velocity fields. Results of the stationary state are presented as thin solid lines in Figs. 5 and 6.
Starting from this stationary solution a transient run is per-formed. The viscosity of ice is assumed to be a function of time when it was deposited at the surface: ice which was deposited between 0 and 20 kyr is given a viscosity equal to B1=0.0428 MPa−1.yr−1 and ice which was deposited between 20 kyr and 30 kyr is given a viscosity equal to
B1=0.0140 MPa−1.yr−1, and so on every 20 kyr and 10 kyr. This change in viscosity corresponds to a viscosity ratio of 3.06 between two distinct layers. This difference on the vis-cosity aims at representing the effects of the variations in grains size and impurities content. This value is enhanced with respect to the estimation obtained in Section 5.1, be-cause a transition between two distinctive layers can be in-side an element of the mesh, which implies numerical dif-fusion during the interpolation procedure of the ice fluidity
which is defined by nodal values. The 20 kyr layers mimic glacial stages whereas 10 kyr ones stand for interglacial pe-riods. They are respectively pointed out by white and gray areas on Figs. 5 and 6. The model was run during 72.2 kyr and the outputs obtained at this date are plotted as thick solid lines on the figures.
It has to be mentioned that the accumulation value is not in agreement with that of EDC. Moreover, durations of pe-riods obviously do not correspond to real climatic durations. These choices have been made in order to manage runs with reasonable time duration.
5.2.2 Results and discussion
Figure 5 shows the evolution of the eigenvaluesa(2)for the stationary run (thin solid lines) as well as the results obtained from the transient run (thick solid lines) as a function of the cumulative strainǫzz of each layer. These modelling results are obtained for a “numerical” ice core located at 30 km (ap-proximately 10 ice thicknesses) from the ice divide. The po-sition of the ice core has been chosen to illustrate the effects of shear. Dotted lines are obtained by using the equation for fabric evolution (5) coupled with the orthotropic behaviour (2), for a bi-axial compressive test defined by D¯zz<0 and
¯
Dzz= − ¯Dxx with the other components of the strain-rate tensor equal to 0. This corresponds to the solution obtained at the ice divide for both transient and stationary runs (we re-call that the fabric evolution obtained with our model at the divide is only a function of the thinning).
We first compare the difference in the trend of the curves obtained at the divide (dotted lines) and 30 km downstream for the stationary run (thin solid lines). Due to the shear ex-perienced by ice, fabric at 30 km of the dome clusters more rapidly than predicted without shear (i.e., at the dome). How-ever, the shape of the curves is very similar, so that it is very difficult to distinguish only by looking at the general behaviour of the fabric evolution if ice has been submitted to shear or not. Moreover, as mentioned in Sect. 2, below 1750 m and for a given strain, the fabrics measured along DC are more clustered than the ones measured along DF and GRIP (see also Fig. 2). This could be explained by a higher shear strain-rate along EDC as compared to the other sites, thus confirming our hypothesis of non-negligible shear along EDC (at least below 1750 m).
viscosity of ice implies a discontinuity on the shear strain-rateDxzand only a discontinuity on the slope of the longitu-dinal strain-rateDzz, i.e., no extrusion flow. In softer layers the shear rate and the slope of the longitudinal strain-rate are higher than in harder layers. These changes are also visible on both vertical and horizontal velocity profiles, even if less pronounced due to integration over space. Moreover, due to the velocity continuity, the results for the longitudinal strain-rate shown on Fig. 6 at 30 km from the ice divide are still valid at the divide.
Figure 7 shows the evolution of the thinning as a func-tion of depth at 30 km from the ice divide for the stafunc-tionary solution (thin line) and the transient run (thick line). Small differences of the thinning can be observed, but due to the continuity ofDzzthere is no differential thinning between ad-jacent layers, and only the slope of the thinning curve seems affected. It is however impossible, with these results, to give a general trend to help the ice core dating community, for dif-ferent reasons: (i) First, the value of the thinning, as well as
Dzz,Dxz,uandv, are functions of the layer and evolve with time depending on the position and the properties of each layers in the ice sheet. This is not included in current models used for dating purpose. (ii) As dating models look for the best scenario to fit well dating markers, the resulting thin-ning function is probably an intermediate solution between the stationary and transient runs. (iii) As noticed in Sect. 2.2 this depends on the local flow conditions which vary from site to site, even with similar glaciological context.
The positive feedback mentioned by Paterson (1991) is re-produced by our model, a softer layer experiences more shear so that the fabric in this layer is more concentrated and then softer for shear. Moreover, shear increases with depth so that a higher clustered layer does not have the opportunity to de-velop in the upper part of the core. This is also consistent with the observations reported by Wang et al. (2003) and this could explain the different behaviours observed between dif-ferent dome sites (see discussion in Sect. 2) as shear could be less significant along GRIP and DF than along EDC.
6 Conclusions
New measurements of texture have been done between 1500 and 2000 m along the EDC core. As a general trend, the fab-ric progressively clusters around the in-situ vertical, as it has been observed for other cores located at a dome. However, a sharp and unexpected strengthening of the fabric is observed during termination II. Different processes that could have contributed to form this heterogeneity are listed in Section 4. The most likely explanation is that shear is not negligi-ble along the EDC core. Theoretical indications support this hypothesis: the divide is not inevitably co-located with the highest surface elevation, the isoline corresponding to the absence of shear can have a sinuous shape and the dome could have moved in the past. Moreover, some
measure-ments also indicate the presence of shear: echo-sounding and microstructure geometry. A difference of viscosity be-tween layers of different periods, probably due to difference in grain size or/and in impurity content, could be the cause of a slight clustering of the fabric. A positive feedback is initiated as more clustered fabrics become easier to shear, which in turn enhance the clustering. This scenario could ex-plain our observations as illustrated by numerical simulations (Sect. 5). This could also explain the different behaviours of the fabric observed along several other ice cores: the pres-ence of shear is the determining factor. Thus, we strongly suggest to accurately monitor the EDC borehole to quantify the amount of shear.
As mentioned previously, discrepancies in the dating of the EDC and DF cores around termination II could have a mechanical origin. Due to their current architecture, dating models cannot capture all the physical processes involved in the ice flow. The present study clearly demonstrates that im-proving the dating of ice cores will require a more realis-tic flow modelling. However, much more work needs to be done. Processes at the root of the fabric heterogeneities have to be much better understood and three dimensional effects have to be studied with a proper modelling of the ice flow around drilling sites.
Acknowledgements. The authors are grateful to N. Azuma and T. Thorsteinsson for their fruitful comments. This work is a contribution to the European Project for Ice Coring in Antarctica (EPICA), a joint European Science Foundation/European Com-mission scientific programme, f unded by the EU and by national contributions from Belgium, Denmark, France, Germany, Italy, the Netherlands, Norway, Sweden, Switzerland and the United Kingdom. The main logistic support was provided by IPEV and PNRA (at Dome C) and AWI (at Dronning Maud Land). This is EPICA publication no. 167.
Edited by: E. W. Wolff
References
Alley, R. B.: Fabrics in polar ice sheets: development and predic-tion, Science, 240, 493–495, 1988.
Alley, R. B.: Flow-law hypotheses for ice-sheet modeling, J. Glaciol, 38, 245–256, 1992.
Azuma, N. and Higashi, A.: Formation processes of ice fabric pat-tern in ice sheets, Ann. Glaciol., 6, 130–134, 1985.
Azuma, N., Wang, Y., Mori, K., Narita, H., Hondoh, T., Shoji, H., and Watanabe, O.: Textures and fabrics in the Dome F (Antarc-tica) ice core, Ann. Glaciol., 29, 163–168, 1999.
Azuma, N., Wang, Y., Yoshida, Y., Narita, H., Hondoh, T., Shoji, H., and Watanabe, O.: Crystallographic analysis of the Dome Fuji ice core, in: Hondoh T, editor. Physics of ice records. Sapporo: Hokkaido University Press, 2000.
with a self-consistent approach : Comparison with bound esti-mates, J. Geophys. Res., 101, 13 851–13 868, 1996a.
Castelnau, O., Thorsteinsson, T., Kipfstuhl, J., Duval, P., and Canova, G. R.: Modelling fabric development along the GRIP ice core, central Greenland, Ann. Glaciol., 23, 194–201, 1996b. Castelnau, O., Shoji, H., Mangeney, A., Milsch, H., Duval, P.,
Miyamoto, A., Kawada, K., and Watanabe, O.: Anisotropic Be-havior of GRIP Ices and Flow in Central Greenland, Earth Planet. Sci. Lett., 154, 307–322, 1998.
Chung, D. H. and Kwon, T. H.: Invariant-based optimal fitting clo-sure approximation for the numerical prediction of flow-induced fiber orientation, J. Rheol., 46, 169–194, 2002.
Cuffey, K. M., Thorsteinsson, T., and Waddington, E. D.: A re-newed argument for crystal size control of ice sheet strain rates, J. Geophys. Res., 105, 27 889–27 894, 2000.
Diprinzio, C. L., Wilen, L. A., Alley, R. B., Fitzpatrick, J. J., Spencer, M. K., and Gow, A. J.: Fabric and texture at Siple Dome, Antarctica, J. Glaciol., 51, 281–290, 2005.
Doake, C. S. M. and Wolff, E. W.: Flow law in polar ice sheets, Nature, 314, 255–257, 1985.
Dome-F Deep Coring Group: Deep ice-core drilling at Dome Fuji and glaciological studies in East Dronning Maud Land, Antarc-tica, Ann. Glaciol., 27, 333–337, 1998.
Durand, G., Graner, F., and Weiss, J.: Deformation of grain boundaries in polar ice, Eur. Phys. Lett., 67, 1038–1044, doi: 10.1209/epl/i2004-10139-0, 2004.
Durand, G., Gagliardini, O., Throsteinsson, T., Svensson, A., Kipf-stuhl, J., and Dahl-Jensen, D.: Ice microstructure and fabric: an up to date approach for measuring textures, J. Glaciol, 52, 619– 630, 2006a.
Durand, G., Weiss, J., Lipenkov, V., Barnola, J. M., Krinner, G., Parrenin, F., Delmonte, B., Ritz, C., Duval, P., Roethsliberger, R., and Bigler, M.: Effect of impurities on grain growth in cold ice sheets, J. Geophys. Res., 111, doi:10.1029/2005JF000320., 2006b.
Duval, P. and Castelnau, O.: Dynamic recrystallization of ice in polar ice sheets, Journal de physique, 5, 197–205, 1995. Duval, P., Ashby, M. F., and Anderman, I.: Rate controlling
pro-cesses in the creep of polycrystalline ice, J. Phys. Chem., 87, 4066–4074, 1983.
EPICA Community members: Eight glacial cycles from an Antarc-tic ice core, Nature, 429, 623–628, 2004.
Gagliardini, O. and Meyssonnier, J.: Simulation of Anisotropic Ice Flow and Fabric Evolution Along the GRIP-GISP2 Flow Line (Central Greenland), Ann. Glaciol., 30, 217–223, 2000. Gagliardini, O. and Meyssonnier, J.: Lateral boundary conditions
for a local anisotropic ice flow model, Ann. Glaciol., 35, 503– 509, 2002.
Gillet-Chaulet, F., Gagliardini, O., Meyssonnier, J., Montagnat, M., and Castelnau, O.: A user-friendly anisotropic flow law for ice-sheet modelling, J. Glaciol., 51, 2005.
Gillet-Chaulet, F., Gagliardini, O., Meyssonnier, J., Zwinger, T., and Ruokolainen, J.: Flow-induced anisotropy in polar ice and related ice-sheet flow modelling, J. Non-Newtonian Fluid Mech., 134, 33–43, 2006.
G¨odert, G. and Hutter, K.: Material update procedure for planar transient flow of ice with evolving anisotropy, Ann. Glaciol.., 30, 107–114, 2000.
Gow, A. J. and Williamson, T.: Rheological implications of the
in-ternal structure and crystal fabrics of the West Antarctic ice sheet as revealed by deep core drilling at Byrd Station, CRREL Report, 76–35, 1976.
Gow, A. J., Meese, D. A., Alley, R. B., Fitzpatrick, J. J., Anandakr-ishnan, S., Woods, G. A., and Elder, B. C.: Physical and struc-tural properties of the Greenland Ice Sheet Project 2 ice core: a review, J. Geophys. Res., 102, 26 559–26 575, 1997.
Herron, S. L. and langway, C. C.: A comparison of ice fabrics and textures at Camp Century, Greenland and Byrd station Antarc-tica, Ann. Glaciol, 3, 118–124, 1982.
Hodgkins, R., Siegert, M. J., and Dowdeswell, J. A.: Geophysical investigations of ice-sheet internal layering and deformation in the Dome C region central East Antarctica, J. Glaciol., 46, 161– 166, 2000.
Jacka, T. H. and Maccagnan, M.: Ice crystallographic and strain rate changes with strain in compression and extension, Cold Reg. Sci. Technol., 8, 269–286, 1984.
Johnsen, S. J. and Dansgaard, W.: On flow model dating of stable isotope records from Greenland ice cores, in: The Last Deglacia-tion: Absolute and Radiocarbon Chronologies, edited by: E. Bard and W. S. Broeckerpp., 13–24, NATO ASI Ser. I. Springer-Verlag, New York,, 1992.
Langway, C. C., Shoji, H., and Azuma, N.: Crystal size and orien-tation patterns in the Wisconsin-age ice from Dye 3, Greenland, Ann. Glaciol., 10, 109–115, 1988.
Lipenkov, V. Y., Salamatin, A. N., and Duval, P.: Bubbly-ice densi-fication in ice sheets: II. Applications, J. Glaciol., 43, 397–407, 1997.
Lliboutry, L. and Duval, P.: Various isotropic and anisotropic ices found in glacier and polar ice caps and their corresponding rhe-ologies, Annales Geophys., 3, 207–224, 1985.
Mangeney, A., Califano, F., and Hutter, K.: A numerical study of anisotropic, low Reynolds number, free surface flow of ice sheet modeling, J. Geophys. Res., 102, 22 749–22 764, 1997. Meyssonnier, J. and Philip, A.: A model for the tangent viscous
behaviour of anisotropic polar ice, Ann. Glaciol., 23, 253–261, 1996.
North Greenland Ice Core Project members: High resolution record of northern hemisphere climate extending into the last inter-glacial period, Nature, 431, 147–151, 2004.
Nye, J. F.: Extrusion flow: reply to Mr. J. E. Fisher’s comments, J. Glaciol, 2, 52–53, 1952.
Nye, J. F.: The topology of ice-sheet centres, J. Glaciol., 37, 220– 227, 1991.
Parrenin, F.: Dating of the EPICA Dome C ice core., Clim. Past Discuss., 3, 575–606, 2007,
http://www.clim-past-discuss.net/3/575/2007/.
Parrenin, F., Dreyfus, G., Durand, G., Fujita, S., Gagliardini, O., Gillet, F., jouzel, J., Kawamura, K., Lhomme, N., Masson-Delmotte, V., Ritz, C., Schwander, J., Shoji, H., Uemura, R., Yoshida, N., Watanabe, O., and Wolff, E.: Ice flow modelling at Dome C and Dome Fuji, East Antarctica, Clim. Past Discuss., 3, 19–61, 2007,
http://www.clim-past-discuss.net/3/19/2007/.
Paterson, W. S. B.: Why ice-age is sometimes soft, Cold. Reg. Sci. Technol., 20, 75–98, 1991.
Basis of Ice Sheet Modelling, Vancouver), pp. 57–66, 1987. R´emy, F. and Tabacco, I. E.: Bedrock features and ice flow near the
EPICA ice core site (Dome C, Antarctica), Geophys. Res. Let., 24, 405–408, 2000.
Schott Hvidberg, C., Dahl-Jensen, D., and Waddington, E. D.: Ice flow between the GRIP and GISP2 boreholes in Central Green-land, J. Geophys. Res., 102, 26 851–26 859, 1997.
Siegert, M. J., Eyers, R. D., and Tabacoo, I. E.: Three-Dimensional ice-sheet structure at Dome C, central East Antarctic: implica-tions for the interpretation of the EPICA ice core, Antarctic Sci., 13, 182–187, 2001.
Staroszczyk, R. and Morland, L. W.: Plane Ice Sheet Flow with Evolving Orthotropic Fabric, Ann. of Glaciol., 30, 93–101, 2000. Thorsteinsson, T., Kipfsthul, J., and Miller, H.: Textures and fabrics in the GRIP project, J. Geophys. Res., 102, 26 583–26 599, 1997. Thorsteinsson, T., Waddington, E. D., Taylor, K. C., Alley, R. B., and Blankenship, D. D.: Strain-rate enhancement at Dye 3, Greenland, J. Glaciol., 45, 338–345, 1999.
Thorsteinsson, T., Waddington, E. D., and Fletcher, R. C.: Spatial and temporal scales of anisotropic effects in ice-sheet flow, Ann. Glaciol., 37, 40–48, 2003.
Van der Veen, C. J. and Whillans, I. M.: Development of fabric in ice, Cold Reg. Sci. Technol., 22, 171–195, 1994.
Vialov, S. S.: Regularities of glacial shields movements and the theory of plastic viscous flow, Physics of the movements of ice IAHS, 47, 266–275, 1958.
Wang, Y., Kipfstuhl, S., Azuma, N., Thorsteinsson, T., and Miller, H.: Ice-fabrics study in the upper 1500 m of the Dome C (East Antarctica) deep ice core, Ann. Glaciol., 37, 97–104, 2003. Watanabe, O., Kamiyama, K., Motoyama, H., Fujii, Y., Shoji, H.,
and Satow, K.: The paleoclimatic record in the ice core at Dome Fuji station, East Antarctica, Ann. Glacio., 29, 176–178, 1999. Woodcock, N. H.: Specification of fabric shapes using an