BGD
6, 1903–1944, 2009Predicting cropland carbon fluxes with
SiBcrop
E. Lokupitiya et al.
Title Page
Abstract Introduction
Conclusions References
Tables Figures
◭ ◮
◭ ◮
Back Close
Full Screen / Esc
Printer-friendly Version
Interactive Discussion
Biogeosciences Discuss., 6, 1903–1944, 2009 www.biogeosciences-discuss.net/6/1903/2009/ © Author(s) 2009. This work is distributed under the Creative Commons Attribution 3.0 License.
Biogeosciences Discussions
Biogeosciences Discussionsis the access reviewed discussion forum ofBiogeosciences
Incorporation of crop phenology in
Simple Biosphere Model (SiBcrop) to
improve land-atmosphere carbon
exchanges from croplands
E. Lokupitiya1, S. Denning1, K. Paustian2,3, I. Baker1, K. Schaefer4, S. Verma5, T. Meyers6, C. Bernacchi7, A. Suyker5, and M. Fischer8
1
Department of Atmospheric Science, Colorado State University, Fort Collins, CO 80523, USA
2
Department of Soil and Crop Sciences, Colorado State University, Fort Collins, CO 80523, USA
3
Natural Resource Ecology Lab, Colorado State University, Fort Collins, CO 80523, USA 4
National Snow and Ice Data Center, University of Colorado, Boulder, CO 80309, USA 5
School of Natural Resources, University of Nebraska-Lincoln, USA 6
BGD
6, 1903–1944, 2009Predicting cropland carbon fluxes with
SiBcrop
E. Lokupitiya et al.
Title Page
Abstract Introduction
Conclusions References
Tables Figures
◭ ◮
◭ ◮
Back Close
Full Screen / Esc
Printer-friendly Version
Interactive Discussion
7
Department of Plant Biology, University of Illinois at Urbana-Champaign, Champaign, IL 61820, USA
8
Lawrence Berkeley National Laboratory, Environmental Energy Technologies Division, Atmospheric Science Department, Berkeley, CA 94720, USA
Received: 8 December 2008 – Accepted: 8 January 2009 – Published: 10 February 2009 Correspondence to: E. Lokupitiya (erandi@atmos.colostate.edu)
BGD
6, 1903–1944, 2009Predicting cropland carbon fluxes with
SiBcrop
E. Lokupitiya et al.
Title Page
Abstract Introduction
Conclusions References
Tables Figures
◭ ◮
◭ ◮
Back Close
Full Screen / Esc
Printer-friendly Version
Interactive Discussion
Abstract
Croplands are man-made ecosystems that have high net primary productivity during the growing season of crops, thus impacting carbon and other exchanges with the at-mosphere. These exchanges play a major role in nutrient cycling and climate change related issues. An accurate representation of crop phenology and physiology is
im-5
portant in land-atmosphere carbon models being used to predict these exchanges. To better estimate time-varying exchanges of carbon, water, and energy of croplands using the Simple Biosphere (SiB) model, we developed crop-specific phenology mod-els and coupled them to SiB. The coupled SiB-phenology model (SiBcrop) replaces remotely-sensed NDVI information, on which SiB originally relied for deriving Leaf Area
10
Index (LAI) and the fraction of Photosynthetically Active Radiation (fPAR) for estimat-ing carbon dynamics. The use of the new phenology scheme within SiB substantially improved the prediction of LAI and carbon fluxes for maize, soybean, and wheat crops, as compared with the observed data at several AmeriFlux eddy covariance flux tower sites in the US mid continent region. SiBcrop better predicted the onset and end of the
15
growing season, harvest, interannual variability associated with crop rotation, day time carbon uptake (especially for maize) and day to day variability in carbon exchange. Biomass predicted by SiBcrop had good agreement with the observed biomass at field sites. In the future, we will predict fine resolution regional scale carbon and other exchanges by coupling SiBcrop with RAMS (the Regional Atmospheric Modeling
Sys-20
tem).
1 Introduction
Trends in global warming and climate change have drawn more attention towards
an-thropogenic emissions of greenhouse gases. Carbon dioxide (CO2) has been
identi-fied as the main anthropogenic greenhouse gas contributing to climate change (IPCC,
25
BGD
6, 1903–1944, 2009Predicting cropland carbon fluxes with
SiBcrop
E. Lokupitiya et al.
Title Page
Abstract Introduction
Conclusions References
Tables Figures
◭ ◮
◭ ◮
Back Close
Full Screen / Esc
Printer-friendly Version
Interactive Discussion
in climate change and its long-term consequences. A powerful way to evaluate these exchanges is to model the fluxes between the land and atmosphere using reliable land surface models, while evaluating the outcome against observed data. The performance of those models depends on how well they can simulate the vegetation properties and
dynamics over time and space. This study focuses on estimating the CO2 exchanges
5
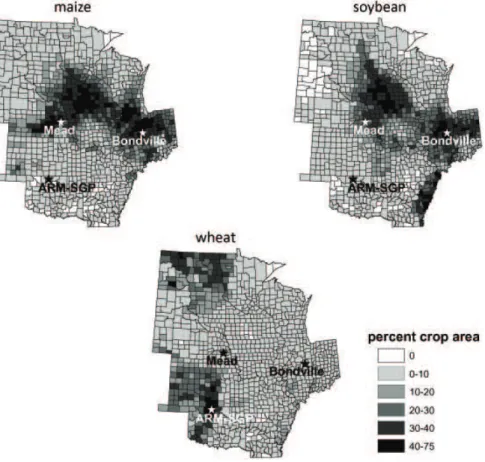
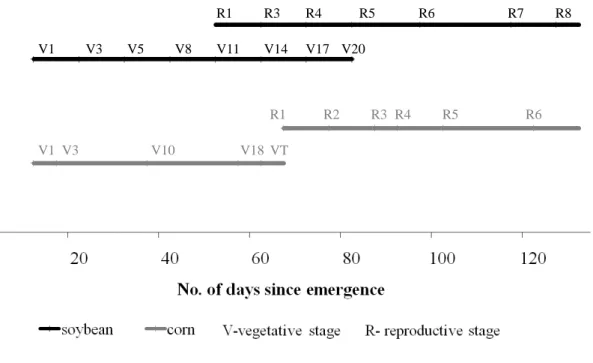
in cropland ecosystems, evaluated against AmeriFlux eddy covariance flux tower sites with maize, soybean, and wheat crops (Fig. 1). During the growing season, the
pres-ence of crops significantly impacts CO2 fluxes, as well as albedo, roughness length,
Bowen ratio, and soil moisture. Therefore, an accurate representation of crop
phenol-ogy (i.e., timing of different growth stages) and physiology is important in predicting
10
carbon and other exchanges of these managed ecosystems.
Croplands include a variety of species with different phenology and physiology.
Crops have either C3 or C4 photosynthetic pathways and the associated differences in
plant anatomy and physiology. Croplands have unique dynamics as managed ecosys-tems that are mostly governed by the dates of planting and harvest, crop rotation,
15
tillage, fertilization, irrigation, and pest control. Most croplands are characterized by
high rates of CO2 uptake and net primary productivity (NPP) over their short growing
seasons. Although certain croplands may physically resemble grasslands (i.e.
com-pared to forests), they differ substantially in terms of seasonality, phenology and
phys-iology, and harvested products, which can account for 40–60% of the above ground
20
biomass (Hay, 1995; Prince et al., 2001; Rao et al., 2002; Heard, 2004) that is ex-ported after the crop reaches maturity. Therefore models that simulate agricultural ecosystems should have a good representation of the crop phenology and physiology that are associated with the unique properties of these ecosystems.
Most of the existing models for simulating phenology, physiology, growth, carbon,
25
nutrient and water fluxes of specific crops, are complex, process-based models and
have used different strategies in simulating cropland dynamics. For instance, Gervois
BGD
6, 1903–1944, 2009Predicting cropland carbon fluxes with
SiBcrop
E. Lokupitiya et al.
Title Page
Abstract Introduction
Conclusions References
Tables Figures
◭ ◮
◭ ◮
Back Close
Full Screen / Esc
Printer-friendly Version
Interactive Discussion
atmosphere scheme of an existing dynamic global vegetation model (ORCHIDEE), to improve the carbon and water exchanges from croplands predicted by the latter model. Similarly, the suite of CROPGRO and CERES models (e.g., Jones and Kiniry, 1986; Kiniry, 1991; Ritchie, 1991; Boote et al., 1998) were developed to simulate crop-specific detailed physiology and phenology of several cereals, legume and other crops. These
5
models have detailed physiology, represented by algorithms for estimating photosyn-thesis, dry matter partitioning, water, and energy fluxes from crop vegetation. Recent work at the National Center for Atmospheric Research (NCAR) includes the addition of crop-related information (i.e. planting, allocation, phenology, etc.) from Agro-IBIS model (i.e. a process-based, terrestrial ecosystem model; Kucharik and Byre, 2003) to
10
improve the cropland representation by the land surface parameterization in the Com-munity Land Model (CLM; S. Levis, personal communication, 2008). The above models have complex physiology and built in phenology mostly governed by temperature (i.e. thermal time or growing degree days).
The Simple Biosphere model (SiB) has been used in estimating land atmosphere
ex-15
changes at both global and regional scales (Sellers et al., 1996a, b; Baker et al., 2008). SiB simulates the biological processes of photosynthesis and respiration and the phys-ical processes of turbulent transport between the land surface and the boundary layer. Biophysical models such as SiB were originally developed to estimate surface fluxes of latent heat, sensible heat, and momentum in General Circulation Models (Sellers et al.,
20
1986, 1992, 1994, 1997; Los, 1998). The ecosystem fluxes are estimated from leaf-level calculations using scaling assumptions (Sellers et al., 1992) based on nutrient distribution in the canopy.
Originally, planting and harvest events and the presence of alternating crops, etc., were not well represented in SiB. The basis for carbon, moisture, and energy fluxes
25
BGD
6, 1903–1944, 2009Predicting cropland carbon fluxes with
SiBcrop
E. Lokupitiya et al.
Title Page
Abstract Introduction
Conclusions References
Tables Figures
◭ ◮
◭ ◮
Back Close
Full Screen / Esc
Printer-friendly Version
Interactive Discussion
of crop presence in the field and that predicted by the NDVI, and the time
composit-ing unrealistically extends the growcomposit-ing season. Any effects from partly-cloudy pixels,
aerosols, and smoke, etc., on NDVI, are also reflected in the predicted LAI and fPAR. Compositing also occurs in space as well as time, leading to misrepresentation be-tween the pixel used for the NDVI and the actual conditions in the field. The NDVI
5
and the respiration formulation does not account for crop harvest, forcing an annually balanced carbon budget, when in reality much of the biomass is removed from the site. The result is unrealistic simulated biomass and carbon fluxes, indicating the need for a new crop phenology scheme to reflect highly managed crop ecosystems.
To improve the functionality of SiB over cropland ecosystems, we developed and
10
evaluated offline crop-specific phenology (and physiology) models for major C3 and
C4 crops. We coupled these models with SiB, to replace the use of NDVI in predict-ing LAI and improve the accuracy of the predicted fluxes by SiB. The new model is referred to as SiBcrop. The climate driven dynamic phenology scheme within SiBcrop
simulates the daily biomass in different plant pools, LAI, and specific events during
15
crop growth cycle such as planting, emergence, vegetative and reproductive growth stages (Fehr et al., 1971; Ritchie et al., 1992, 1996), harvesting, etc. We evaluated the performance of SiBcrop for corn and soybean, by using observed data at two agricul-tural eddy covariance flux tower sites in the US Midwest, which have a good record of these crops grown in rotation: Bondville, Illinois (Meyers and Hollinger, 2004), and
20
Mead, Nebraska (Suyker et al., 2004; Verma et al., 2005). We also evaluated the per-formance of SiBcrop for wheat, using observed data from the Southern Great Plains eddy covariance flux tower site (Fischer et al., 2007) under the Atmospheric Radiation Measurement (ARM) program, in Oklahoma; currently this site, known as ARM-SGP, is the only active wheat site under the AmeriFlux program.
BGD
6, 1903–1944, 2009Predicting cropland carbon fluxes with
SiBcrop
E. Lokupitiya et al.
Title Page
Abstract Introduction
Conclusions References
Tables Figures
◭ ◮
◭ ◮
Back Close
Full Screen / Esc
Printer-friendly Version
Interactive Discussion
2 Materials and methods
2.1 Simple biosphere model
The parameterization of photosynthetic carbon assimilation in SiB is based on enzyme kinetics originally developed by Farquhar et al. (1980), and is linked to stomatal con-ductance and thence to the surface energy budget and atmospheric climate (Collatz
5
et al., 1991, 1992; Sellers et al., 1996a; Randall et al., 1996). The model has been updated to include prognostic calculation of temperature, moisture, and trace gases in the canopy air space, and the model has been evaluated against eddy covariance measurements at a number of sites (Baker et al., 2003; Hanan et al., 2004; Vidale and St ¨ockli, 2005; Philpott et al, 2007). SiB has been coupled to the Regional
Atmo-10
spheric Modeling System (RAMS) and used to study PBL-scale interactions among
carbon fluxes, turbulence, and CO2 mixing ratio (Denning et al., 2003) and
regional-scale controls on CO2variations (Nicholls et al., 2004; Corbin et al., 2008; Wang et al.,
2007). Other recent improvements include biogeochemical fractionation and recycling of stable carbon isotopes (Suits et al., 2005), improved treatment of soil hydrology
15
and thermodynamics, and the introduction of a multilayer snow model based on the Community Land Model (Dai et al., 2003).
The current version (version 3.0) of SiB (i.e. SiB3) requires the vegetation state, vegetation type, soil characteristics, and weather data as input data. The vegetation state refers to time-dependent properties such as Leaf Area Index (LAI), aerodynamic
20
roughness length, and absorbed fraction of incident visible light (fPAR). The vegeta-tion type determines the physical characteristics of the canopy that do not vary with time, such as the canopy height, leaf transmittance, and photosynthetic capacity (Sell-ers et al., 1996b). Soil type determines soil hydraulic and thermal properties (Clapp and Hornberger, 1978). Weather data consists of temperature, wind speed,
precipita-25
tion (convective and stratiform), and down-welling radiation (shortwave and longwave, direct and diffuse).
sens-BGD
6, 1903–1944, 2009Predicting cropland carbon fluxes with
SiBcrop
E. Lokupitiya et al.
Title Page
Abstract Introduction
Conclusions References
Tables Figures
◭ ◮
◭ ◮
Back Close
Full Screen / Esc
Printer-friendly Version
Interactive Discussion
ing (Sellers et al., 1996b). At global scale, this approach allows realistic simulation of spatial and temporal variations in vegetation cover and state (Denning et al., 1996a, b; Schaefer et al., 2002, 2005; Baker et al., 2008). At the underlying pixel scale, however, phenology products derived from satellite data must be heavily smoothed to remove dropouts and artifacts introduced by frequent cloud cover. An inevitable
5
trade-offbetween cloud-induced “noise” in the leaf area and time compositing
system-atically stretches the seasonal cycle by choosing data late in each compositing period in spring, and early in each composite in fall. Therefore, in this study, we have ad-dressed this problem, by developing and testing a prognostic phenology sub model for SiB, rather than using satellite data for specifying crop phenology, while incorporating
10
better parameterization for cropland ecosystems.
We modified the parameters within SiB to better represent soybean (Glycine max
L.; C3), maize (Zea mays L.; C4), and wheat (Triticum aestivum L.; C3), the
dom-inant crops in the US mid western region. Crop specific information and data from past literature were used in modifying the existing parameter values (Table 1). We also
15
modified the algorithm for respiration control, to allow for harvest removal. In SiB, an annual respiring carbon pool is calculated assuming that carbon in the total net photo-synthetic assimilation (i.e. gross photosynthesis – canopy maintenance respiration) is added to, and partitioned among the litter and soil layers, and respired within a year, causing an overall annual zero net ecosystem exchange. We modified the annual net
20
photosynthetic assimilation carbon added on the ground (i.e. within different litter and
soil layers), to include only the fraction of carbon left after the removal of the harvest (Table 1). We also set the physiological fractions (C3 vs. C4) of the crops in such a way that it could represent any crop rotation, where each subsequent term’s crop is planted on the residue of the previous crop.
25
2.2 Phenology in SiBcrop
BGD
6, 1903–1944, 2009Predicting cropland carbon fluxes with
SiBcrop
E. Lokupitiya et al.
Title Page
Abstract Introduction
Conclusions References
Tables Figures
◭ ◮
◭ ◮
Back Close
Full Screen / Esc
Printer-friendly Version
Interactive Discussion
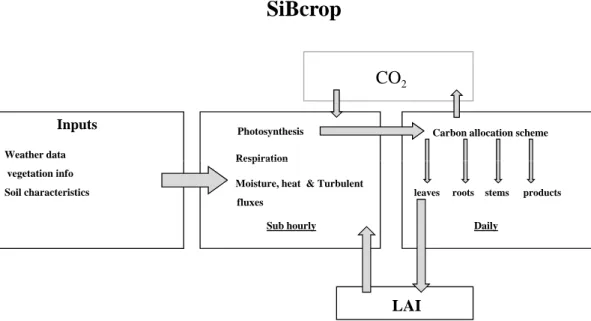
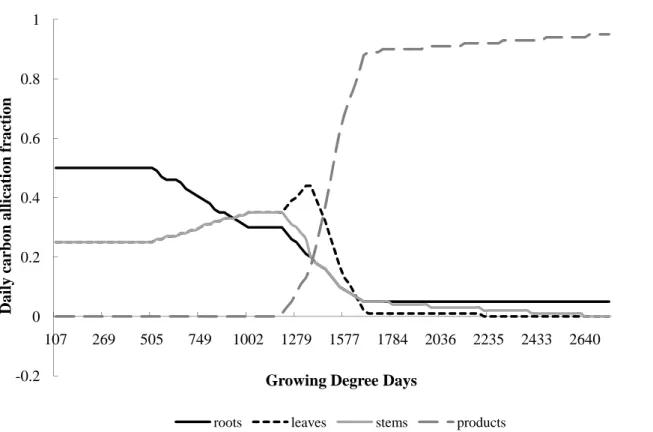
SiBcrop (Fig. 2). The model allocates sub hourly photosynthetic carbon to four different
plant pools (leaves, stems, roots and products (flowers, grain, and pods) depending on seasonal development. The daily carbon allocation to leaves was used to update LAI, which was then used to calculate photosynthesis during the following day. We assumed that the crop plants were not limited by nitrogen and other nutrients, as they were
5
well fertilized (SiB has indirect representation of nitrogen limitation through Rubisco dynamics within the photosynthetic mechanism). The parameters and functions used
in the phenology submodel were specific for different crops, growth stages and plant
pools.
2.2.1 Detailed scheme
10
Planting dates for crops were set at the seventh consecutive day on which the air tem-perature remained above a crop-specific optimal temtem-perature for germination; planting date was readjusted if the temperature dropped below a certain threshold after the initial 7-day period (Pedersen, 2003; Pedersen and Lauer, 2004; USDA, 1997). Plant emergence, subsequent growth stages and phenology events were set based on
ac-15
cumulated growing degree days (Eq. 1) and the number of days since planting (Taylor et al., 1982; Wells et al., 1986; Ritchie et al., 1996; Heard, 2004).
GDD=X(Tmean−Tbase) (1)
whereGDD is the accumulated daily growing degree days; Tmeanis the average daily
temperature (◦C);Tbase is the base temperature (10◦C for corn and soybean, and 0◦C
20
for winter wheat), above which the growing degree days start to accumulate (there is no accumulation of GDDs below the base temperature or above an optimal temperature,
which is 30◦C for maize and soybean, and 26◦C for winter wheat; Neild and Newman,
1986; McMaster and Wilhelm, 1998; Cornell University Cooperative Extension, 2008).
In the earliest stages of plant growth, photosynthesis is insufficient to support the
25
BGD
6, 1903–1944, 2009Predicting cropland carbon fluxes with
SiBcrop
E. Lokupitiya et al.
Title Page
Abstract Introduction
Conclusions References
Tables Figures
◭ ◮
◭ ◮
Back Close
Full Screen / Esc
Printer-friendly Version
Interactive Discussion
The initial biomass values at emergence (Green and Sudia, 1969; Blum et al., 1980; Smiciklas et al., 1992; Richardson and Bacon, 1993; Pinhero and Fletcher, 1994; Hameed et al., 2003) were set considering the average planting density based on the plant and row spacing typical for each crop. Starting from the day of emergence, a daily LAI value was estimated based on leaf carbon (details follow), for deriving fPAR and
es-5
timating sub hourly photosynthetic assimilate, respiratory carbon (i.e. both ground and canopy respiration) and other fluxes during the following day. During the early phase of vegetative development, in which the carbon stored in the seed is utilized for growth (Peterson et al., 1989; McWilliams et al., 1999; Nielsen, 2007), the daily biomass ad-dition/gain rate was set to be optimal, assuming that the seedling is not nutrient limited
10
and that growth is dependent on the temperature and moisture availability (2). The growth rate followed a linear ramp during the initial seedling development.
Md ≈Minit+
t∗ (Mmaxτ −Minit)
seed
∗CM ∗CT (2)
where Md is the daily biomass carbon (C) addition/gain rate in the seedling during
the initial phase (i.e. the phase in which the seed stored carbon is utilized), assuming
15
optimal nutrient availability (g C m−2d−1);tis time in days (d) between a given day in the
initial phase and the day of emergence;Mmaxis the maximum potential biomass carbon
addition rate by the end of the initial phase;Minit is the initial biomass carbon addition
rate (g C m−2d−1), estimated based on the initial biomass on the day of emergence,
assuming that carbon constitutes 45% of the biomass; τseed is the time in days (d)
20
between the emergence and the end of the early phase during which the seed stored
carbon is utilized; CM and CT are moisture and temperature dependent coefficients
(derived using the information given in de Vries et al. (1989); dimensionless).
During rest of the growth cycle after the above initial seedling phase, daily photo-synthetic assimilate (accumulated sub hourly photophoto-synthetic carbon) was used as the
25
basis in deriving the daily increments in biomass carbon.
The biomass carbon added on each day was allocated to different plant pools at
BGD
6, 1903–1944, 2009Predicting cropland carbon fluxes with
SiBcrop
E. Lokupitiya et al.
Title Page
Abstract Introduction
Conclusions References
Tables Figures
◭ ◮
◭ ◮
Back Close
Full Screen / Esc
Printer-friendly Version
Interactive Discussion
of days since emergence (Fig. 4; Puckridge, 1972; Taylor et al., 1982; Wells et al., 1986; Yamagata et al., 1987; Gregory and Atwell, 1991; Ritchie et al., 1996; Gregory et al.,1997; G ´omez-Macpherson et al., 1998; McMaster and Wilhelm, 1998; Wilhelm, 1998; Heard, 2004). At the end of each day, the carbon in each pool was calculated by subtracting the growth and maintenance respiration (details follow) from the daily
5
biomass carbon allocation; the amount of leaf carbon was used to calculate a daily LAI value (3). Senescence was induced when the leaf respiration exceeded daily leaf growth, causing biomass loss. Following the vegetative phase of growth, further allo-cation to leaves was significantly reduced during the subsequent reproductive phase of growth (Figs. 3 and 4). The crop was harvested after it reached physiological maturity,
10
allowing some field drying (Fowler, 2002; Neilson et al., 2005).
LAI=Cleaf∗2∗SLA (3)
where LAI is leaf area index (m2m−2);Cleaf is the amount of leaf carbon (g m−
2
); SLA is specific leaf area (m2g−1)
2.2.2 Estimation of growth and maintenance respiration
15
On each day, growth respiration (estimated using the combination of crop-specific
growth respiration coefficients for different plant pools) was calculated as a function
of biomass carbon allocated to each plant pool. Growth respiration in each pool was
the amount of CO2-C emitted in the formation of new crop biomass (4):
Rg(i)=alloc(i)∗coeffg(i) (4)
20
where Rg(i)=growth respiration (g CO2−C m−
2
d−1); i=1–4 (1=roots; 2=leaves;
3=stems; 4=products (e.g. flowers and grain); alloc(i)=daily biomass carbon allocation
to each plant pool (g C m−2d−1); coeffg(i)=growth respiration coefficient (g CO2−C g− 1
BGD
6, 1903–1944, 2009Predicting cropland carbon fluxes with
SiBcrop
E. Lokupitiya et al.
Title Page
Abstract Introduction
Conclusions References
Tables Figures
◭ ◮
◭ ◮
Back Close
Full Screen / Esc
Printer-friendly Version
Interactive Discussion
Maintenance respiration was calculated considering the fraction of the total non-structural carbohydrate and protein carbon (Thornton et al., 1969; Evans et al. 1984; Reekie and Redmann, 1987; Kiniry, 1993; Beauchemin et al., 1997; Allen et al.,
1998; Blum, 1998; Brouquisse et al., 1998; Collar and Askland, 2001) within diff
er-ent plant carbon pools on each day, considering a temperature depender-entQ10
func-5
tion with a base temperature of 25◦C. In deriving the maintenance respiration coeffi
-cients in terms of carbon, the carbon percentage in dry weight was considered as 45% (Buchanan and King, 1993; Bolinder et al., 1997; Vanotti et al., 1997; Burgess et al.,
2002; Torbert et al., 2004). Carbon emission as CO2-C in maintenance respiration for
each plant pool was predicted from the carbon in each plant pool and maintenance
10
respiration coefficients specific to each pool and crop type (Table 1; Eq. 5):
Rm(i)=W(i)∗coeffm(i)∗fTNC,p(i)∗Q
(T−20)/10
10 (5)
where Rm=maintenance respiration (g CO2−C m−2d−1); i=1–4 (1=roots; 2=leaves;
3=stems; 4=grain); W= cumulative carbon in the ith pool (g C m−2d−1);
tcoeffm(i)=maintenance respiration coefficient (g CO2−C emitted g−
1
carbon in theith
15
pool d−1; Table 1); f
TNC,p(i)=fraction of carbon in non structural carbohydrates (TNC)
and proteins of theith pool (this was estimated considering that TNC have 45% carbon
and proteins have 53% carbon (Hopkins et al., 1929; de Vries et al., 1989));Q10=Q10
coefficient (i.e. 2.0 (Norman and Arkebauer, 1991; Gourdriaan and Van Laar, 1994));
T=temperature (◦C).
20
2.2.3 Evaluation of the model performance
The performance of SiBcrop was evaluated by comparing the observed and predicted
CO2 fluxes and LAI at three AmeriFlux eddy covariance flux tower sites with crops:
Bondville, Illinois (IL), and Mead, Nebraska (NE), and ARM-SGP site, Oklahoma (OK).
The Bondville site (latitude 40.0061000; longitude−88.2918667; elevation 300 m) is
25
BGD
6, 1903–1944, 2009Predicting cropland carbon fluxes with
SiBcrop
E. Lokupitiya et al.
Title Page
Abstract Introduction
Conclusions References
Tables Figures
◭ ◮
◭ ◮
Back Close
Full Screen / Esc
Printer-friendly Version
Interactive Discussion
2004). It has rainfed, no-till maize and soybean crops grown in rotation (maize in odd numbered years and soybean in even numbered years). The Mead site (latitude
41.1796670; longitude−96.4396460; elevation 363 m) is located in Saunders county in
eastern Nebraska (Suyker et al., 2004). Mead has both irrigated and rainfed sites, and only the rainfed site was chosen for this study. This site has operated since 2001 also
5
with rainfed no-till maize and soybean grown in rotation. At these sites, maize plants grow to a height of 2.5 (Mead, NE) to 3.0 m (Bondville, IL), and soybean plants grow to a height of about 0.9 m.
The ARM-SGP site (latitude 36.60499954; longitude−97.48840332; elevation 300–
320 m), which has been active since 1999, is located in Grant county, Oklahoma. This
10
site has winter wheat as the main crop, in addition to some pasture and summer crops such as corn, soybean, and sorghum (Fischer et al., 2007). For the current study, the
years which exclusively had the winter wheat crop with recorded observed CO2 flux
measurements (i.e. end of 2002–2004) were chosen to evaluate the performance of SiBcrop for wheat. Wheat plants at this rain fed site grow to a height of about 0.5 m.
15
SiBcrop could be run at any spatial resolution, with the availability of suitable weather data. For this study we used a time step of 30 min. Each eddy covariance site was simulated as a single homogeneous spatial unit for periods with observed data, using meteorological forcing from 6-hourly NCEP-DOE Reanalysis 2 (Kalnay et al., 1996) weather data, and crop information as given in the AmeriFlux website. Soil texture was
20
derived from the NRCS State Soil Geographic (STATSGO) database. For the control runs with original SiB, AVHRR NDVI data interpolated from monthly Global Inventory of Modeling and Mapping Studies, version “g” (GIMMSg; Tucker et al., 2005) data were used in estimating LAI and fPAR.
Sub hourly, diurnal, and annual net ecosystem exchange (NEE; i.e.
respiration-25
consider-BGD
6, 1903–1944, 2009Predicting cropland carbon fluxes with
SiBcrop
E. Lokupitiya et al.
Title Page
Abstract Introduction
Conclusions References
Tables Figures
◭ ◮
◭ ◮
Back Close
Full Screen / Esc
Printer-friendly Version
Interactive Discussion
ing the presence of single crop (winter wheat) and crop rotation (i.e. alternating maize and soybean crops as at Bondville and Mead sites) in the field.
3 Results and discussion
3.1 SiBcrop simulations for summer crops (corn and soybean)
SiBcrop was able to predict the planting and harvest events and the changing phases
5
within crop development and growth cycle, in terms of LAI, biomass carbon, and carbon fluxes for these sites, with more accuracy than the original SiB.
The maximum LAI predicted for maize in different years ranged between 5.0 m2m−2
and 6.3 m2m−2 at Bondville, and between 5.0 m2m−2 and 6.0 m2m−2 at Mead. The
maximum LAI predicted for soybean ranged between 4.6 and 5.7 m2m−2at Bondville,
10
and between 3.9 and 5.3 m2m−2 at Mead. These predicted ranges were acceptable
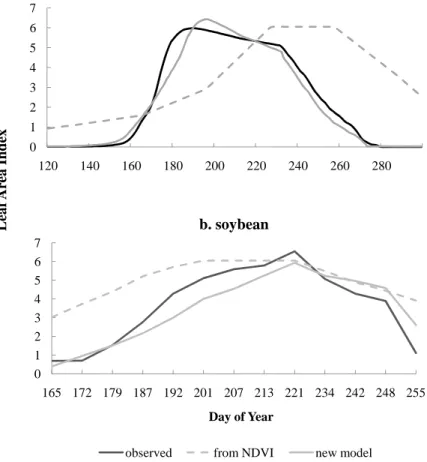
based on the observed ranges at these two sites, except that the model over predicted the maximum LAI observed for Mead during certain soybean years. For instance, in 2002, the maximum LAI observed at Mead site was 3.0, while the mean LAI predicted by SiBcrop was 3.9. Compared to the LAI estimates based on NDVI in original SiB,
15
SiBcrop predicted LAI values that had better synchrony with the observed LAI in the field (Fig. 5). In 1999, the NDVI-based LAI was higher at the initial phase of the growing season and peaked at a later time than the LAI observed in the field and that predicted by SiBcrop. This pattern of variation in the remotely sensed NDVI could be attributed to the mixed pixels (in the early phase), cloud contamination and the interpolation
20
scheme, as described before.
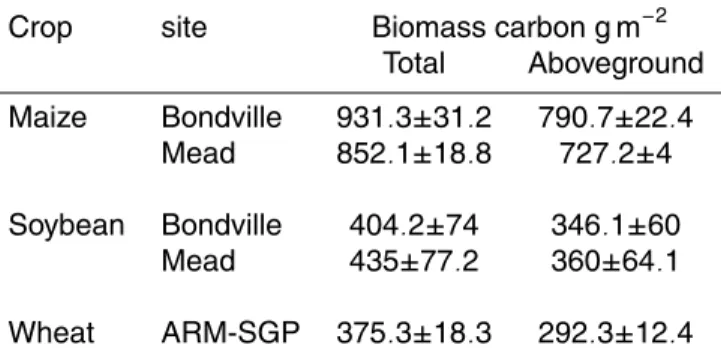
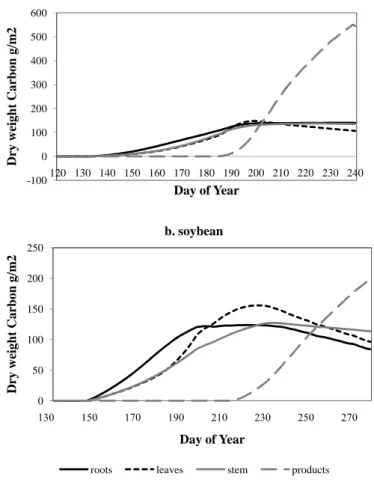
In addition to the prognostic equations in SiB, SiBcrop predicted biomass carbon in
different plant pools, LAI, etc., from the phenology scheme by the end of each day. The
variation in carbon in different plant pools until physiological maturity at Bondville site
is illustrated in Fig. 6. Among the different plant pools, the highest amount of carbon
25
BGD
6, 1903–1944, 2009Predicting cropland carbon fluxes with
SiBcrop
E. Lokupitiya et al.
Title Page
Abstract Introduction
Conclusions References
Tables Figures
◭ ◮
◭ ◮
Back Close
Full Screen / Esc
Printer-friendly Version
Interactive Discussion
estimated for maize was much higher than that for soybean (Table 2). Maize in both Bondville and Mead sites had 55–60% of the total carbon in the products at harvest (grains, cobs, and husks), while roots, leaves and stems shared the remainder of the carbon. By converting the biomass carbon to biomass (by multiplying by 2.2) and considering a grain weight of about 80 percent of the total products at harvest (Heard,
5
2004), we estimated a Harvest Index that ranged between 0.52 and 0.55, for maize at both sites. These results are in agreement with the reported range (i.e. 0.4–0.58) by Prince et al. (2001) and Heard (2004; Harvest Index 0.54). The average root:shoot ratio estimated at harvest across the maize years was 0.18. This was similar to the average root:shoot ratio observed by Anderson (1988).
10
The aboveground and total biomass predicted for soybean at Mead was slightly higher compared to Bondville (Table 2). The predicted biomass of products (seeds and pods) at harvest ranged between 44–49% and 38–43% of the total soybean biomass
(across different years) at Bondville and Mead, respectively. Considering that the 70%
of the product at harvest (i.e. beans and pods together) was beans (Hanway and
We-15
ber, 1971a, b; Buyanovsky and Wagner, 1986), we estimated a Harvest Index that ranged between 0.37 and 0.41 during the years with soybean. This Harvest Index range fell within the range (i.e. 0.37–0.45) reported by Rao et al. (2002) and that re-ported by Spaeth et al. (1984; Harvest Index range 0.25–0.6). The estimated average root:shoot ratio soybean at harvest was 0.18. This ratio fell within the range (of 0.14–
20
0.19) observed by Allmaras et al. (1975), and it was slightly higher than the value of 0.15 observed by Silvius et al. (1977) for non-stressed plants, and the highest value (i.e. 0.126), among the values reported by Taylor et al. (1982).
When the biomass carbon was converted to the biomass in each plant pool, we found that the model predicted values for both crops were acceptable based on the values
25
found in certain past studies (Taylor et al, 1982; Ritchie et al., 1996; Heard, 2004). For instance, the average biomass carbon predicted by SiBcrop for maize leaves,
stems, and products at harvest for Mead site were 103.5, 136.7, and 487.1 g C m−2,
BGD
6, 1903–1944, 2009Predicting cropland carbon fluxes with
SiBcrop
E. Lokupitiya et al.
Title Page
Abstract Introduction
Conclusions References
Tables Figures
◭ ◮
◭ ◮
Back Close
Full Screen / Esc
Printer-friendly Version
Interactive Discussion
in maize leaves, stems, and products according to Heard (2004) were 92.2, 120.3,
and 476.7 g C m−2
, respectively. Similarly, the average biomass carbon predicted by SiBcrop for soybean roots, leaves, stems, and products at harvest for Bondville site
were 58, 44.5, 115.4, and 186.2 g C m−2, respectively. Calculated average carbon (i.e.
45% of dry weight) for rain fed soybean leaves, stems, and products based on the dry
5
weights reported by Taylor et al. (1982) were 35.3, 111.0 and 180.0 g C m−2,
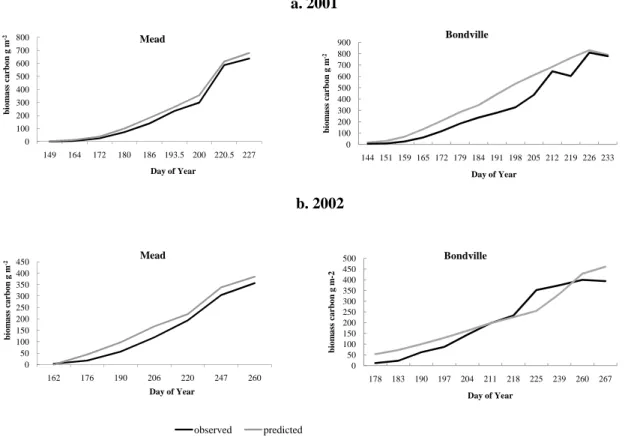
respec-tively. Compatibility of the predicted biomass values by SiBcrop were further tested by the comparisons against the measured total aboveground biomass (converted to car-bon) for the two sites. Although the biomass carbon values in both crops were closely simulated, predicted values were slightly higher than the observed biomass at Mead
10
site and mixed results were found for Bondville (Fig. 7).
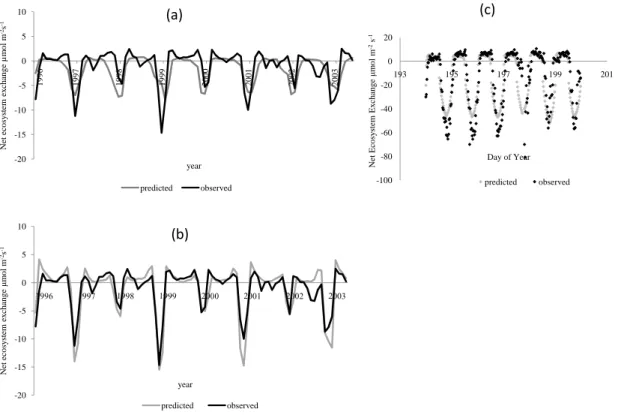
Seasonal and interannual variation in carbon fluxes of cropland systems were poorly predicted in the control simulations (Fig. 8a). However, SiBcrop clearly showed the rotation of maize (C4) and soybean (C3) in the field, with maize having a much higher carbon uptake. SiBcrop also better predicted the seasonality associated with the crop
15
growth cycle (Fig. 8b). Similar results were observed for Mead, as well (Fig. 11b). With original SiB, there was no synchrony between the NEE curves of the predicted and observed data (Figs. 8a and 11a). However, with further modification of certain SiB parameter values (Table 1), and by using predicted phenology, we were able to improve the model performance significantly. Considering the presence of only maize
20
during odd numbered years (as in the field) and increase of Vmaxand high temperature
inhibition for maize, allowance of removal of harvest, and incorporating new phenology scheme in SiBcrop helped improve the magnitude of predicted NEE and the compati-bility with observed data in the field for maize (Figs. 9b and 11c). Similarly, considering the presence of only soybean in the field during even numbered years and predicting
25
BGD
6, 1903–1944, 2009Predicting cropland carbon fluxes with
SiBcrop
E. Lokupitiya et al.
Title Page
Abstract Introduction
Conclusions References
Tables Figures
◭ ◮
◭ ◮
Back Close
Full Screen / Esc
Printer-friendly Version
Interactive Discussion
simulation.
The highest NEE values predicted by SiBcrop for maize were more than 80 percent of the observed values in the field. The maximum predicted carbon drawdown by maize
as represented in NEE, ranged between 15 and 20 µmol m−2s−1 in the annual cycles
based on monthly averages, and∼60 µmol m−2s−1at sub hourly scale (Figs. 8 and 9).
5
In the diurnal cycle, the highest predicted NEE occurred between 12 and 3 p.m. NEE
was positive before∼7 a.m., since it was dominated by respiration (Figs. 8c and 11d).
The predicted carbon fluxes for maize were mostly comparable to the observed fluxes, and occasionally there were outliers in the observed data as well, which were more noticeable in the data at sub hourly time scale.
10
The maximum NEE observed and predicted by SiBcrop for the soybean years was
∼5 µmol m−2s−1 in the annual cycles based on monthly averages (Fig. 8b), and the
maximum values at sub hourly scale were between 15 and 20 µmol m−2s−1 in both
sites; however, observed maximum was mostly between 20 and 30 µmol m−2s−1 at
sub hourly scale (Fig. 10). Results showed the lower carbon uptake due to lower
pho-15
tosynthetic efficiency in soybean, compared to maize, although soybean has a higher
Vmax. The predicted NEE values for soybean were still less than the observed values.
3.2 Simulations for winter wheat
The average maximum Leaf Area Index predicted for winter wheat at ARM-SGP site
was 3.0 m2m−2, and predicted LAI was within 0.5 m2m−2 compared to the observed
20
LAI (Fig. 12b). The predicted LAI had similar variation and good synchrony with the observed LAI.
The sub hourly predicted NEE for wheat followed a similar pattern of variation.
How-ever, the maximum observed diurnal NEE was mostly between 20–30 µmol m−2, while
the maximum predicted NEE was between 15 and 20 µmol m−2(Fig. 12a and d). When
25
BGD
6, 1903–1944, 2009Predicting cropland carbon fluxes with
SiBcrop
E. Lokupitiya et al.
Title Page
Abstract Introduction
Conclusions References
Tables Figures
◭ ◮
◭ ◮
Back Close
Full Screen / Esc
Printer-friendly Version
Interactive Discussion
low from planting towards the end of the year until the spring green-up in the following year, during which period the plants also undergo vernalization (i.e. cold requirement for the transition from vegetative to reproductive growth; Bierhuzen, 1973; Brooking, 1996; Ritchie, 1991). Rapid growth and higher carbon uptake (i.e. NEE) was observed after the spring green-up in the following year (Fig. 12c).
5
According to SiBcrop simulations, the average total aboveground biomass carbon
for winter wheat was 292 g m−2 (Table 2), which was consistent with the average
ob-served in the field, 270 g m−2, where the typical measurement error was about 5%. The
average harvest index based on SiBcrop runs was 0.41, while the recorded harvest in-dices for the crop usually ranged between 0.32 and 0.43 (Sharma et al., 1987; Gent
10
and Kyomoto, 1989; Prince et al., 2001). The total biomass carbon averaged over the
years with winter wheat was 375 g C m−2. Considering a 45% carbon in dry matter, this
converts to 834 g m−2dry matter. This falls within the range of total dry matter weights
given by Wilhelm (1998) for winter wheat under different tillage andnitrogen fertilization
rates (i.e. between 636 and 848 g m−2dry matter).
15
Overall, SiBcrop showed improved performance in predicting carbon fluxes on crop-lands, compared to the control simulations with original SiB. However, SiBcrop still
seems to slightly underpredict the CO2uptake at sub hourly scale, mostly by C3 crops,
although a similar pattern of variation and seasonality was seen as observed in the field. So far we have developed these phenology schemes for three main C3 and C4
20
crops, and our aim is to expand it to other major crops. Further testing of SiBcrop using
more sites at locations with different climates and weather variability is warranted. In
the future, SiBcrop will be coupled with the Regional Atmospheric Modeling System (RAMS; Pielke et al., 1992; Corbin et al., 2008), a mesoscale meteorological (non-hydrostatic) model, to estimate time-varying exchanges of carbon, water, and energy,
25
BGD
6, 1903–1944, 2009Predicting cropland carbon fluxes with
SiBcrop
E. Lokupitiya et al.
Title Page
Abstract Introduction
Conclusions References
Tables Figures
◭ ◮
◭ ◮
Back Close
Full Screen / Esc
Printer-friendly Version
Interactive Discussion
4 Conclusions
The phenology and physiology scheme we developed was simple and detailed enough to predict LAI values to be used within SiB. LAI and NEE produced by SiBcrop for maize, which is a crop with C4 physiology, were closer in value and had better syn-chrony with the observed data in the field, compared to the original SiB model in which
5
LAI (and thus carbon flux estimation) were based on the remotely sensed NDVI. Al-though the same trend was obvious for the C3 crops, soybean and wheat, the max-imum sub hourly NEE predicted for soybean was 20–30% lower than the maxmax-imum NEE observed in the field.
Since SiB’s complex, process-based equations, parameters, and stress factors, etc.,
10
are involved in the derivation of daily carbon and energy fluxes, such a straight forward and relatively simple phenology and physiology scheme seemed to work well in reach-ing our objective (i.e. to improve the prediction of carbon fluxes from croplands). The overall validity of the phenology scheme was further confirmed by the LAI and biomass data from field observations and past studies.
15
Overall, compared to the control, SiBcrop better predicted spring onset of growth (i.e. prediction of planting dates and the crop growth following spring onset), which
improved the estimate of CO2uptake, especially by maize. The advantage of the new
phenology scheme within SiBcrop includes the prediction of biomass which can be evaluated against crop yields, realistic treatment of fine-scale heterogeneity of agro
20
ecosystems, and eventual prediction of future fluxes, for which no satellite data are available.
Acknowledgement. This research was supported by the National Institute for Climate Change
Research (NICCR), under Contract No MTU 050516Z14, and the Department of Energy (DoE) under contract No DE-FG02-06ER64317. The winter wheat data were collected and made
25
BGD
6, 1903–1944, 2009Predicting cropland carbon fluxes with
SiBcrop
E. Lokupitiya et al.
Title Page
Abstract Introduction
Conclusions References
Tables Figures
◭ ◮
◭ ◮
Back Close
Full Screen / Esc
Printer-friendly Version
Interactive Discussion
References
Ainsworth, E. A., Rogers, A., Nelson, R., and Long, S. P.: Testing the “source-sink” hypothesis of down-regulation of photosynthesis in elevated [CO2] in the field with single gene substitu-tions in Glycine max, Agr. Forest. Meteorol., 122, 85–94, 2004.
Allen, L. H., Bisbal, E. C., and Boote, K. J.: Nonstructural carbohydrates of soybean plants
5
grown in subambient and superambient levels of CO2, Photosynth. Res., 56, 143–155, 1998. Allmaras, R. R., Nelson, W. W., and Voorhees, W. B.: Soybean and corn rooting in southwestern
Minnesota: II. Root distribution and related water intake, Soil Sci. Soc. Am. Pro., 39, 771– 777, 1975.
Anderson, E. L.: Tillage and N fertilization effects on maize root growth and root: shoot ratio,
10
Plant Soil, 108, 245–251, 1988.
Arora, V. K.: Simulating energy and carbon fluxes over winter wheat using coupled land surface and terrestrial ecosystem models, Agr. Forest. Meteorol., 118, 21–47, 2003.
Baker, I. T., Denning, A. S., Hanan, N., Prihodko, L., Vidale, P. L., Davis, K., and Bakwin, P.: Simulated and observed fluxes of sensible and latent heat and CO2 at the WLEF-TV Tower
15
using SiB2.5, Glob. Change Biol., 9, 1262–1277, 2003.
Baker, I. T., Denning, A. S., Prihodko, L., Schaefer, K., Berry, J. A., Collatz, G. J., Suits, N. S., Stockli, R., Philpott, A., and Leonard, O.: Global Net Ecosystem Exchange (NEE) of CO2, Available at: http://www.daac.ornl.gov/, 2008.
Beauchemin, K. A., Rode, L. M., and Yang, W. Z.: Effects of nonstructural carbohydrates and
20
source of cereal grain in high concentrate diets of dairy cows, J. Dairy Sci., 80, 1640–1650, 1997.
Bernacchi, C. J., Morgan, P. B., Ort, D. R., and Long, S. P.: The growth of soybean under free air [CO2] enrichment (FACE) stimulates photosynthesis while decreasing in vivo Rubisco capacity, Planta, 220, 434–446, 2005.
25
Bierhuizen, J. F.: The effect of temperature on plant growth, development, and yield, Proc. Uppsala Symp. Unesco 1970, 89–98, 1973.
Blum, A.: Improving wheat grain filling under stress by stem reserve mobilization, Euphytica, 100, 77–83, 1998.
Blum, A., Sinmena, B., and Ziv, O.: An evaluation of seed and seedling drought tolerance
30
screening tests in wheat, Euphytica, 29, 727–736, 1980.
BGD
6, 1903–1944, 2009Predicting cropland carbon fluxes with
SiBcrop
E. Lokupitiya et al.
Title Page
Abstract Introduction
Conclusions References
Tables Figures
◭ ◮
◭ ◮
Back Close
Full Screen / Esc
Printer-friendly Version
Interactive Discussion
inputs in soils for cereal crops, Agr. Ecosyst. Environ., 63, 61–67, 1997.
Boote, K. J., Jones, J. W., and Hoogenboom, G.: Simulation of crop growth: CROPGRO model, in: Agricultural systems modeling and simulation, edited by: by Peart, R. M. and Curry, R. B., Marcel Dekker Inc., New York, NY, 651–692, 1998.
Brooking, I. A.: Temperature response of vernalization in wheat: a developmental analysis,
5
Ann. Bot. London, 78, 507–512, 1996.
Brouquisse, R., Gaudillere, J., and Raymond, P.: Induction of a carbon-starvation-related pro-teolysis in whole maize plants submitted to light/dark cycles and to extended darkness, Plant Physiol., 117, 1281–1291, 1998.
Buchanan, M. and King, L. D.: Carbon and phosphorus losses from decomposing crop residues
10
in no-till and conventional till agroecosystems, Agron. J., 85, 631–638, 1993.
Burgess, M. S., Mehuys, G. R., and Madramootoo, C. A.: Nitrogen dynamics of decomposing corn residue components under three tillage systems, Soil Sci. Soc. Am. J., 66, 1350–1358, 2002.
Buyanovsky, G. A. and Wagner, G. H.: Post-harvest residue input to cropland, Plant Soil, 93,
15
57–65, 1986.
Clapp, R. B. and Hornberger, G. M.: Empirical equations for some soil hydraulic properties, Water Resour. Res., 14.4, 601–604, 1978.
Collar, C. and Askland, G.: Harvest stage effects on yield and quality of winter forage, Proceed-ings of the 31st California alfalfa and forage symposium: 12–13 December, 2001, Modesto,
20
CA, UC Cooperative Extension University of California, Davis, 2001.
Collatz, G. J., Ball, J. T., Griver, C., and Berry, J. A.: Physiological and environmental regulation of stomatal conductance, photosynthesis, and transpiration: A model that includes a laminar boundary layer, Agr. Forest. Meteorol., 54, 107–136, 1991.
Collatz G. J., Ribas-Carbo, M., and Berry, J. A.: Coupled photosynthesis stomatal conductance
25
model for leaves of C4plants, Aust. J. Plant Physiol., 19, 519–538, 1992.
Corbin, K. D., and Denning , A.S., Lu, L., and Wang, J. W., and Baker, I. T.: Possible represen-tation errors in inversions of satellite CO2retrievals, J. Geophys. Res. Atmos., 113, D02301, doi:10.1029/2007JD008716, 2008.
Cornell University Cooperative Extension: 2008 Cornell guide for integrated field crop
man-30
agement. Cornell University Cooperative extension. Availale at: http://ipmguidelines.org/ FieldCrops/content/CH02/default.asp, 2008.
BGD
6, 1903–1944, 2009Predicting cropland carbon fluxes with
SiBcrop
E. Lokupitiya et al.
Title Page
Abstract Introduction
Conclusions References
Tables Figures
◭ ◮
◭ ◮
Back Close
Full Screen / Esc
Printer-friendly Version
Interactive Discussion
Dirmeyer, P., Houser, P., Niu, G., Oleson, K., Schlosser, A., and Yang, Z. L.: The common land model (CLM), B. Am. Meteorol. Soc., 84, 1013–1023, 2003.
Denning A. S., Collatz, G. J., Zhang, C.G, Randall, D. A., Berry, J. A., Sellers, P. J., Colello, G. D., and Dazlich, D. A.: Simulations of terrestrial carbon metabolism and atmo-spheric CO2 in a general circulation model, Part 1: Surface carbon fluxes, Tellus B, 48(4),
5
521–542, 1996a.
Denning, A. S., Randall, D. A., Collatz, G. J., and Sellers, P. J.: Simulations of terrestrial car-bon metabolism and atmospheric CO2 in a general circulation model, Part 2: Spatial and temporal variations of atmospheric CO2, Tellus B, 48, 543–567, 1996b.
Denning, A. S., Nicholls, M., Prihodko, L., et al.: Simulated variations in atmospheric CO2over
10
a Wisconsin forest using a coupled ecosystem-atmosphere model, Glob. Change Biol., 9(9), 1241–1250, 2003.
de Noblet-Ducoudr ´e, N., Gervois, S., Ciais, P., Biovy, N., Brissson, N., Seguin, B., and Per-rier, A.: Coupling the Soil-Vegetation Atmosphere Transfer Scheme ORCHIDEE to the agron-omy model STICS to study the influence of croplands on the European carbon and water
15
budgets, Agronomie, 24, 397–407, 2004.
de Vries, P. F. W. T., Jansen, D. M., Ten Berge, H. F. M., and Bakema, A.: Simulation of ecophys-iological processes of growth in several annual crops. Simulation Monographs, Wageningen (Netherlands): Pudoc. 271 pp, 1989.
Evans, L. S., Dimitriadis, L., and Hinkley, D. A.: Seed protein quantities of field-grown soybeans
20
exposed to simulated acidic rain, New Phytol., 97, 71–76, 1984.
Farquhar, G. D., Caemmerer, S. V., and Berry, J. A.: A biochemical-model of photosynthetic CO2assimilation in leaves of C-3 species, Planta, 149, 78–90, 1980.
Fehr, W. R., Caviness, C. E., Burmood, D. T., and Pennington, J. S.: Stage of development descriptions for soybeans, Glycine max (L.) Merrill, Crop Sci., 11, 929–931, 1971.
25
Fischer, M. L., Billesbach, D. P., Berry, J. A., Riley, W. J., and Torn, S.: Spatiotemporal variations in growing season exchanges of CO2, H2O, and sensible heat in agricultural fields of the southern great plains, Earth Interact., 11, E1231, doi:10.1175/E1231.1, 2007.
Fowler, D. B.: Harvesting, Grain Drying and Storage. Winter wheat cereal production. Available at: http://www.usask.ca/agriculture/cropsci/winter cereals/, 2002.
30
BGD
6, 1903–1944, 2009Predicting cropland carbon fluxes with
SiBcrop
E. Lokupitiya et al.
Title Page
Abstract Introduction
Conclusions References
Tables Figures
◭ ◮
◭ ◮
Back Close
Full Screen / Esc
Printer-friendly Version
Interactive Discussion
Gent, M. P. N. and Kyomoto, R. K.: Assimilation and distribution of photosynthate in winter wheat cultivars differing in harvest index, Crop Sci., 29, 120–125, 1989.
Gomez-Macpherson, H., Richards, R. A., and Masle, J.: Growth of near-isogenic wheat lines differing in development – plants in a simulated canopy, Ann. Bot. London, 82, 323–330, 1998.
5
Goudriaan, J. and Van Laar, H. H.: Modelling potential crop growth processes, Kluwer Aca-demic Publishers, Boston, 1994.
Green, D. G. and Sudia, T. W.: Germination and seedling development of soybean in a carbon dioxide- deficient atmosphere, Am. J. Bot., 56(9), 1018–1022, 1969.
Gregory, P. J. and Atwell, B. J.: The fate of carbon in pulse-labelled crops of barley and wheat,
10
Plant Soil, 136, 205–213, 1991.
Gregory, P. J., Palta, J. A., and Batts, G. R.: Root systems and root:mass ratio – carbon allo-cation under current and projected atmospheric conditions in arable crops, Plant Soil, 187, 221–228, 1997.
Hameed, A., Malik, S. A., Iqbal, N., Arshad, R., and Farooq, S.: Influence of hydrogen peroxide
15
on initial leaf and coleoptiles growth in etiolated wheat (Triticum aestivumL) seedlings, Asian J. Plant Sci., 2(15–16), 1121–1125, 2003.
Hanan, N. P., Berry, J. A., Verma, S. B., Walter-Shea, E. A., Suyker, A. E., Burba, G. G., and Denning, A. S.: Model analyses of biosphere-atmosphere exchanges of CO2, water and energy in Great Plains tallgrass prairie and wheat ecosystems, Agr. Forest. Meteorol., 131,
20
162–179, 2004.
Hanway, J. J. and Weber, C. R.: Dry matter accumulation in eight soybean (Glycine max (L.) Merrill) varieties, Agron. J., 63, 227–230, 1971a.
Hanway J. J. and C. R. Weber, C. R.: Dry matter accumulation in soybean (Glycine max (L.) Merrill) plants as influenced by N, P, and K fertilization, Agron. J., 63, 263–266, 1971b.
25
Harley, P. C., Weber, J. A., and Gates, D. M.: Interactive effects of light, leaf temperatue, CO2 and O2on photosynthesis in soybean. Planta, 165, 249–263, 1985.
Hay, R. K. M.: Harvest index: a review of its use in plant breeding and crop physiology, Ann. Appl. Biol., 126, 197–216, 1995.
Heard, J.: Nutrient accumulation and partitioning by grain corn in Manitoba. Proc. of 47th
30
Annual Manitoba Society of Soil Science Meeting. Available at: http://www.gov.mb.ca/ agriculture/nsss/2004/mss601.pdf, 2004.
BGD
6, 1903–1944, 2009Predicting cropland carbon fluxes with
SiBcrop
E. Lokupitiya et al.
Title Page
Abstract Introduction
Conclusions References
Tables Figures
◭ ◮
◭ ◮
Back Close
Full Screen / Esc
Printer-friendly Version
Interactive Discussion
and dark, Planta, 85, 228–237, 1969.
Hopkins, E. W., Peterson, W. H., and Fred, E. B.: The composition of the cells of certain bacteria with special reference to their carbon and their nitrogen content, J. Biol. Chem., 85(1), 21–27, 1929.
IPCC: Climate Change 2007: Synthesis Report. Cambridge University Press, Cambridge,
5
2007.
Jones, C. A. and Kiniry, J. R.: CERES-maize: A simulation model of maize growth and devel-opment. Texas A&M Univ. Press, College Station, TX, 1986.
Kalnay, E., Kanamitsu, M., Kistler, R., Collins, W., Deaven, D., Gandin, L., Iredell, M., Saha, S., White, G., Woollen, J., Zhu, Y., Chelliah, M., Ebisuzaki, W., Higgins, W., Janowiak, J.,
10
Mo, K. C., Ropelewski, C., Wang, J., Leetmaa, A., Reynolds, R., Jenne, R., and Joseph, D.: The NCEP/NCAR 40-Year Reanalysis Project, B. Am. Meteorol. Soc., 77(3), 437–471, 1996. Kiniry, J. R.: Maize phasic development, in: Modeling Plant Soil, systems, edited by: Hanks
and Ritchie, Agron. Monogr., 31, 55–69, ASA, CSSSA, SSSA, Madison, WI, 1991.
Kiniriy, J. R.: Nonstructural carbohydrate utilization by wheat shaded during grain growth,
15
Agron. J., 85, 844–849, 1993.
Kothavala, Z., Arain, M. A., Black, T. A., and Verseghy, D.: The simulation of energy, water vapor and carbon dioxide fluxes over common crops by the Canadian Land Surface Scheme (CLASS), Agr. Forest. Meteorol., 133, 89–108, 2005.
Kucharik, C. J. and Byre, K. R.: IBIS yield and nitrate leaching predictions for Wisconsin maize
20
agroecosystems receiving varied N-fertilizer, J. Environ. Qual., 32, 247–268, 2003.
Law, R. D. and Crafts-Brandner, S. J.: High temperature stress increases the expression of wheat leaf Ribulose-1,5-Bisphosphate Carboxylase/oxygenase Activase protein, Arch. Biochem. Biophys., 386, 261–267, 2001.
Lokupitiya, E., Breidt, F. J., Lokupitiya, R., Williams, S., and Paustian, K.: Deriving
compre-25
hensive county-level crop yield and area data for US cropland. Agron J., 99(3), 673–681, 2007.
Los, S. O.: Estimation of the ratio of sensor degradation between NOAA AVHRR channels 1 and 2 from monthly NDVI composites, IEEE T. Geosci. Remote, 36(1), 206–213, 1998. McMaster, G. S., and Wilhelm, W. W.: Is soil temperature better than air temperature for
pre-30
dicting winter wheat phenology?, Agron. J., 602–607, 1998.
BGD
6, 1903–1944, 2009Predicting cropland carbon fluxes with
SiBcrop
E. Lokupitiya et al.
Title Page
Abstract Introduction
Conclusions References
Tables Figures
◭ ◮
◭ ◮
Back Close
Full Screen / Esc
Printer-friendly Version
Interactive Discussion
edu/pubs/plantsci/rowcrops/a1174/a1174.pdf, 1999.
Meyers, T. P. and Hollinger, S. E.: An assessment of storage terms in the surface energy balance of maize and soybean, Agr. Forest Meteorol., 125(1–2), 105–115, 2004.
Morgan, P. B., Bernacchi, C. J., Ort, D. R., and Long, S. P.: An in vivo analysis of the effect of season-long open-air elevation of ozone to anticipated 2050 levels on photosynthesis in
5
soybean, Plant Physiol., 135, 2348–2357, 2004.
Neild, R. E. and Newman, J. E.: Growing season characteristics and requirements in the corn Belt. National Corn Handbook NCH-40, Purdue University, West Lafeyette, IN, 1986. Nicholls, M. E., Denning, A. S., Prihodko, L., Vidale, P.-L., Davis, K., Bakwin, P.: A
multiple-scale simulation of variations in atmospheric carbon dioxide using a coupled
biosphere-10
atmospheric model, J. Geophys. Res., 109, D18117, doi:10.1029/2003JD004482, 2004. Nielsen, R.: Field Drydown of Mature Corn Grain. Corny News Network, Purdue Univ. Available
at: http://www.agry.purdue.edu/ext/corn/news/articles.05/GrainDrying-0815.html, 2005. Nielsen, R. L.: Root Development in Young Corn. Corny News Network Articles. Agronomy
Department, Purdue University. Available at: http://www.agry.purdue.edu/ext/corn/news/
15
timeless/Roots.html, 2007.
Norman, J. M. and Arkebauer, T. J.: Predicting canopy light-use efficiency from leaf character-istics. Modeling Plant Soil, systems, Agron. Monogr., 31, 125–143, 1991.
Pedersen, P.: How early can soybean be planted? Available at: http://www.ipm.iastate.edu/ ipm/icm/2003/4-14-2003/earlysoy.html, 2003.
20
Pedersen, P. and Lauer, J. G.: Soybean growth and development in various management sys-tems and planting dates, Crop Sci., 44, 508–515, 2004.
Peterson, C. M., Klepper, B., and Rickman, R. W.: Seed reserves and seedling development in winter wheat, Agron. J., 81, 245–251, 1989.
Philpott, A., Denning, A. S., Baker, I., Hanan, N., and Hargrove, W.: Simulated surface energy
25
budget at the site level in the southern Great Plains using the Simple Biosphere Model, version 3 (SiB3), J. Geophys. Res., submitted, 2008.
Pielke, R. A., Cotton, W. R., Walko, R. L., et al.: A comprehensive meteorological modeling system- RAMS, Meteorol. Atmos. Phys., 49(1–4), 69–91, 1992.
Pinhero, R. G. and Fletcher, R. A.: Paclobutrazol and ancymidol protect corn seedlings from
30
high and low-temperature stresses. Plant Growth Regul., 15(1), 47–53, 1994.
BGD
6, 1903–1944, 2009Predicting cropland carbon fluxes with
SiBcrop
E. Lokupitiya et al.
Title Page
Abstract Introduction
Conclusions References
Tables Figures
◭ ◮
◭ ◮
Back Close
Full Screen / Esc
Printer-friendly Version
Interactive Discussion
2001.
Puckridge, D. W.: Photosynthesis of wheat under field conditions. The effect of solar elevation on the distribution of photosynthetic activity within the crop canopy, Aust. J. Agric. Res., 23, 397–404, 1972.
Randall, D. A., Sellers, P. J., Berry, J. A., Dazlich, D. A., Zhang, C., Collatz, C. J., Denning, A. S.,
5
Los, S. O., Field, C. B., Fung, I., Justice, C. O., and Tucker, C. J.: A revised land surface parameterization (SiB2) for atmospheric GCMs, Part 3: The greening of the CSU GCM, J. Climate, 9, 738–763, 1996.
Rao, M. S. S., Mullinix, B. G., Rangappa, M., Cebert, E., Bhagsari, A. S., Sapra, V. T., Joshy, J. M., and Dadson, R. B.: Soybean. Genotype x environment interactions and yield
10
stability of food-grad soybean genotypes, Agron. J., 94(1), 72–80, 2002.
Reekey, E. G. and Redmann, R. E.: Growth and maintenance respiration of perennial root systems in a dry grassland dominated by Agropyron dasystachyum (Hook.) Scribn, New Phytol., 105(4), 595–603, 1987.
Richardson, M. D. and Bacon, C. W.: Cyclic hydroxamic acid accumulation in corn seedlings
15
exposed to reduced water potentials before, during and after germination, J. Chem. Ecol., 19(8), 1613–1624, 1993.
Ritchie, J. T.: Wheat phasic development, In: Hanks and Ritchie (Eds.) Modeling Plant Soil, systems. Agronomy Monographs, 31, ASA, CSSSA, SSSA, Madison, WI, 1991.
Ritchie, S. W., Hanway, J. J., and Benson, G. O.: How a corn plant develops. Special Report
20
No 48, Iowa State University Science and Technology Cooperative Extension Service. Ames, Iowa, 1992.
Ritchie, S. W., Hanway, J. J., Thompson, H. E., and Benson, G. O.: How a soybean plant devel-ops. Special Report No. 53. Iowa State University of Science and Technology Cooperative Extension Service. Ames, Iowa, 1996.
25
Schaefer, K., Denning, A. S., Suits, N., Kaduk, J., Baker, I., Los, S., and Prihodko, L.: Effect of climate on interannual variability of terrestrial CO2fluxes, Glob. Biogeochem. Cy., 16/(4), 1102, doi:10.1029/2002GB001928, 2002.
Schaefer, K., Denning, A. S., and Leonard, O.: The winter Arctic Oscillation, the timing of spring, and carbon fluxes in the northern hemisphere, Glob. Biogeochem. Cy., 19, GB3017,
30
doi:10.1029/2004GB002336, 2005.
BGD
6, 1903–1944, 2009Predicting cropland carbon fluxes with
SiBcrop
E. Lokupitiya et al.
Title Page
Abstract Introduction
Conclusions References
Tables Figures
◭ ◮
◭ ◮
Back Close
Full Screen / Esc
Printer-friendly Version
Interactive Discussion
Sellers, P. J., Berry, J. A., Collatz, G. J., Field, C. B., and Hall, F. G.: Canopy reflectance, photosynthesis and transpiration. III. A reanalysis using improved leaf models and a new canopy integration scheme, Remote Sens. Environ., 42, 187–216, 1992.
Sellers P. J., Tucker C. J., Collatz, G. J., Los, S. O., Justice C.O., Dazlich D. A., and Ran-dall D. A.: A global 1-degrees-by-1-degrees ndvi data set for climate studies, 2. the
genera-5
tion of global fields of terrestrial biophysical parameters from the ndvi, Int. J. Remote Sens., 15(17), 3519–3545, 1994.
Sellers, P. J., Randall, D. A., Collatz, G. J., Berry, J. A., Field, C. B., Dazlich, D. A., Zhang, C., Collelo, G. D., and Bounoua, L.: A revised land surface parameterization (SiB2) for atmo-spheric GCMs. Part 1: Model formulation, J. Clim., 9, 676–705, 1996a.
10
Sellers, P. J., Los, S. O., Tucker, C. J., Justice, C. O., Dazlich, D. A., Collatz, G. J., and Ran-dall, D. A.: A revised land surface parameterization (SiB2) for atmospheric GCMs, Part II: The generation of global fields of terrestrial biophysical parameters from satellite data, J. Clim., 9, 706–737, 1996b.
Sharma, R. C., Smith, E. L., and McNew, R. W.: Stability of harvest index and grain yield in
15
winter wheat, Crop Sci., 27, 104–108, 1987.
Smiciklas, K. D., Mullen, R. E., Carlson, R. E., and Knapp, A. D.: Soybean seed quality re-sponse to drought stress and pod position, Agron. J., 84, 166–170, 1992.
Silvius, J. E., Johnson, R. R., and Peters, D. B.: Effect of water stress on carbon assimilation and distribution in soybean plants at different stages of development. Crop Sci., 17(5), 713–
20
716, 1977.
Spaeth, S. C., Randall, H. C., Sinclair, T. R., and Vendeland, J. S. Agron J., 76, 482–486, 1984. Suyker A. E., Verma, S. B., Burba, G. G., Arkebauer, T. J., Walters, D. T., and Hubbard, K. G.:
Growing season carbon dioxide exchange in irrigated and rainfed maize, Agr. Forest Meteo-rol., 124(1–2), 1–13, 2004.
25
Suits, N. S., Denning, A. S., Berry, J. A., Still, C. J., Kaduk, J., and Miller, J. B.: Simulation of carbon isotope discrimination of the terrestrial biosphere, Glob. Biogeochem. Cy., 19, GB1017, doi:10.1029/2003GB002141, 2005.
Taylor, H. M., Mason, W. K., Bennie, A. T. P., and Howse, H. R.: Responses of soybeans to two spacings and two soil water levels. I. An analysis of biomass accumulation, canopy
30
development, solar radiation interception and components of seed yield, Field Crop Res., 5,1–14, 1982.
BGD
6, 1903–1944, 2009Predicting cropland carbon fluxes with
SiBcrop
E. Lokupitiya et al.
Title Page
Abstract Introduction
Conclusions References
Tables Figures
◭ ◮
◭ ◮
Back Close
Full Screen / Esc
Printer-friendly Version
Interactive Discussion
of nutrients and energy value of corn cobs and ear corn of four maturities, J. Anim. Sci., 29(6), 987–991, 1969.
Torbert, H. A., Prior, S. A., Rogers, H. H., and Runion, G. B.: Elevated atmospheric CO2effects on N fertilization in grain sorghum and soybean, Field Crops Res., 88, 57–67, 2004.
Tucker, C. J., Pinzen, J. E., Brown, M. E., Slayback, D. A., Pak, E. E., Mahoney, R.,
Ver-5
mote, E. F., and El Saleous, N.: An extended AVHRR 8-km NDVI dataset compatible with MODIS and SPOT vegetation NDVI data, Int. J. Remote Sens., 26(20), 4485–4498, 2005. USDA: Usual planting and harvesting dates for field crops. USDA, 1997.
Vanotti, M. B., Bundy, L. G., and Peterson, A. E.: Nitrogen fertilizer and legume-cereal rota-tion effects on soil production and organic matter dynamics in Wisconsin, in: Soil Organic
10
Matter in Temperate Agroecosystems, edited by: Paul, E. A., Paustian, K., Elliott, E. T., and Cole, C. V., CRC Press, New York, 105–119, 1997.
Verma, S. B., Dobermann, A., Cassman, K. G., Walters, D. T., Knops, J. M., Arkebauer, T. J., Suyker, A. E., Burba, G. G., Amos, B., Yang, H., Ginting, D., Hubbard, K. G., Gitelson, A. A., and Walter-Shea, E. A.: Annual carbon dioxide exchange in irrigated and rainfed
maize-15
based agroecosystems, Agr. Forest Meteorol., 131, 77–96, 2005.
Vidale, P. L. and Stockli, R.: Prognostic canopy air space solutions for land surface exchanges, Theor. Appl. Climatol., 80(2–4), 245–257, 2005.
Wang, J. W., Denning, A. S., Lu, .L. X., Baker, I. T., Corbin, K. D., and Davis, K. J.: Observations and simulations of synoptic, regional, and local variations in atmospheric CO2, J. Geophys.
20
Res., 112, D04108, doi:10.1029/2006JD007410, 2007.
Wells, R., Ashley, D. A., and H. R. Boerma. 1986. Physiological comparisons of two soybean cultivars differing in canopy photosynthesis. I. Variation in vertical14CO2 labelling and dry weight partitioning, Photosynth. Res., 9, 285–294, 2007.
Wilhelm, W. W.: Dry-matter partitioning and leaf area of winter wheat grown in a long-term
25
fallow tillage comparisons in the US Central Great Plains, Soil Till Res., 49, 49–56, 1998. Yamagata, M., Kouchi, H., and Yoneyama, T.: Partitioning and utilization of photosynthate
BGD
6, 1903–1944, 2009Predicting cropland carbon fluxes with
SiBcrop
E. Lokupitiya et al.
Title Page
Abstract Introduction
Conclusions References
Tables Figures
◭ ◮
◭ ◮
Back Close
Full Screen / Esc
Printer-friendly Version
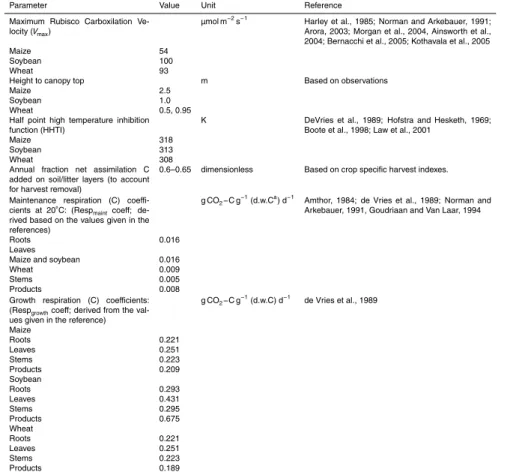
Interactive Discussion Table 1. Some important crop relevant parameters in SiBcrop; these parameter values are
deviations or additions to the parameter values given for SiB in Sellers et al. (1992, 1996b).
Parameter Value Unit Reference
Maximum Rubisco Carboxilation
Ve-locity (Vmax)
µmol m−2s−1 Harley et al., 1985; Norman and Arkebauer, 1991;
Arora, 2003; Morgan et al., 2004, Ainsworth et al., 2004; Bernacchi et al., 2005; Kothavala et al., 2005
Maize 54
Soybean 100
Wheat 93
Height to canopy top m Based on observations
Maize 2.5
Soybean 1.0
Wheat 0.5, 0.95
Half point high temperature inhibition function (HHTI)
K DeVries et al., 1989; Hofstra and Hesketh, 1969;
Boote et al., 1998; Law et al., 2001
Maize 318
Soybean 313
Wheat 308
Annual fraction net assimilation C added on soil/litter layers (to account for harvest removal)
0.6–0.65 dimensionless Based on crop specific harvest indexes.
Maintenance respiration (C) coeffi
-cients at 20◦C: (Resp
maintcoeff;
de-rived based on the values given in the references)
g CO2−C g−1(d.w.Ca) d−1 Amthor, 1984; de Vries et al., 1989; Norman and
Arkebauer, 1991, Goudriaan and Van Laar, 1994
Roots 0.016
Leaves
Maize and soybean 0.016
Wheat 0.009
Stems 0.005
Products 0.008
Growth respiration (C) coefficients:
(Respgrowthcoeff; derived from the
val-ues given in the reference)
g CO2−C g−
1
(d.w.C) d−1
de Vries et al., 1989
Maize
Roots 0.221
Leaves 0.251
Stems 0.223
Products 0.209
Soybean
Roots 0.293
Leaves 0.431
Stems 0.295
Products 0.675
Wheat
Roots 0.221
Leaves 0.251
Stems 0.223
Products 0.189
a