DOI : 10.5121/ijcnc.2015.7310 127
Anita Yadav
1, Y. N. Singh
2, SMIEEE and Raghuraj Singh
11
Computer Science and Engineering Department, Harcourt Butler Technological Institute, Kanpur, India
2
Electrical Engineering Department, Indian Institute of Technology, Kanpur, India
A
BSTRACTFrequent changes in network topology due to mobility and limited battery power of the mobile devices are the key challenges in the adhoc networks. The depletion of power source may cause early unavailability of nodes and thus links in the network. The mobility of nodes causes frequent routes breaks and adversely affects the required performance of the applications. We propose a cross layer design for the dynamic power control protocol and link prediction (DPCPLP) that provides a combined solution for power conservation as well as link availability. This combines the effect of optimum transmit power and received signal strength based link availability estimation with AODV routing protocol using cross layer approach. This method proposes to use optimum transmit power for transmitting the packets to a neighboring node to increase the battery life of adhoc nodes and received signal strength based link prediction to increase the availability of the links. In this paper, the transmit power and received signal strength of the packets are cross-layer interaction parameters to provide the combined solution for power conservation and reliable route formation with increased availability of links and thus the routes amongst sources and destinations. Further, this increases network and nodes’ lifetime and capacity. It improves throughput and packet delivery ratio by spatial reuse, prior prediction of link breaks and initiating the route repair. It also reduces end-to-end delay and power consumption by use of optimum transmit power. Through simulations, we have shown that our proposed protocol shows better performance.
K
EYWORDSCross layer, MANET, routing, power control, signal strength, medium access control, link prediction, mobility, DPCPLP
1.INTRODUCTION
Mobile Adhoc network is a collection of mobile devices that are self organizing and communicate with each other without using centralized infrastructure. In such an environment, nodes also act as router and forward packets to the next hop to deliver it to the final destination through multiple hops.
128
whole system. Further, mobility presents the challenges in the form of continuously variable topology and thus requiring a complex and energy efficient routing mechanisms.
Wireless networks will be used mostly by personal communication devices which people can carry with them. These small, always connected personal devices will lead to new applications. For running most of these applications on resource limited devices, one needs efficient networking stack in the mobile devices. Conventionally to simplify the complex task of handling network connectivity, layered architecture had been used. To further improve the performance, the concept of layered software components is now being broken by also allowing layers to access data structures from non-immediate layers. This approach is popularly known as cross layer optimization.
Quality of Service in MANETs will imply guaranteed delivery of packets corresponding to the specific flows at higher priority so as to satisfy loss and delay performance requirements. In MANETs, the nodes function using remaining battery power, availability of which can vary widely across the nodes. The nodes may be mobile, thus the links in the optimal path from source to destination may break either due to mobility or less battery power. Thus providing QoS guarantees with highly unreliable links, need fast or even proactive routing recovery, alongwith transport and application layer optimization, which may start even before the link failure finally happens. Thus the measurements at data link layer and MAC layer need to be used at the network, transport and application layers to avoid wastage of transmitted power due to transmission of data frames which are of no use due to link failure.
This paper has been organized in four sections. Section 2 introduces some related work in this domain. Section 3 discusses the details of proposed power control to reduce the power consumption and a model to estimate the link availability. Section 4 includes simulation results and analysis. Section 5 summarizes the work.
2. RELATED WORK
There are various cross layer mechanism between MAC and routing which have been proposed to solve Hidden Node Problem, Exposed Node Problem, excessive Power Consumption and low Network throughput at MAC layer. The Link Prediction at network layer has been used. Combined effect of multiple optimizations, at multiple layers has been studied in order to have better performance in the network by conserving energy. In this section, we have covered various MAC, routing and cross layer optimization mechanisms.
2.1 MAC Protocols
129 Figure 1: RTS-CTS-DATA-ACK four way handshake MAC Protocol
Adaptive Power Controlled MAC Protocol [2] was proposed to reduce power consumption and also to increase the overall throughput of the network by allowing the nodes to transmit at low enough power levels such that the desired destination can receive the packet. It estimates the transmission power based on received signal, and is given by
. (1)
Where and are the transmission and received powers of the previous packet from the receiver to sender. Here assumption is that loss is same in reverse direction. In this protocol, all the packets RTS, CTS, DATA and ACK are sent at optimum power level.
2.2 Routing Protocols
Routing protocols for adhoc networks typically include mechanisms for route discovery and route maintenance. The route discovery mechanism is invoked to determine a route between a sender and a receiver. The route maintenance mechanism finds new valid routes as the substitute for the broken routes.
AODV [3] is an on-demand routing protocol. Route discovery is initiated only when a source node needs to communicate with a destination for which it does not have a route in its routing table. To discover a route to a destination, the source node broadcasts a route request message (RREQ) that contains a request ID. If a node receives a RREQ that it has already received, it drops the request. Otherwise it stores the address of the node from which it received the request so as to establish a reverse route to the source to be used later. Intermediate nodes that do not have a path to the destination re-broadcast the request. If the RREQ reaches a node that has a route to the destination, the node sends a route reply message (RREP) to the source. The reply message contains the number of hops needed to reach the destination from the node. If RREQ reaches the destination, it sends the route reply to the source over the reverse route. As the RREP is sent back to the source over the reverse path, each node stores the address of the node that had sent the reply. The routes entries then created are used for forwarding the packets from the source to the destination. AODV maintains sequence numbers for the different destinations to ensure the latest routes in the routing table.
130
destinations that have become unreachable because of the loss of the link. The RERR is sent to all the source nodes that use the link. This is the procedure of global repair. AODV also includes a local repair mechanism to locally recover from link losses. Local repair is triggered when a link break occurs between the nodes within an active route. In this repair, the node upstream the break tries to find alternative sub-paths to the destinations of packets that has been flowing through, but is unable to forward them (packets) now because of the link break.
Route failures have a significant negative impact on packet delivery. Packet dropping and higher delays are the main consequences of route failures. The time elapsed between link break detection and alternative path establishment can be high in traditional routing protocols. Therefore, to reduce downtime of flow is important.
The preemptive routing proposed by Goff [4] uses the received transmission power is used to estimate when the link is expected to break. It initiates fresh route discovery and builds an alternative route before the link failure. The preemption ratio δ is used for defining preemption
zone around the signal strength threshold. This proactive route selection and maintenance mechanism was applied to DSR and AODV by Goff. In wireless network, normally transmit power is adjusted so that receiver gets just required power level for signal detection. Power control to adjust the transmit power was not included in this work.
There are various routing protocols proposed to find the routes that last longer i. e. stable links to reduce the route breakage and consumption of resources. In LAER [5] joint metric of link stability and energy drain rate has been proposed to be used in route discovery. This results in reduced control overhead and balanced traffic load.
2.3 Cross Layer Protocols
Due to dynamic, limited resources and unpredictable channel conditions, the traditional way of optimization at different layers is not enough in wireless adhoc networks. In order to obtain best results, it is necessary to perform optimizations using the information available across multiple layers. The concept of cross layer design, the layers exchange the information in order to improve the overall network performance.
Physical and Network cross layer interactions: The impact of physical layer on five different routing protocols has been studied in [6]. The performance obtained when physical layer properties such as path loss and shadowing are considered are much better than the scenario is used. The paper concluded that the hop-count may not be an optimal metrics for the routing process and the routing metrics for MANETs should take into account the current state of the channel as well as the quality of the link.
Physical and Transport cross layer interactions: Power control can often influence the transmission rate of mobile nodes. The possibility to enhance multi-hop communication by balancing power control in the physical layer and congestion control in transport layer has been explored in [7]. The distributive power control algorithm (JOCP) couples with original TCP protocol to improve end-to-end throughput and energy efficiency in the network. The key idea of JOCP is that during congestion periods nodes will try to transmit packets faster at the bottleneck links by updating their transmission power. More specifically, at each time slot the transmission power at a transmitter i will increase proportionally to its packet queuing delay and will decrease proportionally to its current power level Pi. This analytical model proves the
131
MAC and Transport cross layer interactions: The inability of TCP to distinguish between packet loss caused by congestion and packet loss by other factors (mobility of nodes, wireless link fluctuations) is the main cause of poor performance of TCP in MANETs. While several proposals in literature attempt to solve the problem by modifying the MAC or the TCP in isolation, some solutions explore joint strategies at MAC and TCP layers. The problem of performance degradation of transport layer protocol due to congestion has been presented in [8]. The proposed cross-layer congestion control scheme (C3TCP) gives higher performance by gathering capacity information such as bandwidth and delay at the link layer. This method requires the introduction of an additional module within the protocol stack of the mobile node, which is able to adjust the outgoing data stream based on capacity measurements. Moreover, a proposal to provide optional field support to existing IEEE 802.11 protocol has also been suggested, in order to support the presented congestion control.
Joint optimal design for cross layer congestion control, routing and scheduling for adhoc wireless networks has been proposed in [9]. The rate constraint and scheduling constraint are used based on the flow variables and is formulated resource allocation in networks with fixed wireless channel. The resource allocation problem has been decomposed into three sub problems: congestion control, routing and scheduling.
3. CROSS LAYER POWER CONTROL AND LINK AVAILABILITY PREDICTION
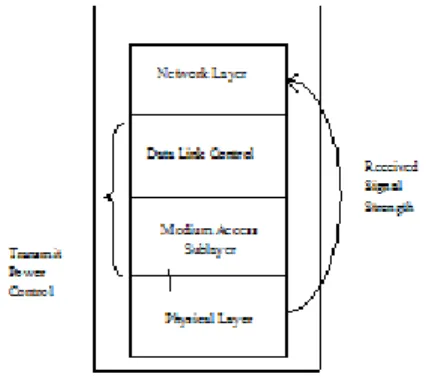
Cross layer interactions as shown in figure 2 are between physical and network layers. The received signal strength is used by network layer to initiate the process to find the new route.
Figure 2: Cross layer interactions at node
Cross layer based approach for link availability prediction (DPCPLP) increases network lifetime and capacity by combining the effect of optimum transmit power in transmitting RTS, CTS, DATA and ACK packets and estimation of link availability time and further, formation of the path prior to the link break to support the Quality of Service (QoS) requirements of applications.
1)Power control: At the MAC layer RTS, CTS, DATA and ACK are sent at optimum transmit power level just adequate to sustain a good quality communication. The estimation is done dynamically based on received signal strength of RTS, CTS, DATA and ACK packets between links and accordingly, the sender can adjust it’s transmit power.
132
sources before the path breaks and either upstream nodes or sources can rediscover a new path in advance for forwarding the packets.
3.1 Power control
To maximize the battery life of mobile nodes, we have proposed the Dynamic Power Control Protocol (DPCP) part at MAC layer. This protocol is based on Adaptive Power Control MAC protocol in such a way that the overall transmitted power is less and hence battery consumption is less.
At MAC layer, RTS, CTS, DATA and ACK are sent at the optimum power. The header fields of the packets RTS, CTS, DATA and ACK contain the transmission power level which can be used to compute optimum power to send a packet.
The IEEE 802.11std is reliable MAC protocol. When a sending node transmits RTS, CTS, DATA and ACK packets, every exposed node receives the packet at received signal strength. The received signal strength, at receiver using two ray propagation model is:
. (2)
Where is the wavelength of carrier, is the distance between sender and receiver. and are the gain of transmitting and receiving omni directional antennas respectively. The power is the transmit power of the packet. The header fields of the packets RTS, CTS, DATA and ACK are modified to incorporate the transmission power level of the respective packets.
Thus when a node receives such packet, it gets the transmission power level , the received power is calculated by the physical layer and the value is send to MAC layer. Every node knows the minimum threshold power at which the packet can be decoded properly. Thus we get the desired minimum transmission power required so that packet is properly decoded at the receiver.
. (3)
However, we do not have information about distance [2] between two nodes. We can find out optimum transmission power by the equation
. (4)
(5)
Where, is the optimum transmission power and is discrete level greater than , and are the transmission and received powers of the previous packet from that receiver to sender, respectively. C is a constant equal to 1.05 to compensate for the interference and noise.
133
destination node and the other will be the power level. This table will be known as the OPTIMUM POWER TABLE. This table is small as it contains entries only of the neighbors. The Optimum Power Entry format is shown in figure 3.
Figure 3: Format of Optimum Power Table
In this cross layer design, the receiving node limits the optimum transmit power to a level just adequate to sustain good quality communication and start the process for prediction of the link break. In this approach, we have used three threshold received signal strengths. They are threshold received signal strengths and respectively. At , the node enters into link prediction process. At , the node enters into critical state, warns the upstream node about link break and forms alternate path prior to link break. The is minimum power allowed for the destination node to decode the packet.
In this design, the received signal strength information obtained and calculated at the physical layer and then, is passed to the MAC layer for data transmission. The optimum transmit power is computed using equation (4). This is stored at each node in the optimum power table against the destination. In order to get the optimum transmit power in the cross layer design, the header fields of packets RTS, CTS, DATA and ACK are modified to incorporate the transmit power level of the respective packets. Thus, when a node receives such packet, it gets the transmission power level , the received power is accessed from the physical layer and the calculated transmit power is pass to the MAC layer. This clearly indicates interaction between physical and MAC layers.
The node sending RTS inserts transmit power as an extra field in it so that the receiving node can tune to this power while sending its CTS packet. Subsequently by using the optimum transmit power level, the DATA packets from sender and ACK packet from receiver can also be transmitted.
3.2 Link availability
The link availability time can be estimated based on received signal strengths of packets from physical layer and the prediction of link break warns the sources and it can rediscover a new path before the path breaks [10].
The received signal strength in cross layer design is accessed at physical layer and can be used by upper layers. The measured value of received signal strength is transferred to upper layer alongwith the signal. This is used in calculations at common places and further passed to the routing layer alongwith routing control packets. This value is stored in the routing and neighbor tables and used in some of the decision making process related to selection of links forming the path. As an interlayer interaction parameter, the received signal strength, which is accessed at physical layer, is being used by upper layers. The calculation is accomplished by estimating the time at which received signal strength of the data packets will fall below a threshold power. The received power level below the decode power indicates that the two nodes are moving away from each other’s radio transmission range and leading to link break.
In this approach, three consecutive measurements of signal strength of packets received from the predecessor node are used to predict the link failure using the Newton divided difference
Node ID
134
interpolation method. The Newton interpolation polynomial has the following generalized expression.
The received signal strengths of the three latest data packets and their time of occurrence are maintained by each receiver for each transmitter from which it is receiving. Using three received data packets’ signal power strengths as , , and the time when packets arrived as , , respectively and instants as the decode signal strength ( ) at the time , one can determine using equation (7). We assume that at the predicted time , when received power level reduces to or less than decode power, the link will break. The expected signal strength of the packets received can be computed as below, where and are first and second divided differences respectively.
. (6)
. (7)
At time , the node enters into critical state and node should find alternate route. A link failure warning is sent towards the upstream nodes and sources, whose flows are using this link. Source nodes can invoke the route discovery mechanism to setup restoration paths. The threshold power is the received power at the time , sufficient for sending warning message to the upstream node and sources further to discover an alternate path by setting up new path.
3.3 Proposed protocol algorithm
The DPCPLP algorithm, is the set of power levels used for the transmission, where L is an integer varies from 1 to 7. The transmit power is the maximum power level and the number of power levels in the set is 7.
A.Transmitter:
1. Let ,
2. Check the optimum power table at the transmitter node for the receiver node address and its stored optimum transmit power value ,
3. If node entry is available, then else ,
4. Add this power value in RTS header and send RTS with this power level ,
5. Receive CTS packet, observe its received power and extract transmit power. The node calculates optimum transmit power for DATA packet,
6. Update optimum power table,
7. Add the power level in the DATA packet header and send the DATA packet at optimum transmit power level,
8. Receive ACK, 9. End.
B. Receiver:
135
2. On receipt of a packet, 3. If ( >
4. Else 5. {
6. Update record of (received power, time) for last three packets, 7. If and )) then Prediction (),
8. Prediction () 9. {
10. Estimate and update the and update the , when node enters into critical state, prior to link break
11. }
12. If (current time >= ) 13. {
14. Sent warning message to upstream node, 15. Sleep for fixed duration.
16. }
17. On receipt of repair message,
18. Set the route and link status as soon-to-be-broken, 19. }
20. Powercontrol () 21. {
22. Receive RTS,
23. Observe the receive power, extract the transmit power and then calculate the optimum transmit power for the CTS packet. Update optimum transmit power table with power level
,
24. Insert the optimum transmit power in the CTS header and send the CTS packet at the same power level,
25. Receive DATA packet,
26. Include the optimum power level in the ACK packet header and send the ACK packet this transmit power level,
27. } 28. End.
1. At source: 2. {
3. New path discover message received, 4. Discover new path,
5. Redirect traffic through new path. 6. }
4.SIMULATION RESULTS AND ANALYSIS
136
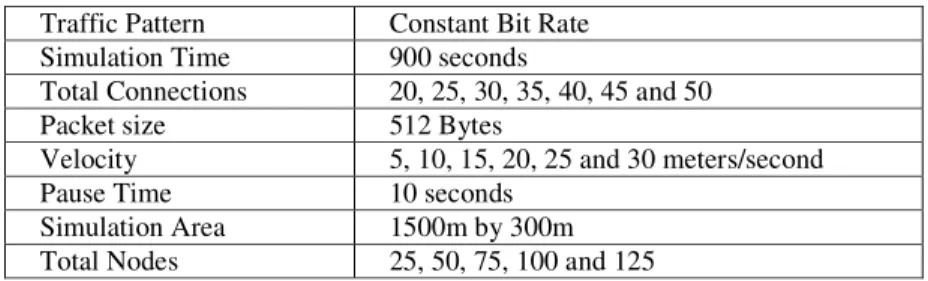
Two-ray radio propagation model is used. We have used seven transmit power levels. Three parameters viz. node velocity, network load and node density were varied in the simulations. Network load is the rate of generation of packets in the network.
Table 1 Simulation parameters
Traffic Pattern Constant Bit Rate Simulation Time 900 seconds
Total Connections 20, 25, 30, 35, 40, 45 and 50
Packet size 512 Bytes
Velocity 5, 10, 15, 20, 25 and 30 meters/second
Pause Time 10 seconds
Simulation Area 1500m by 300m Total Nodes 25, 50, 75, 100 and 125
The performance of protocols have been evaluated in terms of average interruption time, overhead packets, energy consumption, throughput, packet delivery ratio and end-to-end delay as function of node mobility, packets generation rate and node density. Constant bit rate (CBR) sources are assumed in the simulation.
Average interruption time is the time during which ongoing communications are interrupted.
Routing overhead is the number of routing overhead packets that are generated in the network to transfer the data packets.
Energy consumed (in Joules) per 1 kilobyte data delivered is calculated as the total amount of transmitting and receiving energy consumption over all flows divided by the total data delivered by all the flows. The energy consumption of all the packets RTS, CTS, DATA and ACK are considered.
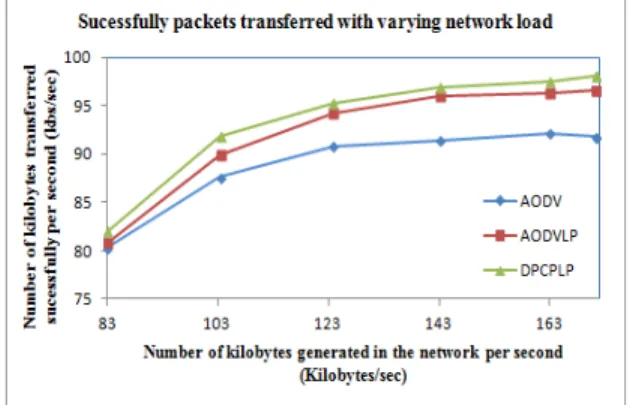
Throughput is the number of kilobytes transferred successfully by the sender to the receiver successfully.
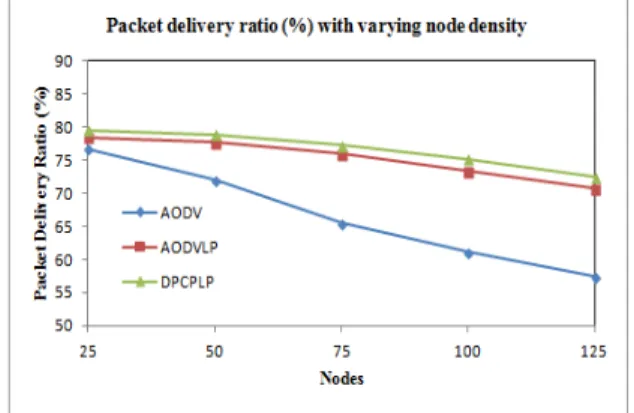
Packet delivery ratio is the ratio of the data packets delivered to the destination to those generated by the CBR sources. The higher the value better is the performance.
Average end-to-end delay of data packets includes all possible delays caused by buffering during route discovery, queuing at interface queue, retransmission delays at MAC layer, propagation and transfer time.
137 Figure 4 Average interruption time vs node velocity
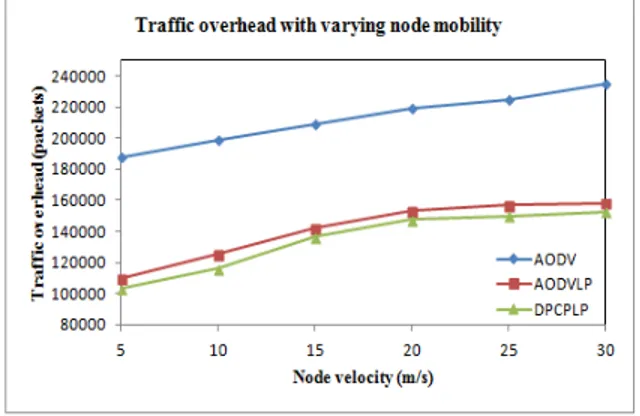
Figure 5 Routing overhead vs node velocity
Figure 5 shows that the overhead packets are least in DPCPLP as compared to AODVLP and AODV, because more packets are transferred concurrently due to smaller carrier sensing range in addition to availability of alternate routes in case of route failures caused due to higher node mobility. However, in DPCPLP, AODVLP and AODV schemes, the routing overhead packets increase with increase in node velocity. This happens because increase in node velocity increases more route unavailability for fast moving nodes. Therefore, overheads of new route discovery lead to increase in the routing overhead packets.
138 Figure 6 Average interruption time vs packet generation rate
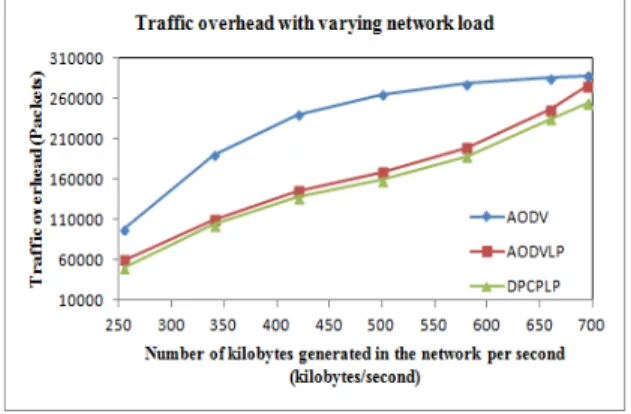
Figure 7 Routing overhead vs packet generation rate
In figure 7, The DPCPLP scheme generates least overhead routing packets as compared to AODVLP and AODV schemes due to concurrent transmission of the packets due to lower transmit power and prior route discovery before link failure, which avoids retransmission of the packets in the network. In AODV, AODVLP and DPCPLP, the routing overhead packets are increasing with increase in number of generated data packets because this increases contention and collisions. At very low packet generation rate, AODV, AODVLP and DPCPLP generate lower overhead packets. The result shows that by increasing the packet generation rate, the overhead packets also increases because more data packets are contending for the transmission channel thus more overhead packets are generated for retransmission of the packets.
139 Figure 8 Throughput vs packet generation rate
Figure 9 Average energy consumption (in Joule) per communication of 1Kbyte of data vs packet generation rate
Figure 9 shows variation of energy consumed per successful communication of 1 kilobyte of data with increase in packet generation rate. Results show that power consumption per successful communication of 1 kilobyte of data is lowest in DPCPLP as compared to AODVLP and AODV. DPCPLP is least power consuming as compared to other schemes as it uses lower power for communication of RTS, CTS, DATA and ACK packets and link successes are also observed and avoiding retransmissions of packets. However, DPCPLP, AODVLP and AODV give increasing average energy consumption as network load increases, since more packets are generated and contending in the network and thus these packets are send to the destinations therefore, more energy is consumed in successful communication of these packets.
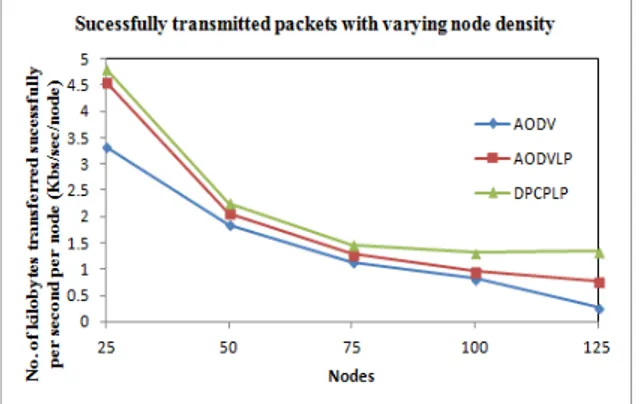
140 Figure 10 Throughput per node vs no. of nodes
Figure 11 Energy consumption per communication of 1 kilobyte data vs no. of nodes
Figure 11 shows that protocol DPCPLP saves energy and therefore more packets can be transmitted in lesser power. The energy consumption increases in case of all the schemes as the node density increases, contention and collisions also increase. But the energy consumption of the DPCPLP is least among all the schemes throughout the density variation thereby making it better protocol.
141 Figure 12 Delivery of packets vs no. of nodes
Figure 13 End-to-end delay vs no. of nodes
The end-to-end delay is an average of difference between the time a data packet is originated by an application and the time the data packet is received at its destination. Figure 13 shows lowest end-to-end delay in DPCPLP as compared to AODVLP and AODV because DPCPLP takes care of concurrent transmission of packets due to lower transmit power for RTS, CTS, DATA and ACK in addition to prior route discovery in case of route failures. The end-to-end delay is lower in AODVLP as compared to AODV due to prior route discovery in case of route failures. At low density, the delay is low in all schemes and it increases with increase in density because high node density increases contention and collisions thus result in retransmission of packets.
5.SUMMARY AND FUTURE WORK
142
The performance of the proposed cross layer design for the dynamic power control protocol and link prediction (DPCPLP) performs well as compared to AODVLP and AODV, This results in better throughput, lower energy consumption thus longer battery life and better delivered network because of lowest overhead routing packets and average interruption time due to use of optimum (lower) transmit power and prior route repair processes. Therefore, it improves networks and nodes’ lifetime and capacity to support Quality-of-Service.
The suitability of proposed method for real-time traffic needs to be further studied by testing it with smaller sized CBR packets at a higher packet rates. The performance can also be evaluated for other power control and routing algorithm and considering other parameters e. g. congestion control at transport layer. Further, other power optimization and prediction methods should be evaluated.
REFERENCES
[1] IEEE 802.11 Working Group, Wireless LAN Medium Access Control (MAC) and Physical Layer (PHY) Specification, 1997.
[2] Y. Chen, W.C. Wong, “ Adaptive Power Controlled MAC Protocol in mobile Ad hoc Networks”, Proceedings of the 8th Annual international conference on mobile computing and networking, Vol. 2, pp. 36-47, November 2002.
[3] Charles Perkins and Elizabeth Royer, “Adhoc on-demand distance vector routing”, Proceedings of the 2nd IEEE Workshop on Mobile Computing Systems and Applications, Feb 1999, pp. 90-100. [4] T. Goff and N. Abu-Ghazaleh, D. Pathak and R. Kahvecioglu, “Preemptive Routing in Adhoc
Networks”, Proc. of the Seventh Annual International Conference on Mobile Computing and Networking, Rome, Italy, July 2001, pp. 43-52.
[5] F. D. Rango, F Guerriero, “Link Stability and Energy Aware Routing Protocol in Distributed Wireless Networks”, IEEE Transactions on Parallel and Distributed systems, Vol 23, No. 4, April 2012. [6] R. Chellappa, L. Pan, “A case for cross layer design : The impact of physical layer properties on
routing protocol performance in MANETs”, Technical report, 2002.
[7] M Chiang, “To layer or not to layer: Balancing transport and physical layers in wireless multihop networks”, IEEE Journal on Selected Areas in communications, Vol 23, No 1, pp 104-116, 2005. [8] D. Kliazovich and F. Granelli, “Cross-layer congestion control in adhoc wireless networks”, Adhoc
Networks, Vol. 4, pp. 687-708, 2006.
[9] Lijun Chen, Steven H. Low, Mung Chiang and John C. Doyle, “Cross-layer congestion control, routing and scheduling design in Adhoc wireless networks”, Proceedings of 25th IEEE International Conference on Computer Communications, April 2006, pp. 1-13.
[10] Anita Yadav, Y. N. Singh and R. R. Singh, “Improving routing performance in AODV with link prediction in mobile adhoc networks”, Wireless Personal Communication, 2015, (DOI) 10.007/s11277-015-2411-5.
[11] The Network Simulator – ns-2 http://www.isi.edu/nsnam/ns
Author
Anita Yadav is a Ph. D. research scholar at U. P. Technical University, Lucknow, India and currently working as Associate Professor at Computer Science and Engineering, Harcourt Bulter Technological Institute, Kanpur, India. She received her M. Tech. degree in Computer Science and Engineering from U. P. Technical University, Lucknow, India in 2006, and B. Tech. degree in Computer Science and Engineering from Institute of
143 Y. N. Singh received his Ph. D. and M. Tech. degrees in Electrical Engineering from
Indian Institute of Technology, Delhi, India in 1997 and 1992, respectively, and B. Tech. degree in Electrical Engineering from Regional Engineering College, Hamirpur, India in 1991. He is currently working as Professor at Electrical Engineering, Indian Institute of
Technology, Kanpur, India. His research interest includes Optical Communication Networks, Mobile Adhoc Networks Social Networks and Computer Networks. Dr. Singh has published several papers in International Journals and Conferences including IEEE and Springer etc.
Raghuraj Singhreceived his Ph.D. degree from U. P. Technical University, Lucknow, India in 2006 and M. S. from BITS, Pilani, India in 1997. He has received B. Tech. in Computer Science and Engineering from Harcourt Bulter Technological Institute, Kanpur, India in 1990. He is currently working as Professor at Computer Science and Engineering, Harcourt