The International Journal of Multimedia & Its Applications (IJMA) Vol.6, No.3, June 2014
Anutam
1and Rajni
21
Research Scholar SBSSTC, Ferozepur, Punjab 2
Associate Professor SBSSTC, Ferozepur, Punjab
A
BSTRACTImage Denoising is an important part of diverse image processing and computer vision problems. The important property of a good image denoising model is that it should completely remove noise as far as possible as well as preserve edges. One of the most powerful and perspective approaches in this area is image denoising using discrete wavelet transform (DWT). In this paper, comparison of various Wavelets at different decomposition levels has been done. As number of levels increased, Peak Signal to Noise Ratio (PSNR) of image gets decreased whereas Mean Absolute Error (MAE) and Mean Square Error (MSE) get increased . A comparison of filters and various wavelet based methods has also been carried out to denoise the image. The simulation results reveal that wavelet based Bayes shrinkage method outperforms other methods.
K
EYWORDSDenoising, Filters, Wavelet Transform, Wavelet Thresholding
1. I
NTRODUCTIONApplications of digital world such as Digital cameras, Magnetic Resonance Imaging (MRI), Satellite Television and Geographical Information System (GIS) has increased the use of digital images. Generally, data sets collected by image sensors are contaminated by noise. Imperfect instruments, problems with data acquisition process, and interfering natural phenomena can all corrupt the data of interest [1]. Various types of noise present in image are Gaussian noise, Salt & Pepper noise and Speckle noise. Image denoising techniques are used to prevent these types of noises while retaining the important signal features [2]. Spatial filters like mean and median filter are used to remove the noise from image. But the disadvantage of spatial filters is that these filters not only smooth the data to reduce noise but also blur edges in image. Therefore, Wavelet Transform is used to preserve the edges of image [3]. It is a powerful tool of signal or image processing for its multi-resolution possibilities.
The International Journal of Multimedia & Its Applications (IJMA) Vol.6, No.3, June 2014
2 .T
YPESOFN
OISEVarious types of noise have their own characteristics and are inherent in images in different ways.
2.1. Amplifier Noise (Gaussian Noise)
The standard model of amplifier noise is additive, Gaussian, which is independent at each pixel and independent of the signal intensity. In color cameras, blue colour channels are more amplified than red or green channel, therefore, blue channel generates more noise [4].
2.2. Impulsive Noise
Impulsive noise is also called as salt-and- pepper noise or spike noise. This kind of noise is usually seen on images. It consists of white and black pixels. An image containing salt and pepper noise consists of two regions i.e. bright and dark regions. Bright regions consist of dark pixels whereas dark regions consist of bright pixels. Transmitted bit errors, analog-to-digital converter errors and dead pixels contain this type of noise [5].
2.3. Speckle Noise
Speckle noise is a multiplicative noise. It is a granular noise that commonly exists in and the active radar and synthetic aperture radar (SAR) images. Speckle noise increases the mean grey level of a local area. It is causing difficulties for image analysis in SAR images .It is mainly due to coherent processing of backscattered signals from multiple distributed targets [4].
3. F
ILTERINGT
ECHNIQUESThe filters that are used for removing noise are Mean filter and Median filter.
3.1. Mean Filter
The advantage of using this filter is that it provides smoothness to an image by reducing the intensity variations between the adjacent pixels [6]. Mean filter is essentially an averaging filter. It applies mask over each pixel in signal. Therefore, to make a single pixel each of the components of pixel which falls under the mask are average filter. The main disadvantage of Mean filter is that it cannot preserve edges.
3.2. Median Filter
One type of non linear filter is Median filter. By firstly finding the median value and then replacing each entry in the window with the pixel’s median value, median filtering is done [7]. Median is just the middle value after all the entries made in window are sorted numerically, if window has an odd number of entries. There is more than one median when window has an even number of entries. It is a robust filter. To provide smoothness in image processing and time series processing, median filters are used.
4. W
AVELETT
RANSFORMThe DWT is same as hierarchical sub band system where the sub bands are logarithmically spaced in frequency and represent octave-band decomposition. Image is decomposed into four sub-bands and critically sampled by applying DWT as shown in Fig. 1(a). These sub bands are formed by separable applications of horizontal and vertical filters. Sub-bands with label LH1, HL1 and HH1 correspond to finest scale coefficient while sub-band LL1 represent coarse level coefficients [9] [3]. The LL1 sub band is further decomposed and critically sampled to find out the next coarse level of wavelet coefficients as shown in Fig. 1(b). It results in two level wavelet decomposition.
(a ) One- Level (b) Two- Level
Figure1. Image Decomposition by using DWT
4.1 Wavelet Based Thresholding
Wavelet thresholding is a signal estimation technique that exploits the capabilities of Wavelet transform for signal denoising. It removes noise by killing coefficients that are irrelevant relative to some threshold [9] .Several studies are there on thresholding the Wavelet coefficients. The process, commonly called Wavelet Shrinkage, consists of following main stages:
Figure2. Block diagram of Image denoising using Wavelet Transform
• Read the noisy image as input
• Perform DWT of noisy image and obtain Wavelet coefficients • Estimate noise variance from noisy image
• Calculate threshold value using various threshold selection rules or shrinkage rules • Apply soft or hard thresholding function to noisy coefficients
• Perform the inverse DWT to reconstruct the denoised image.
4.1.1. Thresholding Method
The International Journal of
gives more visually pleasant im thresholding, therefore soft thresh
The Hard Thresholding operator
D (U, ) =U for all |U|> = 0 otherwise
The Soft Thresholding operation
D (U, ) = sgn(U)* max(0,|U| -
(a) Hard Th
4.1.2. Threshold Selection Rule
In image denoising applications, selected [9]. Finding an optimal threshold then it will pass all the but larger threshold makes more image and image processing ma lose some signal values [16].
4.1.2.1. Universal Threshold
where being the noise varian asymptotic sense and minimize assumed that if number of sample for soft threshold [18].
4.1.2.2. Visu Shrink
Visu Shrink was introduced by D shrinkage is that neither speckle deal with additive noise [20]. Thr
Where is calculated as mean represents the size of original ima
of Multimedia & Its Applications (IJMA) Vol.6, No.3, June
image and reduces the abrupt sharp changes that oc esholding is preferred over hard thresholding [12] [13]
[14] is defined as,
n the other hand is defined as ,
)
d Thresholding (b) Soft Thresholding [15]
Figure 3. Thresholding Methods
les
ns, PSNR needs to be maximized , hence optimal val al value for thresholding is not an easy task. If we sel he noisy coefficients and hence resultant images may re number of coefficients to zero, which provides sm
ay cause blur and artifacts, and hence the resultant
iance and M is the number of pixels [17] .It is optima izes the cost function of difference between the fu
ples is large, then the universal threshold may give be
Donoho [19]. It follows hard threshold rule. The draw le noise can be removed nor MSE can be minimized
hreshold T can be calculated using the formulae [21],
n of absolute difference (MAD) which is a robust est mage.
ne 2014
occurs in hard ].
(1)
(2)
alue should be select a smaller y still be noisy smoothness in nt images may
(3) al threshold in function. It is better estimate
rawback of this ed .It can only
,
(4)
(5)
4.1.2.3. Bayes Shrink
The Bayes Shrink method has been attracting attention recently as an algorithm for setting different thresholds for every sub band. Here sub-bands refer to frequency bands that are different from each other in level and direction [22]. Bayes Shrink uses soft thresholding. The purpose of this method is to estimate a threshold value that minimizes the Bayesian risk assuming Generalized Gaussian Distribution (GGD) prior [13]. Bayes threshold is defined as [23],
/ (6)
Where is the noise variance and is signal variance without noise.
From the definition of additive noise we have,
w (x, y) = s(x, y)+n(x, y) (7)
Since the noise and the signal are independent of each other, it can be stated that ,
+ (8) can be computed as shown below:
, (x, y) (9)
The variance of the signal, is computed as
max( 2 − 2, 0) (10)
5. S
IMULATIONR
ESULTSSimulated results have been carried on Cameraman image by adding two types of noise such as Gaussian noise and Speckle noise. The level of noise variance has also been varied after selecting the type of noise. Denoising is done using two filters Mean filter and Median filter and three Wavelet based methods i.e. Universal threshold, Visu shrink and Bayes shrink. Results are shown through comparison among them. Comparison is being made on basis of some evaluated parameters. Also the comparison of wavelet thresholding methods at different decomposition level has been discussed. The parameters are Peak Signal to noise Ratio (PSNR), Mean Square Error (MSE) and Mean Absolute Error (MAE).
PSNR = 10 log %&()*'' + db (11)
MSE =(/ (0 (x, y) /4 (X(i, j)− 6(7, 8)) (12)
MAE =(/ (0 (x, y) /4 |X(i, j)− 6(7, 8)| (13)
Where, M-Width of Image, N-Height of Image P- Noisy Image , X-Original Image
The International Journal of Multimedia & Its Applications (IJMA) Vol.6, No.3, June 2014
Table1. Comparison of PSNR for Cameraman image corrupted with Gaussian and Speckle noise at different Noise variances using db1 (Daubechies Wavelet)
Figure4. Comparison of PSNR for cameraman image (corrupted with Gaussian noise) at different noise variance
PSNR (PEAK SIGNAL TO NOISE RATIO)
NOISE NOISE
VARIANCE
MEAN
FILTER
MEDIAN
FILTER
UNIVERSAL
THRESHOLD
VISU SHRINK
BAYES
SHRINK
G
A
U
S
S
IA
N
N
O
IS
E
0.001 24.0598 25.4934 27.2016 28.2978 33.7031 0.002 23.2251 24.3480 25.1748 26.1439 29.9001 0.003 22.5261 23.4147 24.0062 24.8430 27.7650 0.004 21.9796 22.6049 23.1590 23.8149 26.0865 0.005 21.4536 22.0205 22.5099 23.0527 25.1235
0.01 19.5569 19.7703 20.3580 20.5660 22.0446
S
P
E
C
K
L
E
N
O
IS
E
0.001 24.8274 26.6157 28.4073 32.6526 44.0220 0.002 24.5114 26.1260 26.8834 30.4768 40.0535 0.003 24.2207 25.6708 25.9557 29.3585 38.3935 0.004 23.9316 25.2771 25.3274 28.1881 35.6827 0.005 23.7015 24.8599 24.8691 27.5283 34.3460
Table2. Comparison of MSE for Cameraman image corrupted with Gaussian and Speckle noise at different Noise variances using db1
Figure5. Comparison of MSE for cameraman image (corrupted with Gaussian noise) at different noise variances
MSE (MEAN SQUARE ERROR)
NOISE NOISE
VARIANCE
MEAN
FILTER
MEDIAN
FILTER
UNIVERSAL
THRESHOLD
VISU
SHRINK
BAYES
SHRINK
G
A
U
S
S
IA
N
N
O
IS
E
0.001 255.3265 183.5446 123.8560 96.2288 27.7188 0.002 309.4321 238.9368 197.5136 158.0136 66.5377 0.003 363.4693 296.2178 258.5006 213.1975 108.7875 0.004 412.2133 356.9362 314.1828 270.1428 160.1160 0.005 465.2894 408.3482 364.8271 321.9641 199.8629 0.01 720.1005 685.5656 598.8007 570.7912 406.0842
S
P
E
C
K
L
E
N
O
IS
E
0.001 213.9645 141.7451 93.8319 35.3036 2.5756 0.002 230.1138 158.6638 133.2721 58.2642 6.4229 0.003 246.0413 176.1971 165.0083 75.3748 9.4130 0.004 262.9796 192.9158 190.6971 98.6903 17.5716 0.005 277.2851 212.3693
The International Journal of Multimedia & Its Applications (IJMA) Vol.6, No.3, June 2014
The cameraman image is corrupted by gaussian noise of variance 0.01 and results obtained using filters and wavelets have been shown in Figure 6.
(a) (b) (c)
(d) (e) (f)
(g)
Figure 6. Denoising of cameraman image corrupted by Gaussian noise of variance 0.01
(a) Original image (b) Noisy image (c) Mean Filter (d) Median Filter (e) Universal thresholding (f) Visu Shrink (g) Bayes shrink
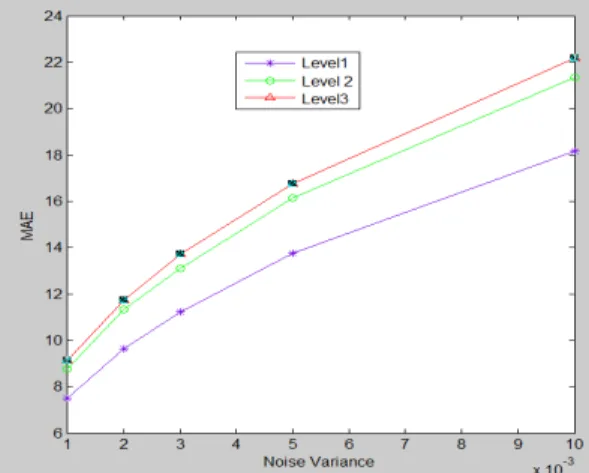
Table3. Comparison of PSNR, MSE and MAE for Cameraman image corrupted with Gaussian noise at different decomposition levels using db2
D
E
C
O
M
P
O
S
IT
IO
N
L
E
V
E
L
NOISE VARIANCE
UNIVERSAL THRESHOLD
VISU SHRINK
PSNR (db)
MSE MAE PSNR
(db)
MSE MAE
L
E
V
E
L
1
0.001 27.417 117.864 7.9166 28.031 102.305 7.512 0.002 25.483 183.956 10.070 26.028 162.286 9.622 0.003 24.324 240.229 11.632 24.764 217.077 11.235 0.005 22.775 343.185 14.090 23.087 319.419 13.763 0.01 20.610 564.927 18.373 20.740 548.297 18.179
L
E
V
E
L
2
0.001 25.736 173.564 9.612 26.778 136.524 8.767 0.002 23.834 268.933 12.177 24.667 222.007 11.343 0.003 22.673 351.355 14.047 23.477 291.968 13.110 0.005 21.144 499.579 17.007 21.769 432.649 16.135 0.01 19.027 813.403 22.095 19.424 742.403 21.331
L
E
V
E
L
3
The International Journal of Multimedia & Its Applications (IJMA) Vol.6, No.3, June 2014
Figure 7. Comparison of Peak Signal to Noise Ratio (PSNR) for cameraman image (denoising using Visu Shrink) at different decomposition levels
Figure 8. Comparison of Mean Square Error (MSE) for cameraman image (denoising using Visu Shrink) at different decomposition levels
6. C
ONCLUSIONIn this paper, an analysis of denoising techniques like filters and wavelet methods has been carried out. Filtering is done by Mean and Median Filter. And three different wavelet thresholding techniques have been discussed i.e. Universal Thresholding, Bayes Shrink and Visu Shrink. The results conclude that Bayes shrinkage method has high PSNR at different noise variance and low MSE. Also the comparison of Wavelet thresholding methods at different decomposition level has been discussed. From simulation result, it is evident that decomposition level 1 has high PSNR and low MAE and MSE than other decomposition levels i.e. level 2 and level 3.This concludes that decomposition level 1 is better in removing Gaussian noise than other decomposition levels.
REFERENCES
[1] Rajni, Anutam, “Image Denoising Techniques –An Overview,” International Journal of Computer Applications (0975-8887), Vol. 86, No.16, January 2014.
[2] Akhilesh Bijalwan, Aditya Goyal and Nidhi Sethi, “Wavelet Transform Based Image Denoise Using Threshold Approaches,” International Journal of Engineering and Advanced Technology (IJEAT), ISSN: 2249-8958, Vol.1, Issue 5, June 2012.
[3] S.Arivazhagan, S.Deivalakshmi, K.Kannan, “Performance Analysis of Image Denoising System for different levels of Wavelet decomposition,” International Journal of Imaging Science and Engineering (IJISE), Vol.1, No.3, July 2007.
[4] Pawan Patidar, Manoj Gupta,Sumit Srivastava, Ashok Kumar Nagawat, “Image De-noising by Various Filters for Different Noise,” International Journal of Computer Applications, Vol.9, No.4, November 2010.
[5] Mohammed Ghouse, Dr.M.Siddappa, “Adaptive Techniques Based High Impulsive Noise Detection And Reduction of a Digital Image,”Journal of Theoretical and Applied Information Technology. [6] Jappreet Kaur, Manpreet Kaur, Poonamdeep Kaur, Manpreet Kaur, “Comparative Analysis of Image
Denoising Techniques,” International Journal of Emerging Technology and Advanced Engineering, ISSN 2250-2459, Vol. 2, Issue 6, June 2012.
[7] Govindaraj.V, Sengottaiyan.G , “Survey of Image Denoising using Different Filters,” International Journal of Science, Engineering and Technology Research (IJSETR) ,Vol.2, Issue 2, February 2013. [8] Idan Ram, Michael Elad, “Generalized Tree-Based Wavelet Transform,” IEEE Transactions On
Signal Processing, Vol. 59, No. 9, September 2011.
[9] Rakesh Kumar and B.S.Saini,“Improved Image Denoising Techniques Using Neighbouring Wavelet Coefficients of Optimal Wavelet with Adaptive Thresholding,” International Journal of Computer Theory and Engineering, Vol.4, No.3, June 2012.
[10] Sethunadh R and Tessamma Thomas, “Spatially Adaptive image denoising using Undecimated Directionlet Transform,” International Journal of Computer Applications, Vol.84, No. 11,December 2013
[11] S.Kother Mohideen Dr. S. Arumuga Perumal, Dr. M.Mohamed Sathik , “ Image De-noising using Discrete Wavelet transform,” IJCSNS International Journal of Computer Science and Network Security, Vol.8 No.1, January 2008.
[12] Savita Gupta, R.C. Chauhan and Lakhwinder Kaur, “Image denoising using Wavelet Thresholding,” ICVGIP 2002, Proceedings of the Third Indian Conference on Computer Vision, Graphics Image Processing, Ahmedabad, India, 2002
[13] S.Grace Chang, Bin Yu, Martin Vetterli , “Adaptive Wavelet Thresholding for image denoising and compression,” IEEE Transaction On Image Processing, Vol.9, No.9, September 2000
[14] Nilanjan Dey, Pradipti Nandi, Nilanjana Barman, Debolina Das, Subhabrata Chakraborty ,“ A Comparative Study between Moravec and Harris Corner Detection of Noisy Images Using Adaptive Wavelet Thresholding Technique,” International Journal of Engineering Research and Applications (IJERA), ISSN: 2248-9622 , Vol. 2, Issue 1, Jan-Feb 2012.
The International Journal of Multimedia & Its Applications (IJMA) Vol.6, No.3, June 2014 [16] Abdolhossein Fathi and Ahmad Reza Naghsh-Nilchi, “Efficient Image Denoising Method Based on a
New Adaptive Wavelet Packet Thresholding Function,” IEEE Transaction On Image Processing, Vol. 21, No. 9, September 2012
[17] Virendra Kumar, Dr. Ajay Kumar, “Simulative Analysis of Image denoising using Wavelet ThresholdingTechnique,” International Journal of Advanced Research in Computer Engineering and Technology (IJARCET), Vol.2 , No.5, May 2013
[18] Mark J.T. Smith and Steven L. Eddins, “Analysis/SynthesisTechniques for subband image coding, IEEE Trans. Acoustic Speech and Signal Processing, Vol.38, No.8, Aug 1990
[19] D.L. Donoho and I.M. Johnstone, “Denoising by soft thresholding,” IEEE Trans. on Information Theory, Vo.41, 1995
[20] Raghuveer M. Rao, A.S. Bopardikar Wavelet Transforms: Introduction to Theory and Application published by Addison-Wesley, 2001
[21] S.Sutha, E. Jebamalar Leavline, D. ASR Antony Gnana Singh, “ A Comprehensive Study on Wavelet based Shrinkage Methods for Denoising Natural Images,” WSEAS Transactions on Signal Processing, Vol. 9, Issue 4, October 2013
[22] E.Jebamalar Leavline, S.Sutha, D.Asir Antony Gnana Singh, “Wavelet Domain Shrinkage Methods for Noise Removal in Images: A Compendium,” International Journal of Computer Applications,Vol.33, No.10, November 2011
[23] G.Y. Chen, T.D. Bui, A. Krzyak, “Image denoising using neighbouring Wavelet coefficients,” Acoustics Speech and Signal processing, IEEE International Conference, Vol.2, May 2004
AUTHORS
Anutam
She is currently pursuing M.Tech from SBS State TechnicalCampus, Ferozepur, India. She has completed B.Tech from PTU, Jalandhar in 2012. Her areas of interest includesWireless Communication and Image Processing.
Rajni