www.atmos-chem-phys.net/15/10183/2015/ doi:10.5194/acp-15-10183-2015
© Author(s) 2015. CC Attribution 3.0 License.
Chemical aging of single and multicomponent biomass burning
aerosol surrogate particles by OH: implications for cloud
condensation nucleus activity
J. H. Slade1, R. Thalman2, J. Wang2, and D. A. Knopf1
1Institute for Terrestrial and Planetary Atmospheres, School of Marine and Atmospheric Sciences,
State University of New York at Stony Brook, Stony Brook, NY 11794, USA
2Brookhaven National Laboratory, Department of Environmental and Climate Sciences, Upton, NY 11973, USA
Correspondence to:D. A. Knopf ([email protected])
Received: 11 February 2015 – Published in Atmos. Chem. Phys. Discuss.: 6 March 2015 Revised: 15 August 2015 – Accepted: 1 September 2015 – Published: 14 September 2015
Abstract. Multiphase OH and O3 oxidation reactions with
atmospheric organic aerosol (OA) can influence particle physicochemical properties including composition, morphol-ogy, and lifetime. Chemical aging of initially insoluble or low-soluble single-component OA by OH and O3 can
increase their water solubility and hygroscopicity, mak-ing them more active as cloud condensation nuclei (CCN) and susceptible to wet deposition. However, an outstand-ing problem is whether the effects of chemical agoutstand-ing on their CCN activity are preserved when mixed with other or-ganic or inoror-ganic compounds exhibiting greater water solu-bility. In this work, the CCN activity of laboratory-generated biomass burning aerosol (BBA) surrogate particles exposed to OH and O3 is evaluated by determining the
hygroscop-icity parameter, κ, as a function of particle type, mixing state, and OH and O3 exposure applying a CCN counter
(CCNc) coupled to an aerosol flow reactor (AFR). Levoglu-cosan (LEV), 4-methyl-5-nitrocatechol (MNC), and potas-sium sulfate (KS) serve as representative BBA compounds that exhibit different hygroscopicity, water solubility, chemi-cal functionalities, and reactivity with OH radichemi-cals, and thus exemplify the complexity of mixed inorganic/organic aerosol in the atmosphere. The CCN activities of all of the particles were unaffected by O3exposure. Following exposure to OH, κ of MNC was enhanced by an order of magnitude, from 0.009 to∼0.1, indicating that chemically aged MNC parti-cles are better CCN and more prone to wet deposition than pure MNC particles. No significant enhancement in κ was
observed for pure LEV particles following OH exposure.κ
of the internally mixed particles was not affected by OH oxi-dation. Furthermore, the CCN activity of OH-exposed MNC-coated KS particles is similar to the OH unexposed atomized 1 : 1 by mass MNC : KS binary-component particles. Our re-sults strongly suggest that when OA is dominated by water-soluble organic carbon (WSOC) or inorganic ions, chemical aging has no significant impact on OA hygroscopicity. The organic compounds exhibiting low solubility behave as if they are infinitely soluble when mixed with a sufficient num-ber of water-soluble compounds. At and beyond this point, the particles’ CCN activity is governed entirely by the water-soluble fraction and is not influenced by the oxidized organic fraction. Our results have important implications for hetero-geneous oxidation and its impact on cloud formation given that atmospheric aerosol is a complex mixture of organic and inorganic compounds exhibiting a wide range of solubilities.
1 Introduction
oxi-dants and radicals (Abbatt et al., 2012; Pöschl, 2011; George and Abbatt, 2010; Rudich et al., 2007). Heterogeneous oxi-dation reactions between organic aerosol particles and OH, O3, or NO3can impact the particles’ physical and chemical
properties (Ellison et al., 1999; Rudich, 2003; Pöschl, 2005; Rudich et al., 2007; George and Abbatt, 2010), and have been shown to impact particle hygroscopicity and cloud conden-sation nuclei (CCN) activity (Broekhuizen et al., 2004; Pet-ters et al., 2006; Shilling et al., 2007; Pöschl, 2011; George et al., 2009) and ice nucleation (IN) (Wang and Knopf, 2011; Brooks et al., 2014).
Cloud nucleation efficiency depends on the particle’s wa-ter solubility, hygroscopicity, size, and morphology (Petwa-ters and Kreidenweis, 2007, 2008; Dusek et al., 2006; Giordano et al., 2015). The majority of submicron aerosol particles are comprised of organic material (Zhang et al., 2007; Hallquist et al., 2009), which possess a wide range of hygroscopicity (κ∼0.01–0.5) (Petters and Kreidenweis, 2007). A signifi-cant portion of atmospheric organic aerosol (OA) is derived from biomass burning (BB) emissions (Bond et al., 2004; Andreae et al., 2004; Hays et al., 2005; Monks et al., 2009). BB plays an important role both regionally and globally (Park et al., 2007), accounting for an estimated 2.5 Pg C yr−1 (van der Werf et al., 2006). Reflectance data from satellite retrievals indicate that BB accounts for a global footprint of 464 Mha yr−1 or roughly ∼36 % of cropland on earth (Randerson et al., 2012). Biomass burning aerosol (BBA) constitutes a significant fraction of primary organic aerosol (POA) (Bond et al., 2004) and secondary organic aerosol (SOA), derived from oxidative aging of volatile and semi-volatile organic vapors emitted from biomass burning plumes (Carrico et al., 2010; Hallquist et al., 2009; Jathar et al., 2014). Molecular markers of BB POA include pyrolyzed forms of glucose such as levoglucosan (LEV, 1-6-anydro-β -glucopyranose) (Simoneit, 1999) and potassium-containing salts such as potassium sulfate (KS, K2SO4) (Sheffield et al.,
1994). The photo-oxidation of m-cresol, which is emitted at high levels from biomass burning (Schauer et al., 2001), in the presence of NOx, generates 4-methyl-5-nitrocatechol
(MNC), which has recently been recognized as a potentially important tracer for biomass burning SOA (Iinuma et al., 2010). With the exception of MNC, the CCN activity and hygroscopicity of LEV and KS, among other select BBA compounds and smoke particles, have been determined (Pet-ters et al., 2009; Carrico et al., 2010). Dusek et al. (2011) derived κ values of 0.2 for the water-soluble organic con-tent (WSOC) in particles produced from controlled labora-tory burns. Carrico et al. (2010) determined a meanκ of 0.1 for carbonaceous particles sampled from open combustion of several biomass fuels. Hygroscopic growth factors of LEV and other biomass burning derived organics range from 1.27 to 1.29 at relative humidity RH=90 % (Chan et al., 2005; Mikhailov et al., 2009). In situ field measurements of the CCN efficiency (ratio of CCN to the available condensation nuclei, CN) of biomass burning smoke particles is on the
or-der of 50 % at 1 % supersaturation (Andreae et al., 2004). While inorganic ions have only a minor importance as an at-mospheric tracer for biomass burning, they can significantly influence the CCN activity of BBA, even if their fractions are significantly less than the organic fraction (Iinuma et al., 2007; Roberts et al., 2002).
Heterogeneous OH oxidation of organic aerosol can initi-ate reactions that result in the production of oxidized polar functional groups that can reduce the particle’s surface ten-sion (George et al., 2009) and increase water solubility (Suda et al., 2014), enabling greater water uptake and CCN activ-ity. For example, Broekhuizen et al. (2004) demonstrated that unsaturated fatty acid aerosol particles comprised of oleic acid became more CCN active in the presence of high expo-sures to O3. In a follow-up study, Shilling et al. (2007)
cor-roborated this finding, attributing the enhancement in CCN activity to a combination of an increase in water-soluble ma-terial and a decrease in surface tension of the aqueous droplet during activation. Petters et al. (2006) demonstrated that the CCN activity of model saturated and unsaturated OA com-pounds is enhanced following oxidation by OH and NO3.
George et al. (2009) showed that the hygroscopicity of model OA, bis-ethyl-sebacate (BES) and stearic acid was enhanced following oxidative aging by OH radicals, which was at-tributed to the formation of highly water-soluble oxygenated functional groups. The hygroscopicity of OH-impacted am-bient biogenic SOA was shown to increase at higher OH ex-posures as a result of an increasing oxygen-to-carbon (O : C) ratio (Wong et al., 2011).
In an effort to better understand the influence of chemical aging on the CCN activity of BBA, recent studies have in-vestigated the influence of oxidative aging on particle hygro-scopicity of either particles generated in the laboratory from a specific emission source (Martin et al., 2013; Grieshop et al., 2009; Novakov and Corrigan, 1996) or particles col-lected in the field (Rose et al., 2010; Gunthe et al., 2009), which may include multiple emission sources. While field-collected particle studies of hygroscopic growth and cloud formation are advantageous because they capture the chemi-cal and physichemi-cal complexity of ambient aerosol, they lack the specificity and control of laboratory studies in order to fully understand the fundamental physico-chemical processes that govern cloud formation. Martin et al. (2013) investigated the impact of photo-oxidation on the hygroscopicity of wood burning particles and found that after several hours of aging in a smog chamber there was a general enhancement inκ; however, this was attributed to both condensation of oxidized organic or inorganic matter and oxidation of the particulate matter itself. However, the effects of OH-initiated oxidation on the hygroscopicity of BBA particles have not been exam-ined systematically. In this work, we investigate the effects of heterogeneous OH oxidation of laboratory-generated BBA surrogate particles on the particles’ hygroscopicity. Here,κ
highly water-soluble compounds, representing the range and complexity of atmospheric aerosol in regards to hygroscop-icity and chemical composition. κ is evaluated as a func-tion of OH exposure (i.e., [OH]×time) and O3exposure
us-ing a custom-built aerosol flow reactor (AFR) coupled to a CCNc. The chemical aging effects on the CCN activity of internally mixed and organic-coated inorganic particles are presented.
2 Materials and methods
2.1 Aerosol generation, flow conditions, and measurement
Surrogate polydisperse BBA particles were generated by atomizing 1 wt % aqueous solutions of single-component particles LEV, MNC, KS, and particle mixtures of LEV : MNC : KS in 1:1:0, 0:1:1, 1:0:1, 1:1:1, and 1:0.03:0.3 mass ratios in a flow of ultra-high purity (UHP) N2using a commercial atomizer (TSI Inc. model 3076). To
simulate the partitioning of MNC from the gas phase to the particulate phase, first reagent MNC was heated (up to
∼70◦C) and volatilized, and then condensed onto KS seed particles. Growth of the KS seed particles by MNC conden-sation was achieved by gradually cooling the mixed MNC– KS flow downstream of the heating section before entering the flow reactor. The atomized particles were dried by pass-ing the atomized flow through two diffusion dryers prior to entering the AFR. After exiting the AFR, the particles were subsequently dried in two additional diffusion dryers, where the overall sample flow RH≤5 %, before the size analysis and CCN activity measurements. This second drying stage was included in the experimental setup because the deriva-tion of κ requires knowledge of dry particle size. The dry particle size distribution was determined with a differential mobility analyzer (DMA, TSI Inc. model 3081) and a con-densation particle counter (CPC, TSI Inc. model 3772), and sampled at a total flow rate of 1.3 standard liters per minute (standard L min−1). Number-weighted mean particle diam-eters, Dp, for all of the particles investigated in this study
ranged from∼40 to 150 nm.
2.2 OH generation, flow conditions, and measurement OH radicals were generated via O3 photolysis in the
pres-ence of water vapor in a 60 cm long and 5 cm inner di-ameter (i.d.) temperature-controlled Pyrex flow reactor as shown in Fig. 1 (Slade and Knopf, 2013; Kessler et al., 2010; George et al., 2009). O3was produced by flowing 2–25 sccm
(standard cubic centimeters per minute) of UHP O2through
an O3-producing lamp (Jelight model 600; emission
wave-lengthλ=185 nm). O3concentrations ranged from 250 ppb
to 20 ppm and were monitored throughout the experiment using an O3photometric analyzer (2B Technologies model
202), which sampled at ∼850 sccm. An O3 denuder
con-taining a Carulite 200 catalyst was connected to the outlet of the AFR to convert O3to O2 before entering the aerosol
charge neutralizer and other sensitive instrumentation. A 50– 600 sccm flow of UHP N2 was bubbled in a 500 mL
Er-lenmeyer flask filled with distilled/deionized Millipore wa-ter (resistivity>18.2 Mcm) to generate humidified con-ditions in the AFR. The RH for all of the experiments was measured with an RH probe (Vaisala model HM70) and var-ied from 30 to 45 %. The humidifvar-ied and O3 flows were
mixed in a 4.5 L glass vessel before entering with the par-ticles into the AFR. The mixed N2/O2/O3/H2O and
parti-cle flow was then passed over a 60 cm O3-free quartz tube
containing a 60 cm long mercury pen-ray lamp (λ >220 nm) to photolyze O3. The lamp was cooled with a flow of
com-pressed air. Total flow rates in the flow reactor ranged from
∼2.2 to 3 standard L min−1, corresponding to a range in
res-idence times of 26–39 s. Flows were laminar, with Reynolds numbers between 60 and 80. OH concentrations were de-termined by applying a photochemical box model validated based on isoprene loss measurements in the presence of OH as described previously (Slade and Knopf, 2013; George et al., 2009). OH concentrations ranged from∼0.2×10¹⁰ to 2×10¹⁰molecule cm−3 and were varied by changing ei-ther RH or [O3]. As previous studies have indicated, neither
UV light nor O3 introduction in this manner leads to
parti-cle degradation or a significant change in partiparti-cle mass or chemistry (George et al., 2009; Kessler et al., 2010; Slade and Knopf, 2013). The temperature inside the flow reactor was maintained near 298 K by a cooling jacket. A slight temperature gradient of∼3◦C from the leading edge of the sheath flow tube containing the lamp to the inner walls of the AFR was observed, but has no significant effect on [OH]. OH equivalent atmospheric exposures were determined from the product of the residence time in the AFR and applied [OH], which was then normalized to a daily averaged ambient
[OH] =2×10⁶molecule cm−3. Using this method allowed varying atmospheric OH exposures equivalent to<1 day up to∼1 week. At the given [OH], residence time, total pres-sure of 1 atm, and particle sizes, we assume that OH mass transfer to the particles is sufficiently fast to maximize the exposure. At 40 % RH, the reactive uptake coefficient,γ, of LEV+OH would be 0.65 for atmospheric OH concentrations (Slade and Knopf, 2014). However, the presence of higher [OH] in the AFR decreasesγ to∼0.2 (Slade and Knopf, 2013). OH diffusion impactsγby only∼7 % (Fuchs and Su-tugin, 1970), implying that OH exposure is not diffusion lim-ited. At RH>15 %, MNC is less reactive with OH, exhibit-ingγ <0.07 due to competitive co-adsorption of water and OH (Slade and Knopf, 2014). Similar suppressions in gas up-take, due to competitive adsorption processes, have been ob-served in the case of OH and NO3uptake by BBA surrogate
films (Slade and Knopf, 2013; Knopf et al., 2011), O3uptake
by benzo[a]pyrene in the presence of water vapor (Pöschl et al., 2001), and O3 and NO2 uptake by
N2/Aerosol
N2
N2
O2
H2O
O3/O2
Mixing
v
essel
2B Tech.
O3monitor
filter
Aerosol Flow Reactor
O3denuder
UV lamp
λ=185 nm
Q2B=0.88 lpm RH sensor
Neutralizer
QCCN
=0.
3
lpm
QCPC=1 lpm
CPC
Blow
er
HEP
A
Filt
er
Excess flow QEX=10 lpm
Sheath flow QSH=10 lpm
Diff
usio
n
Dry
er
4
Diff
usio
n
Dry
er
3
Diff
usio
n
Dry
er
1
Diff
usio
n
Dry
er
2 DMA
Sample QS=1.3 lpm
OPC
Hum
idif
ier
Sheath Aerosol
CCN Counter
UV lamp: λ>220 nm Cooling
Figure 1.Schematic illustration of the experimental setup to examine the effect of OH and O3oxidation on the CCN activity of
single-component and multisingle-component biomass burning aerosol surrogate particles. From top left to bottom right: aerosol generation and drying stage, O3production and humidification (mixing vessel), the aerosol flow reactor, O3-free ultraviolet lamp and O3monitor, relative humidity
probe (RH sensor), O3denuder, second drying stages, aerosol sizing by the DMA and particle counting by the CPC, and determination of the CCN activity by the CCNc.
The presence of higher [O3] may further decrease the OH
reactivity of OA (Renbaum and Smith, 2011). Under the ap-plied experimental conditions, the multiphase reaction kinet-ics involving highly viscous organic material are likely lim-ited by surface–bulk exchange (Arangio et al., 2015; Slade and Knopf, 2014).
2.3 CCN measurements
The CCNc and operating conditions are described in more detail in Mei et al. (2013a). CCN activity data were acquired following procedures similar to previous studies (Petters and Kreidenweis, 2007; Petters et al., 2009), whereby the dry particle diameter is scanned while keeping the CCN cham-ber supersaturation fixed. A more detailed description of this approach is given in Petters et al. (2009). Briefly, particles first passed through a Kr-85 aerosol neutralizer (TSI 3077A), were size-selected using a DMA (TSI 3081), and processed in a CCNc (Droplet Measurement Technologies, Inc., single-column CCNc) (Roberts and Nenes, 2005; Lance et al., 2006; Rose et al., 2008), while in tandem the total particle con-centration was measured with a CPC. The CCNc was op-erated at a 0.3 standard L min−1 total flow rate and 10
:1 sheath-to-sample flow rate ratio. The total sample flow rate, which includes a 1 standard L min−1 CPC flow rate, was
1.3 standard L min−1, and a 10
:1.3 sheath-to-sample flow rate ratio was applied for the DMA. The temperature gra-dient in the CCNc column was set by custom-programmed Labview software and operated at1T =6.5, 8, 10, and 12 K, corresponding to chamber supersaturations S=0.2, 0.27, 0.35, and 0.425 %, based on routine calibrations applying atomized ammonium sulfate particles. The temperature gra-dient was stepped successively, from 6.5 to 12 K and in
re-verse. Each temperature gradient was maintained for a total of 14 min to allow an up and down scan of the particle size distribution by the DMA. The aerosol size distributions and size-resolved CCN concentrations were acquired by applying an inversion method described in Collins et al. (2002), which implicitly accounts for multiply charged particles. The ratio of the aerosol size distribution and CCN size distribution pro-vided size-resolved CCN activated fractions (i.e., the fraction of particles that become CCN at a given supersaturation and particle size).
2.4 Hygroscopicity and CCN activity determination The hygroscopicity and CCN activity can be described byκ -Köhler theory (KT) (Petters and Kreidenweis, 2007), which relates dry and wet particle diameter to the particle’s criti-cal supersaturation (RH above 100 %, at which the particle grows to a cloud droplet size) based on a single hygroscop-icity parameter,κ. Inκ-Köhler theory, the water vapor satu-ration ratio over an aqueous solution droplet as a function of droplet diameter,S(D), is given by
S(D)= D
3 −D3d D3
−Dd3(1−κ)exp
4σ Mw RT ρwD
, (1)
whereDis wet particle diameter,Ddis dry particle
diame-ter,σ is droplet surface tension,Mwis the molecular weight
of water,R is the universal gas constant,T is temperature, andρwis density of water.κ ranges typically from∼0.5 to
An alternative, approximate expression for determiningκ
is given as follows (Petters and Kreidenweis, 2007):
κ= 4A
3
27Dd3ln2Sc
, (2)
where
A=4σs/aMw RT ρw
. (3)
Sc represents the critical supersaturation, i.e., point of
su-persaturation where more than 50 % of the initial dry par-ticles are activated to CCN. Here, we assumeσs/ais
equiv-alent to that of water. While aqueous solutions of LEV and KS exhibit surface tensions approximately equal to the sur-face tension of water (Tuckermann and Cammenga, 2004; Tuckermann, 2007), to our knowledge no previous surface tension measurements of MNC aqueous solutions have been made. Our assumption applying the surface tension of wa-ter at all OH exposures could result in an overestimation of κ since the presence of surface-active organics can de-crease σs/a (George et al., 2009; Schwier et al., 2012;
Noz-iére et al., 2014; Harmon et al., 2013). We do not have sur-face tension data of the different mixtures applied in this study. However, we anticipate that increasing OH exposure may decreaseσs/a, thus enhancing the particle’s CCN
activ-ity as demonstrated in George et al. (2009) and Harmon et al. (2013).
Hygroscopic growth of compounds exhibiting moderate to weak solubility in water can be limited by their low water solubility (Petters and Kreidenweis, 2008), and thus cannot be treated as either fully dissolvable or insoluble substances. A theoretical treatment ofκ, which includes solubility limi-tations, has been detailed in Petters and Kreidenweis (2008). Here,
κ=εiκiH (xi) (4)
H (xi)=
1 ifxi ≥1
xi ifxi <1
, (5)
whereεis the volume fraction of the soluteiin the dry par-ticle.κi is the theoreticalκof soluteiin the absence of
solu-bility limitations and is given by
κi=
νρimw ρwmi
, (6)
whereν is the Van’t Hoff factor,ρi is the density of the
so-lute,ρw is the density of water,mi is the molar mass of the
solute, andmw is the molar mass of water.xi is defined as
the dissolved volume fraction of the solute (Petters and Krei-denweis, 2008) and given as
xi=Ci
Vw Vi
, (7)
whereCi is the water solubility of the solute, expressed as
the solute volume per unit water volume at equilibrium with saturation, andVi is the volume of the solute. For complete
dissociation, xi is equal to unity. The parameters listed in
Table 1 were used in predictingκ.
3 Results and discussion
3.1 CCN activity of BBA surrogate particles
Exemplary activated fractions, i.e., fractions of initial dry particle sizes activated to CCN, for LEV, MNC, KS, and the ternary particle mixtures at a chamber supersaturation of 0.425 %, are shown in Fig. 2. The activated fraction curves were fit to a cumulative Gaussian distribution function as de-scribed in detail previously (Petters et al., 2009):
f (x)=1
2erfc x
√
2
, (8)
wherex=(Dd–Dd,50)/σD. In the fitting procedure, Dd is
the dependent variable andDd,50 andσD are adjustable
pa-rameters to minimize the root mean square error between
f (x)and the data.Dd,50 is the dry diameter interpreted as
being where 50 % of the dry particles have activated into cloud droplets, also referred to as the critical particle diame-ter,Dp,c.
KS particles exhibit the smallest particle activation diam-eter of∼50 nm, followed by LEV particles at∼75 nm, and MNC particles at∼210 nm atS=0.425 %. In this study,κ
is derived from Eq. (2), whereS is evaluated at 0.2, 0.27, 0.35, and 0.425 % is used in place ofSc, andDdis the
de-terminedDp,c. At lowerS, the activated fraction curves are
shifted to larger sizes since the smaller particles do not acti-vate at lowerS.
Table 2 lists the derivedκ values for all of the particle types employed in this study in comparison to literature val-ues. The reported uncertainties inκ are±1σ from the mean
κ derived at eachS. The derivedκ values for LEV and KS are consistent withκ for LEV and KS given in the literature. The critical diameter of LEV (∼70 nm atS=0.425 %) is in good agreement with the critical diameter of LEV mea-sured by Petters and Kreidenweis (2007) at the same S. κ
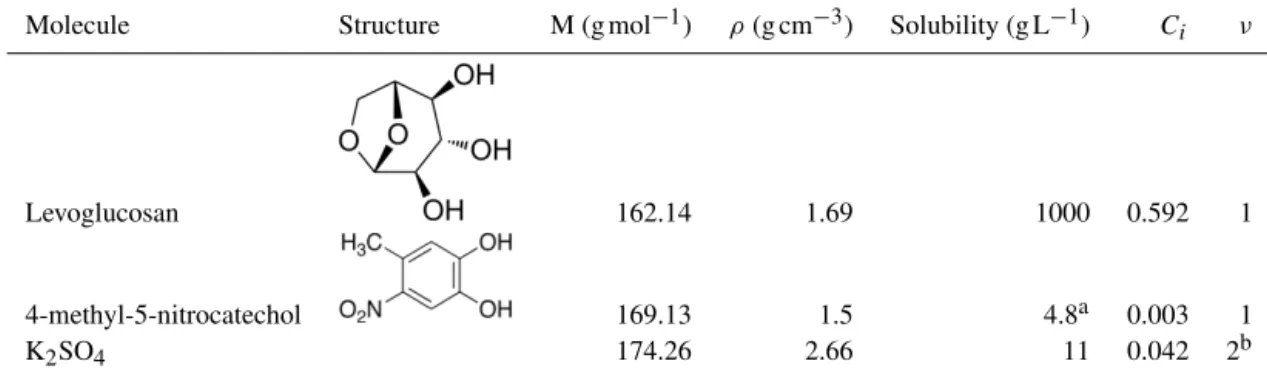
Table 1.Chemical properties of the different particle types investigated in this study and the parameters used in predictingκ.
Molecule Structure M (g mol−1) ρ(g cm−3) Solubility (g L−1) Ci ν
Levoglucosan 162.14 1.69 1000 0.592 1
4-methyl-5-nitrocatechol 169.13 1.5 4.8a 0.003 1
K2SO4 174.26 2.66 11 0.042 2b
aEstimated using the US Environmental Protection Agency’s Estimation Program Interface (EPI) suite (EPI , 2015).bTaken from the reported Van’t Hoff factor in Low (1969) for(NH4)2SO4assuming a solution droplet molality of approximately 0.2.
0.0 0.2 0.4 0.6 0.8 1.0
Acti
v
ated
Fraction
20 50 100 200
D
p/ nm
LEV MNC KS 1:1:1 1:0.03:0.3
Figure 2.Activated fractions, i.e., fractions of the number of par-ticles at a given particle size activated to CCN as a function of the initial dry particle diameter, for LEV (green), MNC (orange), KS (blue), 1:1:1 (red) and 1:0.03:0.3 (black) particles atS=
0.425 %. The dotted lines correspond to the fits applying Eq. (8).
the scanned particle size range is not sufficient to give the complete activation curve. As a result, the Dp,c could not
be reliably derived. For comparison, humic-like substances (HULIS), which is known to contain nitrocatechols (Claeys et al., 2012), exhibits aκvalue of 0.05 (Carrico et al., 2010). In addition, κ for NO3 oxidized oleic acid particles,
com-prising similar chemical functionalities as MNC (i.e., nitro-gen oxides and conjugated double bonds), is∼0.01 (Petters et al., 2006).
On average,κ for all of the binary and ternary mixed par-ticles range from 0.111 (±0.010) to 0.373 (±0.034). Due to constraints in water uptake and water solubility, mixed parti-cles comprising a significant fraction of MNC (i.e., 1:1:0, 0:1:1, 1:1:1) exhibit relatively lowerκ than the 1:0:1 mixture. The 1:0.03:0.3 ternary-component particles ex-hibit a slightly lowerκ compared to the other particle mix-tures, due to the relatively low KS content. It is not entirely
clear why the particles exhibit lowerκatS=0.2 %. This im-plies that either the supersaturation used to deriveκ was ar-tificially high, the van’t Hoff factor is lower, or limitations in solubility are more pronounced at this lower supersaturation than at higher supersaturations. The calibration data applying ammonium sulfate particles yield a variability in the derived supersaturation atS=0.2 % of∼5 %, which still results in less variability in the derivedκvalues at that supersaturation compared to what was observed.
As listed in Table 2, the derivedκ values are reasonably predicted by applying the volume mixing rule (Petters and Kreidenweis, 2007):
κ=κOrg×εOrg+κInorg(1−εOrg), (9)
whereκOrg andκInorg are the κ values of the organic and
inorganic particles, respectively, andεOrgis the organic
vol-ume fraction of the particles. However, the quality of the es-timate depends on whether the effects of solubility are to be included. For example, applying the experimentally de-rived κ of MNC particles in the volume mixing rule re-sults in a significant underprediction of κ for the 1:1:0, 0:1:1, and 1:1:1 particle mixtures. This deviation in κ
Krei-Table 2.Tabulated experimentally derived hygroscopicity parameters, κ, for the various particle types investigated in this study before oxidation.
Compound κa κb κc
0.2 % 0.27 % 0.35 % 0.425 %
LEV 0.149 (±0.008) 0.175 (±0.010) 0.172 (±0.009) 0.176 (±0.009) 0.188 0.165d
0.208 (±0.015)e
KS 0.525 (±0.052) 0.575 (±0.026) 0.563 (±0.024) 0.538 (±0.074) 0.55 0.52d
MNC N/A 0.013 (±0.003) 0.012 (±0.005) 0.008 (±0.002) 0.16
LEV : MNC : KS κa κb
Mass ratio 0.2 % 0.27 % 0.35 % 0.425 %
1:1:0 0.114 (±0.010) 0.143 (±0.016) 0.131 (±0.005) 0.137 (±0.009) 0.173
1:0:1 0.310 (±0.047) 0.360 (±0.031) 0.373 (±0.029) 0.373 (±0.034) 0.329
0:1:1 0.239 (±0.030) 0.336 (±0.068) 0.331 (±0.014) 0.322 (±0.015) 0.300
1:1:1 0.216 (±0.029) 0.255 (±0.012) 0.270 (±0.013) 0.268 (±0.013) 0.256
1:0.03:0.3 0.209 (±0.010) 0.233 (±0.008) 0.232 (±0.005) 0.234 (±0.022) 0.241
aThis study. Reported uncertainties are 1σfrom the mean in the derivedκ. bPredicted values applying the volume mixing rule without solubility limitations. cLiterature-reported values.
dCarrico et al. (2010). ePetters and Kreidenweis (2007).
denweis (2008). As a result and depending on the volume fraction of the sparingly soluble compounds in the particle, the peak of the Köhler curve may occur at a sufficiently large droplet size when all compounds, including the sparingly sol-uble compounds, are completely dissolved. The same can be applied here for the mixtures containing an appreciable MNC volume fraction. The water solubility of MNC is approxi-mated asC=0.003, which is categorized as sparingly water-soluble (Petters and Kreidenweis, 2008). To verify whether MNC behaves as if it is infinitely soluble in a solution with KS, Fig. 3 shows derived Köhler curves of pure MNC and mixtures containing variable KS volume fractions and the MNC dissolved fraction,xMNC. In Fig. 3, the critical
super-saturation, i.e., the maximum in the Köhler curve, decreases with increasing KS volume fraction. Accordingly, the MNC dissolved fraction increases with an increasing KS volume fraction. At a KS volume fraction of∼36 % (MNC volume fraction of∼64 %) indicated by the orange curves in Fig. 3, the maximum in the Köhler curve corresponds toxMNC≈1,
implying that CCN activation is not limited by MNC sol-ubility. This MNC volume fraction corresponds to the 1:1 by mass MNC : KS particles, which suggests that for this particular mixture, MNC behaves as if there are no solubil-ity limitations during CCN activation (i.e., infinitely soluble, equivalent to C=∞) andκ of MNC can be predicted using Eq. (6). This result is consistent with the 1:1:1 by mass LEV : MNC : KS particles. In the presence of LEV, alone, MNC remains slightly insoluble during CCN activation.
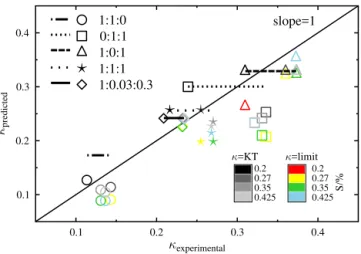
Figure 4 shows the predictedκplotted against experimen-tally derivedκ for all of the particle mixtures andSapplied in this study.κwas predicted by applying the volume mixing rule under three different scenarios: (1) calculated from
ex--1.0 -0.5 0.0 0.5 1.0 1.5
S
/
%
10-4
10-3
Dissolv
ed
M
NC
fr
action
/
xMNC
10-7 10-6
Dp/ m
CMNC=0.003
KS=15% KS=5%
KS=36%
Figure 3. Example Köhler curves (solid lines) calculated from Eq. (1) for pure MNC (black), MNC mixed with 5 % (blue), 15 % (green), and 36 % (orange) by volume KS. The dotted lines are the dissolved fractions of MNC,xMNC, calculated from Eq. (7), corre-sponding to the different Köhler curves. The vertical dashed lines indicate the maxima of the different Köhler curves. The dry diame-ter applied is 110 nm.
0.1 0.2 0.3 0.4
predicted
0.1 0.2 0.3 0.4
experimental
1:1:0 0:1:1 1:0:1 1:1:1 1:0.03:0.3
slope=1
0.2 0.2
0.27 0.27
0.35 0.35
0.425 0.425
=KT =limit
S/
%
Figure 4.Predictedκas a function of experimentally derivedκat different supersaturation (S) for the binary and ternary particle mix-tures of LEV, MNC, and KS.κis predicted by applying the volume mixing rule and based on single-component experimentally derived
κat eachSincluding solubility limitations (κ=limit; color scale),κ
calculated from Köhler theory (κ=KT; gray scale), andκ assum-ing no solubility limitations (horizontal lines). Note that the hori-zontal lines span the range of experimentally derivedκ. The black diagonal line represents a slope of 1 in the derived vs. predicted
κ. The LEV : MNC : KS mass ratios are indicated in the legend for 1:1:0 (circle), 0:1:1 (square), 1:0:1 (triangle), 1:1:1 (star), and 1:0.03:0.3 (diamond).
MNC, alone, could not be derived experimentally at that su-persaturation. As discussed previously, this underprediction is due to the enhancement in MNC water solubility when in the presence of water-soluble LEV and KS, which is not accounted for applying the experimentally derived single-componentκ. Applying Köhler theory results in better agree-ment with the experiagree-mentally derivedκ, particularly for the 1:1:0 particle mixture. Predictedκ assuming no solubility limitations results in an overprediction for the 1:1:0 parti-cle mixture, but is in best agreement with the experimentally derived κ for all other mixtures. The ability to predict ex-perimentally derivedκof the mixtures applying Köhler the-ory depends on the solubility and volume fractions of the different particle components, which have not all been mea-sured. The solubility of MNC was estimated from the US En-vironmental Protection Agency’s Estimation Program Inter-face (EPI) suite (EPI , 2015). Applying this estimated solu-bility results in an underprediction in the 0:1:1 and 1:1:1
κ, but is in best agreement for the 1:1:0 particle mixture. These results support the finding that the volume mixing rule is most accurate when accounting for the changes to water solubility when the components are mixed. In the presence of LEV, MNC remains slightly insoluble. However, in the presence of KS, MNC behaves as if there are no solubility limitations during CCN activation.
3.2 CCN activity of single-component BBA surrogate particles exposed to OH
Surrogate single-component BBA particles were oxidized in the presence of O3 (mixing ratio, χO3=0.76–20 ppm)
and in the presence of OH radicals (0.2×10¹⁰–2×
1010molecule cm−3), corresponding to <1 day up to
∼1 week of a 12 h daytime OH exposure at [OH] =2×
106molecule cm−3.κ as a function of O3exposure is
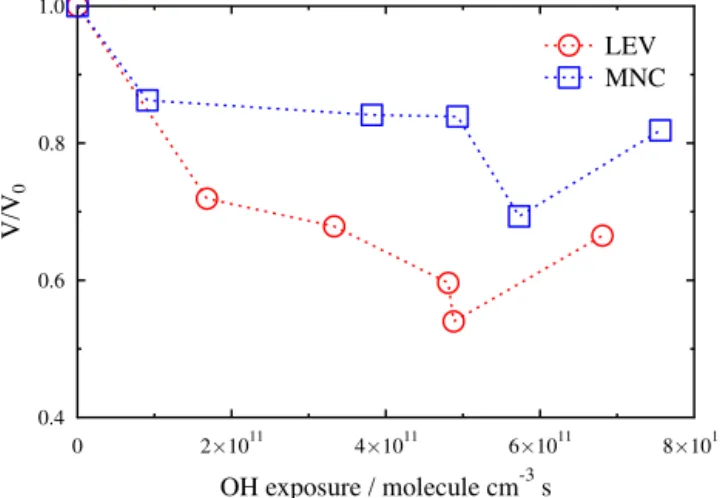
pre-sented in the Supplement. Upon exposure to OH, both LEV and MNC particles exhibited significant chemical erosion due to molecular fragmentation and volatilization (George et al., 2009; Kessler et al., 2010; Slade and Knopf, 2013). Figure 5 shows the evolution of LEV and MNC particle vol-ume in the presence of OH,V(Hg lamp on, with O3),
nor-malized to the initial particle volume just before switching on the Hg lamp, V0 (Hg lamp off, with O3), as a function
of OH exposure. Following OH exposure, the average de-crease in particle volume for all OH exposures for LEV and MNC particles was 36 (±7) and 19 (±7) %, respectively. In general, OH exposure led to an increase in LEV modal parti-cle diameter and a decrease in MNC modal partiparti-cle diameter. The increase in LEV modal particle diameter in combination with a decrease in total particle volume suggests the smallest LEV particles experienced the most chemical erosion. Oc-casionally, a second smaller size mode developed following OH oxidation of pure MNC particles. While the exact mech-anism for the formation of the smaller mode is not clear, we speculate that OH oxidation of gas-phase MNC could lead to in situ particle formation in the flow reactor. Particle size is not expected to alterκ directly unless a change in particle size coincides with a change in particle composition. Given that there are two different particle populations and presum-ably two different particle compositions following OH oxi-dation of MNC, the newly formed particles may affect the derivedκ. Clearly, more careful control and study of the par-ticle size distribution are needed to resolve the impacts of volatilization, but are beyond the scope of this study.
0.4 0.6 0.8 1.0
V/V
0
0 2 1011 4 1011 6 1011 8 1011
OH exposure / molecule cm-3s
LEV MNC
Figure 5.LEV and MNC particle volume change as a function of OH exposure. The measured particle volume in the presence of OH (V; Hg lamp on, with O3) is normalized to the measured particle
volume in the absence of OH (V0; Hg lamp off, with O3).
Conversely, MNC κ increases significantly from∼0.01 to
∼0.1 with increasing OH exposure at all appliedS.
The reactive uptake, condensed-phase reaction products, and volatilized reaction products resulting from heteroge-neous OH oxidation of LEV are well documented (Kessler et al., 2010; Hoffmann et al., 2010; Bai et al., 2013; Slade and Knopf, 2013, 2014; Zhao et al., 2014). However, there are no direct measurements of its CCN activity following OH oxidation. Kessler et al. (2010) showed that following OH exposure, particle volatilization accounts for a ∼20 % by-mass loss of LEV. This suggests that the majority of the reaction products, which include carboxylic and aldehydic species (Bai et al., 2013; Zhao et al., 2014), remain in the condensed phase. Although volatilization due to high OH ex-posures has been linked to an increase in the critical super-saturation and thus suppression in the CCN activity of ox-idized squalane particles (Harmon et al., 2013), the results here suggest that, regardless of volatilization, the condensed-phase reaction products are just as or somewhat more ac-tive CCN than pure LEV. On average, there is only a slight increase in κ for LEV particles, with increasing OH expo-sure as indicated by the positive slope in the linear fit to the data at all appliedS. Such an incremental enhancement inκ
may be a result of similarκ between LEV and its oxidation products. The hygroscopicity of several carboxylic acids that may represent levoglucosan OH oxidation products, includ-ing malonic, glutaric, glutamic, succinic, and adipic acid, ex-hibits κ values between 0.088 and 0.248 (Petters and Krei-denweis, 2007), similar toκ of oxidized and pure LEV. Fur-thermore, the hygroscopicity of organic compounds contain-ing hydroxyl functionalities similar to LEV or carboxylic groups are nearly equivalent (Suda et al., 2014). We also cannot rule out that volatilization, while reducing particle mass, also removes newly formed reaction products from the
0.12 0.14 0.16 0.18 0.2 0.22
80 100 120 140
Dp,crit
/
nm
0 2 4 6 8
OH exposure / 1011molecule cm-3s 0.0 0.04 0.08 0.12 0.16
50 100 150 200 250 300
Dp,crit
/
nm
0 2 4 6 8 10
OH exposure / 1011molecule cm-3s
LEV MNC
0.2 0.27 0.35 0.425
S/%
Figure 6.Derivedκ(top) and critical particle diameter (bottom) for LEV and MNC particles are shown as a function of OH exposure. As indicated in the legend, the colors represent the different super-saturations (S) accessed during this study. The vertical error bars represent±1σ from the mean of the data acquired at a given OH exposure andS. Horizontal error bars correspond to the uncertainty in the OH exposure based on a±5 % drift in RH over the sampling period. The dotted lines show the best linear fit to the OH exposure data as a function ofS.
aerosol phase, leaving the parent organic (i.e., LEV) and thus
κunchanged.
The CCN activity of MNC aerosol particles increases with OH exposure as shown in the top right panel of Fig. 6. MNC becomes more CCN active with increasing OH exposure and
κ transitions from∼0.01 in the absence of OH to∼0.1 for OH exposures equivalent to a few days in the atmosphere. Further exposure (≥4×10¹¹molecules cm−3s−1) does not
significantly enhance MNC κ, which suggests that MNC or the particle surface is fully oxidized (Slade and Knopf, 2014) and that the reaction products reach a maximum inκ. Similar enhancements inκ and subsequent constantκ val-ues with increasing OH exposure have been observed for or-ganic aerosol with initially low hygroscopicity (George et al., 2009; Lambe et al., 2011). For example, George et al. (2009) observed thatκof BES increased from∼0.008 to∼0.08 for an OH exposure of∼1.5×10¹²molecule cm−3s, andκ of stearic acid increased from∼0.004 to∼0.04 due to an OH exposure of∼7.5×10¹¹molecule cm−3s.
The enhancement in MNCκ following OH exposure may be linked to the formation of more hydrophilic chemical functionalities. Strongly linked to enhancements in OA hy-groscopicity are larger O : C ratios (Massoli et al., 2010; Lambe et al., 2011; Mei et al., 2013a, b; Suda et al., 2014). Neglecting the oxygen atoms in the -nitro functionality of MNC (Suda et al., 2014), the O : C ratio of pure MNC is
nitro-phenolic species, OH oxidation of MNC can favor re-moval of the -nitro functionality by electrophilic substitu-tion of OH (Slade and Knopf, 2013; Di Paola et al., 2003; Chen et al., 2007). OH substitution at the -methyl position and addition to the double bonds is also possible (Anbar et al., 1966). OH addition to the -nitro or -methyl functional-ity would increase O : C to∼0.43 or∼0.5, respectively. OH substitution at both positions would enhance O : C to∼0.67. Suda et al. (2014) showed that hydroxyl-dominated OA with an O : C of less than∼0.3 has an apparentκof≤10−3. How-ever, an increase in O : C to 0.4 or 0.6 due to the addition of hydroxyl, aldehydic, or carboxylic functionalities results in an enhanced κ of ∼0.1. Thus, small changes in O : C can significantly affect κ. Pure MNC is also sparingly soluble in water and thusκ is strongly dependent on its actual sol-ubility, which can change depending on the oxidation level and the presence of other compounds having different sol-ubility (Petters and Kreidenweis, 2008). Consequently, the conversion from low to high κ following OH oxidation is consistent with the addition of more hydrophilic function-alities and a molecular transition from sparingly soluble to sufficiently water-soluble. Interestingly, MNC, while having a 10 times smaller OH uptake coefficient compared to LEV at the same RH (Slade and Knopf, 2014), exhibits a greater change in κ than LEV following OH oxidation. Under dry conditions, we understand uptake is limited by surface–bulk processes (Arangio et al., 2015; Slade and Knopf, 2014). In that case, due to the low hygroscopicity and low water solu-bility of MNC, its viscosity may be sufficiently high that ox-idation is limited to the particle surface. Consequently, MNC surface molecules may undergo several generations of oxida-tion as opposed to LEV, which is known to undergo a semi-solid to liquid-phase transformation at the same RH=40 % (Mikhailov et al., 2009). However, assessing the effects of RH or bulk diffusivity on hygroscopicity following OH ex-posure is beyond the scope of the current work.
3.3 CCN activity of binary-component BBA surrogate particles exposed to OH
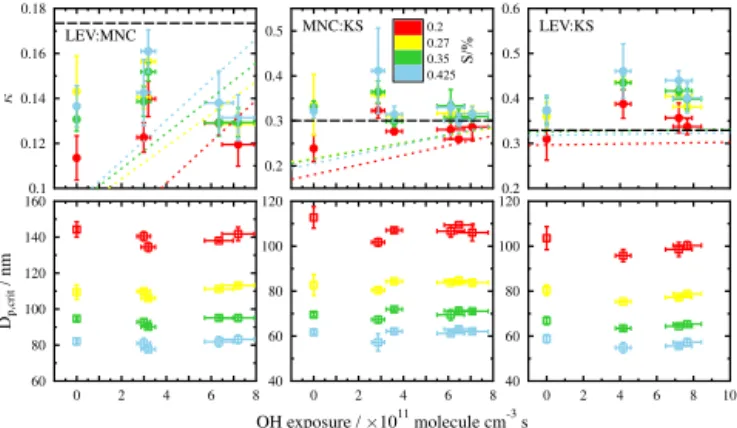
Binary-component particles consisting of LEV : MNC, LEV : KS, and MNC : KS in 1:1 mass ratios were exposed to OH and analyzed for their hygroscopicity as a function of OH exposure. The approach here is to determine whether the presence of more than one component can influence the hygroscopicity of another following OH and oxidation; i.e., are the observed changes in hygroscopicity of the pure-component particles following OH oxidation retained when mixed? Figure 7 shows κ and the critical particle diameter for the different binary aerosol mixtures as a function of OH exposure for each appliedS.κas a function of O3exposure is
presented in the Supplement. The dotted and dashed lines in Fig. 7 display the predictedκas a function of OH exposure using the volume mixing rule including and excluding MNC solubility limitations, respectively, based on the linear fits of
0.1 0.12 0.14 0.16 0.18
60 80 100 120 140 160
Dp,crit
/
nm
0 2 4 6 8
0.2 0.3 0.4 0.5
40 60 80 100 120
0 2 4 6 8
OH exposure / 1011molecule cm-3s
0.2 0.3 0.4 0.5 0.6
40 60 80 100 120
0 2 4 6 8 10
LEV:MNC MNC:KS 0.20.27 LEV:KS
0.35 0.425
S/%
Figure 7.Derivedκ(top) and critical particle diameter (bottom) for the binary-component particles with 1:1 mass ratios are shown as a function of OH exposure. As indicated in the legend, the col-ors represent the different supersaturations (S) accessed during this study. Error bars are calculated as in Fig. 6. The dotted lines are modeledκ using the volume mixing rule as a function of OH ex-posure applying the linear fit to the derivedκ of pure MNC and LEV as a function of OH exposure (Fig. 6). The dashed black lines are the modeledκusing the volume mixing rule and assuming no solubility limitations.
κas a function of OH exposure for pure LEV and MNC par-ticles (Fig. 6) at eachS. Modeledκas a function of OH expo-sure excluding MNC solubility limitations (i.e., black dashed lines in Fig. 7) assumes thatκ for MNC of the mixed parti-cles is 0.16.
changes following oxidation, due to their low water solubil-ity. In other words, there is more room for an enhancement in the solute effect of sparingly soluble organic particles than there is for more water-soluble particles. Our results show that oxidative aging impacts on the hygroscopicity of pure-component particles can be vastly different if the particles are internally mixed with substances having different water solubility.
3.4 CCN activity of ternary-component BBA surrogate particles exposed to OH
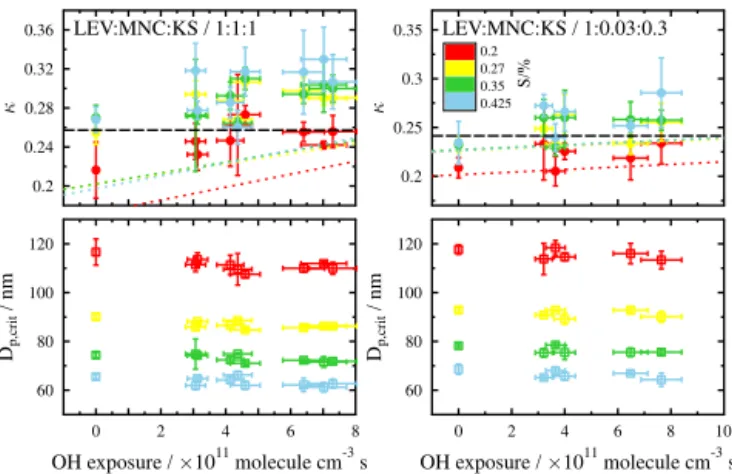
Here we investigate the CCN activity of internally mixed LEV, MNC, and KS particles with 1:1:1 and with an atmospherically relevant mass ratio of 1:0.03:0.3 (LEV : MNC : KS) following exposure to OH. The results for the OH exposure are shown in Fig. 8 andκas a function of O3exposure is presented in the Supplement.
Within the uncertainty of the derivedκvalues for the 1:1:
1 and 1:0.03:0.3 ternary-component particles, their hygro-scopicities are virtually unaffected by OH exposure, similar to the binary mixtures. However, on average the 1:1:1 par-ticle mixture exhibits a slight enhancement in hygroscopic-ity. The predictedκvalues for the 1:1:1 mixture, which in-clude MNC solubility limitations (dotted lines), significantly underestimate κ, and only after removing these limitations (black dashed line) does the predicted κ agree with the ex-perimentally derivedκ. This is not surprising, given that the more water-soluble components LEV and KS are present at equal mass to MNC. Thus MNC behaves as if it is infinitely soluble during CCN activation. One possible explanation for the slight enhancement inκwith OH exposure, which differs from the binary mixed particles, is the presence of both MNC and LEV, which both exhibit enhancements inκ following OH oxidation. However, the range in derived κ at a given OH exposure is sufficiently large that, within experimental uncertainty, there is no significant trend inκ with OH expo-sure.
The WSOC, mostly LEV, is known to dominate the BBA volume fraction (Dusek et al., 2011). MNC constitutes≤5 % by mass of the BBA organic fraction as determined from both field and lab chamber studies (Iinuma et al., 2010; Claeys et al., 2012). The remaining fraction can be largely com-posed of inorganic salts, including KS (Pósfai et al., 2003; Rissler et al., 2006). To simulate atmospheric BBA, we at-omized a mixed aqueous solution of LEV, MNC, and KS in a mass ratio of 1:0.03:0.3 and determined its CCN activity unexposed and after exposure to OH and O3. The resultingκ
of this mixture as a function of OH exposure is displayed in the top right panel of Fig. 8. As anticipated, since pure LEV shows little enhancement in CCN activity with OH exposure (Fig. 6) and dominates the volume fraction of this mixture, and KS is unreactive to OH, no enhancements in κ follow-ing OH exposure were observed. A similar observation was made from laboratory-controlled burns, whereby following
0.2 0.24 0.28 0.32 0.36
60 80 100 120
Dp,crit
/
nm
0 2 4 6 8
OH exposure / 1011molecule cm-3s 0.2 0.25 0.3 0.35
60 80 100 120
Dp,crit
/
nm
0 2 4 6 8 10
OH exposure / 1011molecule cm-3s LEV:MNC:KS / 1:1:1 LEV:MNC:KS / 1:0.03:0.3
0.2 0.27 0.35 0.425
S/%
Figure 8.Derivedκ(top) and critical particle diameter (bottom) for the ternary-component particles with LEV : MNC : KS mass ratios 1:1:1 (left) and 1:0.03:0.3 (right) are shown as a function of OH exposure. As indicated in the legend, the colors represent the different supersaturations (S) accessed during this study. The dashed black lines are calculated as in Fig. 7 and error bars and dotted lines are calculated as in Figs. 6 and 7, respectively.
several hours of photo-oxidation, there were very slight en-hancements inκof the particles (Martin et al., 2013). Larger enhancements inκwere observed only for the SOA particles generated from oxidative aging of gas-phase volatiles emit-ted during the controlled burns, in the absence of seed parti-cles (Martin et al., 2013). This implies that photo-oxidative aging of BBA may contribute little to changes in its hygro-scopicity, unless the entire aerosol population is comprised of SOA material (e.g., MNC). Furthermore, both predictedκ
including solubility limitations and without solubility limita-tions are in agreement with the derived values. This is due to the low mass fraction of MNC present, which has sufficiently low impact on both the solubility and oxidation level of the mixed aerosol particles.
3.5 Mixing state effects onκ
has an effect on its CCN activity following OH exposure by the application of MNC-coated particles in comparison to the atomized MNC : KS binary-component particles. For exam-ple, Abbatt et al. (2005) observed a complete deactivation in the CCN activity of ammonium sulfate particles when thickly coated with stearic acid.
The CCN activity of KS particles coated with MNC was derived as a function of the organic volume fraction (Vf,org)
of MNC, and before and after OH exposure as shown in Figs. 9a–c. Figure 9a displays a color map of the dry KS par-ticle size distribution evolution following exposure to MNC in the absence of OH, where time=0 min is the point at which KS particle growth by MNC condensation begins. The 25th, 50th, and 75th percentiles of the number-weighted par-ticle size distribution grew in size by∼20 nm as indicated by the red, black, and blue circles in Fig. 9a, respectively. For the 50th percentile, this corresponds to an enhancement in the MNCVf,orgfrom 0 % at time=0 min to∼70 % shortly
after, close to the Vf,org of the atomized MNC : KS
binary-component particles of 64 %. The similarVf,orgbetween the
atomized and coated MNC-KS particles enables a direct in-tercomparison of their hygroscopicity, since relatively larger MNC Vf,orgwould bias towards lower κ and vice versa, as
indicated in the colored dashed and dotted lines in Fig. 9b. The particles’ hygroscopicity was analyzed throughout the period of condensational growth as demonstrated in Fig. 9b and shown as the black circles. It is important to note that the particle size distribution is scanned (up and down voltage scans) at four differentS(0.2, 0.27, 0.35, and 0.425 %) in as-cending and desas-cending order, a process that takes roughly 90 min. In contrast to the atomized binary-component parti-cles, here KS particles grow due to MNC condensation over this experimental time period. Hence, the DMA and CCNc capture the size distribution and CCN activity of a time-dependent and compositionally different particle population at each scan. The black line in Fig. 9b displays the steps in S over the course of the experiment. The first twoκ values are of pure KS particles evaluated atS=0.2 %. Subsequent
κ values are of MNC-coated KS particles, which increase in
Vf,orgwith time. The change inVf,orgwith time is indicated
by the red, black, and blue circles according to the 25th, 50th, and 75th percentiles of the particle population, respectively.
Vf,orgallows one to compare derivedκwith that predicted
us-ing the volume mixus-ing rule. As previously discussed, the sol-ubility limitations of pure MNC can be neglected when pre-dictingκ of the atomized 1:1 mass ratio MNC : KS binary-component particles. To determine whether the solubility of MNC impacts the MNC-coated KS particles similarly to the atomized mixture, κ is predicted using the volume mixing rule and applying the experimentally derived pure MNC κ
corresponding to a specific S(i.e., including solubility lim-itations), as indicated by the dotted lines in Fig. 9b, and compared to predicted κ applying a pure MNC κ of 0.16 (i.e., pure MNC κ in the absence of solubility limitations calculated from Eq. 6), as indicated by the dashed lines in
75th%
50th%
25th%
A
B
C
MNC coating 0.2
0.27 0.35 0.425
C=limit
C=
S/%
Figure 9.CCN activity of MNC-coated KS particles before and after exposure to OH. Panel(a)shows a color map of the number-weighted particle size distribution (dN) of KS and MNC-coated KS particles plotted as a function of MNC coating before exposure to OH. The open circles in panel(a)refer to the measured percentiles of the total particle population (25th: red; 50th: black; 75th: blue). Panel(b)displays the change in particle hygroscopicity (filled cir-cles) and MNC volume fraction (Vf,org, open circles) with time as
a function ofSgiven as a black solid line corresponding to the data presented in panel(a). The dotted lines show the predictedκusing the volume mixing rule corresponding to theVf,orgat a given time
and based on the experimentally derivedκfor KS and MNC given in Table 1 as a function ofS. The dashed lines represent the predictedκ
using the volume mixing rule corresponding to theVf,orgat a given
time and assuming the CCN activity of MNC is not limited by its solubility (i.e., MNCκ=0.16 calculated from Eq. 6). Panel(c) dis-plays the change inκfor the MNC-coated KS particles as a function ofVf,org, OH exposure, andS. OH unexposed particles are plotted
as open circles. Filled circles correspond to particles exposed to OH at 3.3×10¹¹molecule cm−3s. The error bars represent 1σfrom the mean inκ. The colored dotted lines show predictedκas a function ofVf,orgat differentSusing the volume mixing rule assuming the
CCN activity of MNC is limited by its solubility. The black dashed line shows the predictedκusing the volume mixing rule assuming the CCN activity of MNC is not limited by its solubility.
Fig. 9b. The predictedκwith increasingVf,orggenerally
cap-tures the trend in experimentally derivedκ with increasing
Vf,org; however, similarly to the atomized MNC : KS
there are notable deviations between derivedκand predicted
κ in both cases, which depend onS. For example, in Fig. 9b, the predictedκincluding MNC solubility limitations (dotted line) is in better agreement with the derivedκatS=0.425 % than at lower S. At higherS, the particles that activate first are smaller in diameter than the particles that activate first at lowerS. Assuming differently sized KS particles were ex-posed to an equal quantity of gas-phase MNC, the larger par-ticles, having relatively larger surface areas than the smaller KS particles, would acquire a thinner organic coating, and thus relatively smallerVf,org. As a result, the particles that
ac-tivate atS=0.425 % possess a largerVf,orgcompared to the
particles that activate at, e.g.,S=0.2 %. This corresponds to a decrease in derivedκatS=0.425 % (i.e., better agreement with predictedκ including MNC solubility limitations) rel-ative to otherSas indicated in Fig. 9b. The generally better agreement in the predictedκexcluding MNC solubility limi-tations with the experimentally derivedκindicates that MNC is sufficiently water-soluble to not deactivate KS, in contrast to the particle systems studied by Abbatt et al. (2005). One possible explanation for the higher than expectedκwhen KS is coated with MNC is that the particle-phase diffusivity is sufficiently high to allow water molecules to penetrate the KS core (Koop et al., 2011).
The effects of OH exposure on the CCN activity of MNC-coated KS particles as a function ofVf,orgare given in Fig. 9c. κ is plotted as a function of MNC Vf,org. The κ values
re-sulting from an OH exposure of 3.3×10¹¹molecule cm−3s are given by the filled circles, whereby the different colors represent the applied Sduring the experiment. Open circles correspond toκ in the absence of OH. AtVf,org=0 %,κ is ∼0.55 and independent of OH exposure.κ decreases when
Vf,org≈70 %, but undergoes a slight enhancement following
OH exposure. The dotted lines indicate the modeled change inκ as a function ofVf,orgapplying the volume mixing rule
and applying the experimentally derivedκfor MNC and KS at a givenS(i.e., including MNC solubility limitations). Sim-ilar to the atomized 1:1 MNC : KS binary-component parti-cles, modeledκas a function ofVf,orgunderpredicts the
ex-perimentally derived OH-unexposedκ, even after accounting for the enhancements in pure-component MNCκ due to the high OH exposure. This suggests that in the presence of KS at thisVf,org≈70 %, MNC may not be limited by its solubility,
similar to the atomized 1:1 mass ratio MNC : KS binary-component particles, and that OH exposure can have very little impact on the CCN activity of sparingly soluble organ-ics coated on water-soluble compounds. However, the dashed black line shows the modeledκ as a function ofVf,org
apply-ing the volume mixapply-ing rule and assumapply-ing MNC is not limited by its solubility, i.e., MNCκ=0.16, which slightly overpre-dicts the derivedκ, but is in better agreement with the trend in experimentally derivedκfor the OH-exposed particles (filled circles, Fig. 9c). A reasonable explanation for this is that
Vf,org≈70 % is sufficiently large such that MNC solubility
limitations on the CCN activity of MNC-coated KS
parti-cles are partially exhibited. While OH exposure has a signifi-cant impact on the CCN activity of pure MNC, its impact on the CCN activity of MNC-coated KS particles is significantly less. The higher water solubility of KS appears to govern hy-groscopic growth, similar to the atomized MNC : KS binary-component particles. This suggests that the water solubility of the more soluble component of mixed-component aerosol particles can be more important for CCN activation than the actual mixing state of the particle.
4 Conclusions
To our knowledge, there are no studies that have explic-itly investigated the influence of OH-initiated oxidative ag-ing on the hygroscopicity of organic and mixed organic– inorganic BBA particles. Biomass burning can greatly fluence cloud formation and microphysical properties by in-creasing the available CCN in the atmosphere (Andreae et al., 2004). However, the efficiency at which aerosol particles act as CCN depends on their water solubility, hygroscopicity, and size, which can be altered by multiphase chemical re-actions with gas-phase oxidants. While it is recognized that a significant fraction of BBA is comprised of organic mate-rial (Reid et al., 2005), most of which is water-soluble (Dusek et al., 2011; Graham et al., 2002), water uptake can be sen-sitive to the inorganic mass fraction (Semeniuk et al., 2007; Ruehl et al., 2012). In this study we investigated how sensi-tive the CCN activity of single-component and mixed water-soluble/water-insoluble compounds associated with BBA are to OH oxidation. The important findings relevant to the at-mosphere include that (i) the hygroscopicity of water-soluble organic compounds is unaffected by chemical aging, (ii) the hygroscopicity of single-component water-insoluble organic compounds is affected by chemical aging as anticipated from previous studies (George et al., 2009; Lambe et al., 2011; Wong et al., 2011; Broekhuizen et al., 2004; Shilling et al., 2007; Petters et al., 2006), and (iii) if considering mixtures of water-soluble and insoluble materials, the effects of chemical aging by OH are more complicated, and single-component-derivedκand changes toκ as a function of OH exposure do not translate directly to mixtures.
particles, is toxic to forests (Harrison et al., 2005) and rec-ognized as an important biomass burning SOA molecular marker (Iinuma et al., 2010). An OH exposure equivalent to only a few days of atmospheric exposure leads to an or-der of magnitude enhancement in MNC hygroscopicity. This implies that aged MNC is more susceptible to wet deposi-tional losses over atmospherically relevant particle transport timescales, e.g., through cloud formation, compared to fresh MNC. Calculations from Petters et al. (2006) indicate that substantial wet depositional losses can occur whenκ >0.01. The question of the utility of MNC as a molecular marker for source apportionment is raised since molecular markers are assumed to be inert over the course of its lifetime in the atmo-sphere. Clearly, OH oxidation of MNC influences its chem-ical composition, but in doing so also decreases its atmo-spheric lifetime by enhancing its CCN activity. However, our results strongly suggest that if the OA is WSOC-dominated, e.g., by LEV, the reaction products likely have similar CCN activity to the parent WSOC, and thus particle oxidation plays a very minor role in enhancing the CCN activity of WSOC. Indeed, only a minor enhancement in the hygroscop-icity of BBA, produced from controlled wood burning, was observed after several hours of photo-oxidation, likely a re-sult of significant BBA WSOC content (Martin et al., 2013). Much less is known of the effects of chemical aging on the CCN activity of internally mixed water-soluble and insoluble organic–inorganic particles. While oxidative aging can en-hance the hygroscopicity of single-component particles with initially low water solubility, atmospheric aerosol particles are not often pure and consist of both organic and inorganic compounds (Laskin et al., 2012; Knopf et al., 2014; Mur-phy and Thomson, 1997; MurMur-phy et al., 2006; Middlebrook et al., 1998). Organic compounds alone can influence the hy-groscopicity of inorganic aerosol particles (Marcolli et al., 2004; Choi and Chan, 2002; Svenningsson et al., 2006; Wang et al., 2008) and moderate amounts of water-soluble inor-ganics can render low-solubility orinor-ganics infinitely water-soluble (Bilde and Svenningsson, 2004; Abbatt et al., 2005; Shantz et al., 2008; Petters and Kreidenweis, 2008). When mixed with LEV or KS (or both) in significant mass frac-tions, the effects of OH oxidative aging on the hygroscopicity of single-component MNC are not revealed in the derivedκ
for the binary- or ternary-component particles. Furthermore, a thick coating of MNC on KS particles had similar impacts on the CCN activity behavior with increasing OH exposure as the atomized binary-component MNC : KS particles. The water-soluble fraction (i.e., KS) was sufficiently large that MNC became infinitely soluble. Our results indicate that it is the fraction of the water-soluble component of internally mixed water-soluble and insoluble organic–inorganic parti-cles that dictates whether chemical aging will enhance the particles’ CCN activity. Chemical aging has no major impact on the CCN activity of the mixed water-soluble and sparingly soluble BBA compounds studied here, beyond the point that the less water-soluble component becomes infinitely soluble.
Below this point, chemical aging can influence the CCN ac-tivity of the mixed particle. However, we caution against ex-trapolating general atmospheric conclusions given the lim-ited number of compounds and mixtures studied here and suggest that similar work in the future also consider more complex, atmospherically relevant particle systems.
The Supplement related to this article is available online at doi:10.5194/acp-15-10183-2015-supplement.
Acknowledgements. J. H. Slade and D. A. Knopf acknowledge support from the National Science Foundation grants OCE-1336724 and AGS-0846255. J. Wang and R. Thalman acknowledge support from the US Department of Energy’s Atmospheric System Research Program (Office of Science, OBER) under contract DE-AC02098CH10886.
Edited by: D. Topping
References
Abbatt, J. P. D., Broekhuizen, K., and Kumal, P. P.: Cloud con-densation nucleus activity of internally mixed ammonium sul-fate/organic acid aerosol particles, Atmos. Environ., 39, 4767– 4778, doi:10.1016/j.atmosenv.2005.04.029, 2005.
Abbatt, J. P. D., Lee, A. K. Y., and Thornton, J. A.: Quantify-ing trace gas uptake to tropospheric aerosol: recent advances and remaining challenges, Chem. Soc. Rev., 41, 6555–6581, doi:10.1039/c2cs35052a, 2012.
Anbar, M., Meyerstein, D., and Neta, P.: The reactivity of aromatic compounds toward hydroxyl radicals, J. Phys. Chem., 70, 2660– 2662, doi:10.1021/j100880a034, 1966.
Andreae, M. O. and Rosenfeld, D.: Aerosol–cloud–
precipitation interactions. Part 1. The nature and sources
of cloud-active aerosols, Earth-Sci. Rev., 89, 13–41,
doi:10.1016/j.earscirev.2008.03.001, 2008.
Andreae, M. O., Rosenfeld, D., Artaxo, P., Costa, A. A., Frank, G. P., Longo, K. M., and Silva-Dias, M. A. F.: Smok-ing rain clouds over the Amazon, Science, 303, 1337–1342, doi:10.1126/science.1092779, 2004.
Arangio, A., Slade, J. H., Berkemeier, T., Pöschl, U., Knopf, D. A., and Shiraiwa, M.: Multiphase chemical kinetics of OH rad-ical uptake by molecular organic markers of biomass burning aerosols: humidity and temperature dependence, surface reac-tion and bulk diffusion, J. Phys. Chem. A., 119, 4533–4544, doi:10.1021/jp510489z, 2015.
Bai, J., Sun, X., Zhang, C., Xu, Y., and Qi, C.: The OH-initiated atmospheric reaction mechanism and kinetics for levoglucosan emitted in biomass burning, Chemosphere, 93, 2004–2010, doi:10.1016/j.chemosphere.2013.07.021, 2013.
Bilde, M. and Svenningsson, B.: CCN activation of slightly solu-ble organics: the importance of small amounts of inorganic salt and particle phase, Tellus B, 56, 128–134, doi:10.1111/j.1600-0889.2004.00090.x, 2004.
Bond, T., Streets, D., Yarber, K., Nelson, S., Woo, J.-H., and Klimont, Z.: A technology-based global inventory of black and organic carbom emissions from combustion, J. Geophys. Res., 109, D14203, doi:10.1029/2003JD003697, 2004.
Broekhuizen, K. E., Thornberry, T., Kumar, P. P., and Ab-batt, J. P. D.: Formation of cloud condensation nuclei by oxida-tive processing: unsaturated fatty acids, J. Geophys. Res., 109, S524–S537, doi:10.1029/2004JD005298, 2004.
Brooks, S. D., Suter, K., and Olivarez, L.: Effects of chemical ag-ing on the ice nucleation activity of soot and polycyclic aromatic hydrocarbon aerosols, J. Phys. Chem. A., 118, 10036–10047, doi:10.1021/jp508809y, 2014.
Carrico, C. M., Petters, M. D., Kreidenweis, S. M., Sullivan, A. P., McMeeking, G. R., Levin, E. J. T., Engling, G., Malm, W. C., and Collett Jr., J. L.: Water uptake and chemical composition of fresh aerosols generated in open burning of biomass, Atmos. Chem. Phys., 10, 5165–5178, doi:10.5194/acp-10-5165-2010, 2010. Chan, M. N., Choi, M. Y., Ng, N. L., and Chan, C. K.:
Hygroscopic-ity of water-soluble organic compounds in atmospheric aerosols: amino acids and biomass burning derived organic species, Envi-ron. Sci. Technol., 39, 1555–1562, doi:10.1021/es049584l, 2005. Chen, L., Moosmuller, H., Arnott, W., Chow, J., Watson, J., Su-sott, R., Babbitt, R., Wold, C., Lincoln, E., Hao, W., Moos-muller, H., Arnott, W. P., Chow, J. C., Watson, J. G., Susott, R. A., Babbitt, R. E., Wold, C. E., Lincoln, E. N., and Hao, W. M.: Emissions from laboratory combustion of wildland fuels: emis-sion factors and source profiles, Environ. Sci. Technol., 41, 4317–4325, doi:10.1021/es062364i, 2007.
Choi, M. Y. and Chan, C. K.: The effects of organic species on the hygroscopic behaviors of inorganic aerosols, Environ. Sci. Tech-nol., 36, 2422–2428, doi:10.1021/es0113293, 2002.
Claeys, M., Vermeylen, R., Yasmeen, F., Gómez-Gonzáles, Y., Chi, X., Maenhaut, W., Mészáros, T., and Salma, I.: Chemi-cal characterisation of humic-like substances from urban, rural and tropical biomass burning environments using liquid chro-matography with UV/vis photodiode array detection and electro-spray ionisation mass spectrometry, Environ. Chem., 9, 273–284, doi:10.1071/EN11163, 2012.
Collins, D. R., Flagan, R. C., and Seinfeld, J. H.: Improved in-version of scanning DMA data, Aerosol Sci. Tech., 36, 1–9, doi:10.1080/027868202753339032, 2002.
Cosman, L. M., Knopf, D. A., and Bertram, A. K.: N2O5
re-active uptake on aqueous sulfuric acid solutions coated with branched and straight-chain insoluble organic surfactants, J. Phys. Chem. A., 112, 2386–2396, doi:10.1021/jp710685r, 2008. Cruz, C. N. and Pandis, S. N.: The effect of organic coatings on the cloud condensation nuclei activation of inorganic atmo-spheric aerosol, J. Geophys. Res.-Atmos., 103, 13111–13123, doi:10.1029/98JD00979, 1998.
Decesari, S., Facchini, M. C., Matta, E., Mircea, M., Fuzzi, S., Chughtai, A. R., and Smith, D. M.: Water soluble organic com-pounds formed by oxidation of soot, Atmos. Environ., 36, 1827– 1832, doi:10.1016/S1352-2310(02)00141-3, 2002.
Di Paola, A., Augugliaro, V., Palmisano, L., Pantaleo, G., and Savi-nov, E.: Heterogeneous photocatalytic degradation of
nitrophe-nols, J. Photoch. Photobio. A, 155, 207–214, doi:10.1016/S1010-6030(02)00390-8, 2003.
Dusek, U., Covert, D. S., Wiedensohler, A., Neususs, C., Weise, D., and Cantrell, W.: Cloud condensation nuclei spectra derived from size distributions and hygroscopic properties of the aerosol in coastal south-west Portugal during ACE-2, Tellus B, 55, 35–53, doi:10.1034/j.1600-0889.2003.00041.x, 2003.
Dusek, U., Frank, G. P., Hildebrandt, L., Curtius, J., Schneider, J., Walter, S., Chand, D., Drewnick, F., Hings, S., Jung, D., Bor-rmann, S., and Andreae, M. O.: Size matters more than chem-istry for cloud-nucleating ability of aerosol particles, Science, 312, 1375–1378, doi:10.1126/science.1125261, 2006.
Dusek, U., Frank, G. P., Massling, A., Zeromskiene, K., Iinuma, Y., Schmid, O., Helas, G., Hennig, T., Wiedensohler, A., and An-dreae, M. O.: Water uptake by biomass burning aerosol at sub-and supersaturated conditions: closure studies sub-and implications for the role of organics, Atmos. Chem. Phys., 11, 9519–9532, doi:10.5194/acp-11-9519-2011, 2011.
Ellison, G. B., Tuck, A. F., and Vaida, V.: Atmospheric process-ing of organic aerosols, J. Geophys. Res.-Atmos., 104, 11633– 11641, doi:10.1029/1999JD900073, 1999.
EPI (Estimation Program Interface): US EPA. Estimation Programs Interface Suite™for Microsoft®, v 4.11. United States Environ-mental Protection Agency, Washington, DC, USA, 2015. Ervens, B., Feingold, G., and Kreidenweis, S. M.:
Influ-ence of water-soluble organic carbon on cloud drop num-ber concentration, J. Geophys. Res.-Atmos., 110, D18211, doi:10.1029/2004JD005634, 2005.
Friedman, B., Kulkarni, G., Beránek, J., Zelenyuk, A., Thorn-ton, J. A., and Cziczo, D. J.: Ice nucleation and droplet formation by bare and coated soot particles, J. Geophys. Res., 116, D17203, doi:10.1029/2011JD015999, 2011.
Fuchs, N. A. and Sutugin, A. G.: Highly Dispersed Aerosols, 2nd edn., Ann Arbor Sci., Ann Arbor, MI, USA, 1970.
Garland, R. M., Wise, M. E., Beaver, M. R., DeWitt, H. L., Aiken, A. C., Jimenez, J. L., and Tolbert, M. A.: Impact of palmitic acid coating on the water uptake and loss of ammonium sulfate par-ticles, Atmos. Chem. Phys., 5, 1951–1961, doi:10.5194/acp-5-1951-2005, 2005.
Gasparini, R., Li, R. J., Collins, D. R., Ferrare, R. A., and Brack-ett, V. G.: Application of aerosol hygroscopicity measured at the Atmospheric Radiation Measurement Program’s Southern Great Plains site to examine composition and evolution, J. Geophys. Res.-Atmos., 111, D05S12, doi:10.1029/2004JD005448, 2006. George, I. and Abbatt, J.: Heterogeneous oxidation of atmospheric
aerosol particles by gas-phase radicals, Nat. Chem., 2, 713–722, doi:10.1038/nchem.806, 2010.
George, I. J., Chang, R. Y.-W., Danov, V., Vlasenko, A., and Abbatt, J. P. D.: Modification of cloud condensation nucleus activity of organic aerosols by hydroxyl radical heterogeneous oxidation, Atmos. Environ., 43, 5038–5045, doi:10.1016/j.atmosenv.2009.06.043, 2009.
Gierlus, K. M., Laskina, O., Abernathy, T. L., and Grassian, V. H.: Laboratory study of the effect of oxalic acid on the cloud conden-sation nuclei activity of mineral dust aerosol, Atmos. Environ., 46, 125–130, doi:10.1016/j.atmosenv.2011.10.027, 2012. Giordano, M., Espinoza, C., and Asa-Awuku, A.: Experimentally