www.atmos-chem-phys.net/13/6263/2013/ doi:10.5194/acp-13-6263-2013
© Author(s) 2013. CC Attribution 3.0 License.
Atmospheric
Chemistry
and Physics
Geoscientiic
Geoscientiic
Geoscientiic
Geoscientiic
Atmospheric test of the J
(
BrONO
2
)/k
BrO
+
NO
2ratio: implications for
total stratospheric Br
y
and bromine-mediated ozone loss
S. Kreycy1, C. Camy-Peyret2, M. P. Chipperfield3, M. Dorf1, W. Feng4, R. Hossaini3, L. Kritten5, B. Werner1, and K. Pfeilsticker1
1Institute of Environmental Physics, University of Heidelberg, Heidelberg, Germany
2Laboratoire de Physique Moléculaire pour l’Atmosphère et l’Astrophysique (LPMAA), Université Pierre et Marie Curie,
Paris, France
3Institute for Climate and Atmospheric Science, School of Earth and Environment, University of Leeds, Leeds, UK 4National Centre for Atmospheric Science, School of Earth and Environment, University of Leeds, Leeds, UK 5Institute for Space Sciences, Free University Berlin, Berlin, Germany
Correspondence to:K. Pfeilsticker ([email protected])
Received: 26 September 2012 – Published in Atmos. Chem. Phys. Discuss.: 23 October 2012 Revised: 30 April 2013 – Accepted: 2 June 2013 – Published: 2 July 2013
Abstract.We report on time-dependent O3, NO2 and BrO
profiles measured by limb observations of scattered skylight in the stratosphere over Kiruna (67.9◦N, 22.1◦E) on 7 and 8 September 2009 during the autumn circulation turn-over. The observations are complemented by simultaneous direct so-lar occultation measurements around sunset and sunrise per-formed aboard the same stratospheric balloon payload. Sup-porting radiative transfer and photochemical modelling indi-cate that the measurements can be used to constrain the ratio J(BrONO2)/ kBrO+NO2, for which atT =220±5 K an
over-all 1.7(+0.4−0.2)larger ratio is found than recommended by the most recent Jet Propulsion Laboratory (JPL) compila-tion (Sander et al., 2011). Sensitivity studies reveal the ma-jor reasons are likely to be (1) a larger BrONO2absorption
cross-sectionσBrONO2, primarily for wavelengths larger than
300 nm, and (2) a smallerkBrO+NO2 at 220 K than given by
Sander et al. (2011). Other factors, e.g. the actinic flux and quantum yield for the dissociation of BrONO2, can be ruled
out.
The observations also have consequences for total in-organic stratospheric bromine (Bry) estimated from
strato-spheric BrO measurements at high NOxloadings, since the
ratio J(BrONO2)/ kBrO+NO2 largely determines the
strato-spheric BrO/Bry ratio during daylight. Using the revised
J(BrONO2)/ kBrO+NO2 ratio, total stratospheric Bryis likely
to be 1.4 ppt smaller than previously estimated from BrO profile measurements at high NOx loadings. This would
bring estimates of Bryinferred from organic source gas
mea-surements (e.g. CH3Br, the halons, CH2Br2, CHBr3, etc.)
into closer agreement with estimates based on BrO obser-vations (inorganic method). The consequences for strato-spheric ozone due to the revised J(BrONO2)/ kBrO+NO2
ra-tio are small (maximum −0.8 %), since at high NOx (for
which most Bryassessments are made) the enhanced ozone
loss by overestimating Bry is compensated for by the
sup-pressed ozone loss due to the underestimation of BrO/Bry
with a smaller J(BrONO2)/ kBrO+NO2 ratio.
1 Introduction
The effect reactive bromine has on stratospheric ozone is largely dominated by the Reactions (1), (2a), and (2b) (Spencer and Rowland, 1977):
BrO+NO2+M−→BrONO2+M (R1)
BrONO2+h·ν−→BrO+NO2 (0.15) (R2a)
BrONO2+h·ν−→Br+NO3 (0.85). (R2b)
2 BrO+NO2
in the chlorine-activated polar ozone hole regions. Sander et al. (2011) report for the termolecular Reaction (1) a 1σ uncertainty factor of 1.47 (at 220 K) and for the BrONO2
absorption cross-section,σ (BrONO2)(Reactions 2a and 2b)
and hence for J(BrONO2)an overall uncertainty factor of at
least 1.4 (e.g. taken from Table 4.2 in JPL-2011). The former uncertainty factor mostly arises from the extrapolation of the laboratory measurements ofkBrO+NO2 from high to low
tem-peratures. The uncertainty ofσ (BrONO2)is due to its large
decrease by 3.5 orders of magnitude with wavelength, when going from the extreme UV (λ=200 nm) to λ >300 nm, where the actinic fluxes, and thus the spectral contribution to J(BrONO2), strongly increase.
BrONO2 can also be destroyed by the reaction (Soller
et al., 2002)
BrONO2+O(3P)−→BrO+NO3. (R3)
Nevertheless, Reaction (3) has a negligible effect on the life-time of BrONO2below about 25 km (Sinnhuber et al., 2005),
where the bulk of BrONO2resides during our measurements.
2 Methods
We report on spectroscopic measurements taken during a bal-loon flight of the LPMA/DOAS (Limb Profile Monitor of the Atmosphere/Differential Optical Absorption Spectroscopy) payload at Kiruna, Sweden (67.9◦N, 22.1◦E), on 7 and 8 September 2009. The payload accommodated three spec-trometers: (a) a near-IR (LPMA) spectrometer that is suit-able for the detection of O3, NO2, CH4, N2O, HNO3, and
other trace-gases (e.g. Camy-Peyret et al., 1995; Payan et al., 1998); (b) a UV/vis spectrometer for the high-precision de-tection of O3, NO2, BrO, IO, O4, etc. in direct sunlight (e.g.
Harder et al., 1998; Ferlemann et al., 2000); and (c) a UV/vis mini-DOAS instrument primarily for the detection of O3,
NO2, and BrO in limb-scattered skylight (e.g. Weidner et al.,
2005; Kritten et al., 2010).
While spectrometers (a) and (b) measured direct sunlight during balloon ascent, solar occultation at sunset and sun-rise, the mini-DOAS instrument recorded the atmosphere in limb geometry, with the azimuth angle being clockwise per-pendicular (α=90◦) to the sun’s azimuth direction. Viewing elevation angles were held constant (+0.05◦) during balloon ascent but subsequently changed from+0.6◦to−4.88◦
el-evation angle in steps of 0.39◦for the limb observations at
balloon float altitude.
The balloon was launched at 14:50 UT at a solar zenith angle (SZA) of 75◦ on 7 September 2009, and balloon float altitude (≈33.5 km) was reached around 16:45 UT (SZA=86◦). Please note that here and in the following all SZAs refer to local SZA (i.e. for the balloon gon-dola position). On 7 September 2009 the solar occultation and limb observations during sunset lasted until 18:15 UT (SZA=94◦), and were resumed at 02:30 UT during sunrise
on 8 September 2009 (SZA=94◦). However, the scanning
motor of the limb observation spectrometer malfunctioned, and only spectra recorded after 03:50 UT (SZA=86◦) are
used for analysis. They lasted until 06:00 UT (SZA=75◦), when the payload was separated from the balloon. Due to the low stratospheric winds at high latitudes during sum-mer/winter circulation turn-over, the balloon payload gently drifted from Kiruna to the Finnish–Russian border (at around 350 km distance) within the 16 h long flight. Accordingly, due to the low shear winds the azimuth stabilisation of the balloon gondola, and therefore the sun and limb pointing, was extremely stable as compared to previous balloon flights (e.g. see Table 1 in Dorf et al., 2006a; Kritten et al., 2010). Further, the ambient temperature (T =220 K) did not change by more than±5 K within the altitude range from 11.5 to 31 km.
Here we primarily report on the DOAS data obtained from the limb observations during sunset and sunrise and data recorded during sunset using the direct sunlight spectrom-eter.
For both instruments the spectral retrieval is based on the DOAS method (Platt and Stutz, 2008). Since in previous studies the spectral retrieval has been described at length (e.g. Weidner et al., 2005; Dorf et al., 2006a; Butz et al., 2006; Kritten et al., 2010), here only those details are described which depart from our previous work. The retrieval of O3,
NO2, and BrO from the solar occultation and the mini-DOAS
measurements is performed along the parameters as given in Butz et al. (2006) and Aliwell et al. (2002), with updates as recently described in Dorf et al. (2008) and Kritten et al. (2010). Also, since the errors and uncertainties of the DOAS retrievals have already been discussed in length in previous studies (e.g. Harder et al., 1998; Aliwell et al., 2002; Wei-dner et al., 2005; Dorf et al., 2006a; Butz et al., 2006), they are only referred to when necessary. The results of the DOAS analysis are differential slant column densities (dSCDs) with respect to a reference spectrum, typically recorded directly after reaching balloon float altitude at low SZA (see Fig. 1). These values are then corrected for the amount of the targeted trace gas in the reference spectrum resulting in absolute slant column densities (SCDs).
0 5 10 15 20 25 30
0 5 10 15 20
15:00 16:00 17:00 18:00
0 2 4 6
O3 dSCDs [10
19
molec/cm2]
NO2 dSCDs [10
16
molec/cm2]
D
if
fe
re
n
ti
a
l
S
la
n
t
C
o
lu
m
n
D
e
n
s
it
ie
s
BrO dSCDs [1014 molec/cm2]
Time [UT]
03:00 04:00 05:00 06:00
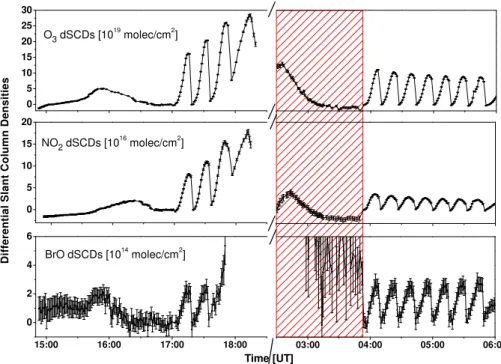
Fig. 1.Measured differential slant column densities of O3(upper panel), NO2(middle panel), and BrO (lower panel) in limb geometry during the balloon flight from Kiruna on 7 and 8 September 2009. During balloon ascent from 14:50 UT until 17:10 UT, the limb radiation was observed for an elevation angle of 0.05◦. During dusk (17:10 to 18:30 UT), 3.5 limb scans were performed at 33 km altitude. During early dawn, the scanning telescope of the limb spectrometer malfunctioned (the reddish area), and the limb scans (in total 7.25) started at 03:50 UT and continued until 06:00 UT, when the balloon was floating at 31 km altitude. Each limb scan consists of limb observations from
+0.6◦elevation angle down to−4.88◦in steps of 0.39◦.
angle+0.6◦) of each limb sequence. It is noteworthy that the
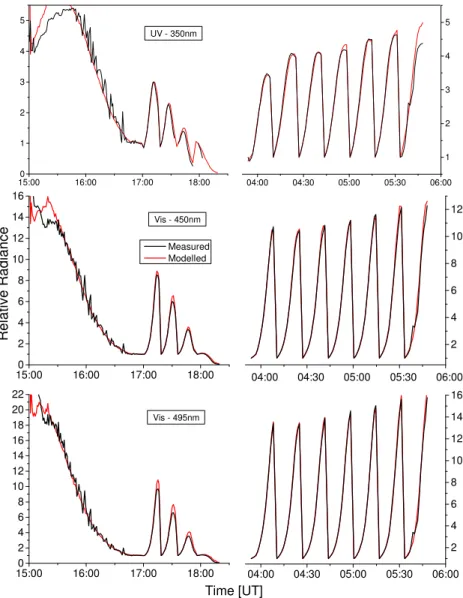
radiometric calibration does not change between the individ-ual limb sequences, except for very high SZAs>93◦, when spectrometer stray light becomes important. This finding is in agreement with the small mismatch between measured and modelled limb radiances also found by Deutschmann et al. (2011) (see Figures 5 and 6 therein). Figure 2 indicates how well the modelled and measured relative radiances are reproduced for the limb observations at λ=350, 450, and 495 nm, where BrO, NO2and O3are evaluated, respectively.
The good agreement indicates that both the relevant obser-vation parameters (e.g. balloon altitude, SZA, eleobser-vation and azimuth angles, FOV) and the atmospheric parameters (T,p, aerosol concentration, and their optical properties, as well as the low level cloud cover (about 2/8)) are well represented in the RT model.
For the interpretation of the direct sun observations, our group’s ray-tracing model (DAMF) is used that was exten-sively tested in the profile retrievals of past balloon flights (e.g. Harder et al., 2000, see Figure 1 therein).
For the photochemical modelling, the output from the most recent simulations of the 3-D CTM SLIMCAT (Chip-perfield, 1999) at Kiruna for 6 September 2009 is used to initialise our 1-D facsimile code Labmos (e.g. Bösch et al., 2003). This approach is necessary here since the output from a global SLIMCAT run is only available every 48 h. This
time resolution is too coarse to be used for comparisons with measurements. On the other hand using a 1-D pho-tochemical model for the model versus measurement inter-comparison appears justified, since during the balloon flight stratospheric winds were low, and thus very likely the same air masses were probed throughout our observations. How-ever, both photochemical models use the most recent version of the Jet Propulsion Laboratory (JPL) kinetics and thermo-chemical data for all relevant gas-phase and heterogeneous reactions (Sander et al., 2011). Finally, the Labmos simula-tions are constrained to the measured N2O and CH4 from
spectrometer (a) to correct for small mismatches in the pro-files of the source gases due to a small bias in the diabatic heating rate of SLIMCAT. Total stratospheric bromine (Bry)
is set to 20.3 ppt, and the Brymixing ratio profile is
accord-ingly vertically shifted (about 2 km) until the modelled and measured N2O and CH4profiles match. For this flight [Bry]
was(20.3±2.5)ppt (presumably in 5 yr-old air), which is de-termined from the direct sun measurements at balloon float using the so-called Langley method (e.g. Dorf et al., 2006b, 2008). Also note that, for the assessment of Bryusing
Lan-gley’s method, stratospheric BrO is probed above balloon float, where the BrO/Bry partitioning is mostly due to Br
atoms and BrO, and thus is insensitive to J(BrONO2)and/or
2 BrO+NO2
15:000 16:00 17:00 18:00 2
4 6 8 10 12 14 16
15:000 16:00 17:00 18:00 2
4 6 8 10 12 14 16 18 20 22
15:000 16:00 17:00 18:00
1 2 3 4 5
R
e
la
ti
v
e
R
a
d
ia
n
c
e
Measured Modelled
04:00 04:30 05:00 05:30 06:00 2 4 6 8 10 12
Time [UT]
04:00 04:30 05:00 05:30 06:00 2 4 6 8 10 12 14 16
04:00 04:30 05:00 05:30 06:00
1 2 3 4 5
Vis - 495nm Vis - 450nm UV - 350nm
Fig. 2.Inter-comparison of measured (black) and modelled (red) relative radiances atλ=350, 450, and 495 nm for the limb scans as described in the legend of Fig. 1. The RT simulations are normalised for the balloon ascent to the observations at 17:00 UT, and for each limb scan to the observation for the largest elevation angle (0.6◦), i.e. for the lowest radiances.
NO2obtained from the direct sun observations of
spectrom-eter (b) (see Fig. 4).
As an example of the simulations, Fig. 3 shows the simu-lated 2-D fields of BrO, BrONO2, and HOBr over Kiruna for
7 and 8 September 2009. Here, the simulation indicates that balloon soundings are well suited to study the Reactions (1), (2a), and (2b) at northern high latitudes during the summer to winter circulation turn-over, mostly because NOx
concentra-tions are large and the profiles of both targeted gases (NO2,
and BrO) nicely overlap as well, thus providing a good sen-sitivity for Reaction (1) during sunset.
At early dawn, unlike at dusk the Brypartitioning (the
pe-riod of the red dashed lines in Fig. 3), is largely given by the efficiency of the heterogenous reaction of
BrONO2+H2O|aqueous−→HOBr+HNO3 (R4)
at night. This is mostly because (a) Reaction (4) is much slower than Reaction (1) in the volcanically quiet strato-sphere, and (b) the photolysis of HOBr is similarly rapid as for BrONO2 (Erle et al., 1999) (see also Fig. 3).
There-fore, HOBr does not interfere with our measurements, except for the solar occultation measurements during early sunrise, which are not considered any further here. They will be dis-cussed in a separate study addressing the stratospheric HOBr photochemistry.
In order to support an inter-comparison of measured and modelled SCDs of O3, NO2 and BrO, the simulated
Fig. 3.Standard simulation of the key stratospheric bromine species for 7 September 2009 using the Labmos photochemical model: diurnal variation of BrO (upper panel), BrONO2(middle panel), and HOBr (lower panel). The red lines indicate the periods of the limb measure-ments (local SZA at the balloon gondola=86–75◦at a.m. and 85–95◦at p.m.) and the dashed red lines the period of the direct sunlight measurements (local SZA=95–90◦at a.m., and SZA=90–95◦at p.m.). Solar zenith angles shown in the middle panel refer to the SZA at the balloon location, and the colour coding indicates the respective concentrations in units of 107molec cm−3.
3 Results
Figure 4 displays the inter-comparison of the measured and modelled limb SCDs of O3, NO2and BrO. While for O3and
NO2the agreement is naturally close to perfect for all
eleva-tion angles due to the scaling of the profiles, measured limb BrO is in general larger than obtained from the simulations for the standard run (i.e.[Bry] =20.3 ppt,σ (BrONO2)and
kBrO+NO2 from JPL-2011). This is in particular true for the
large BrO SCDs, which are obtained for large negative eleva-tion angles (tangent heights down to 14 km), where the bulk of BrO and BrONO2resides. In short, our observations
in-dicate that during dusk BrO tends to react later (or at larger SZAs) into its major night-time reservoir gas BrONO2, while
at dawn (SZA<86◦) limb BrO tends to appear more rapidly
than the standard simulation suggests.
A similar finding is obtained from the solar occultation measurements during sunset (see Fig. 5, upper panel) using the direct sun instrument (b) (Ferlemann et al., 2000) even though they are less sensitive to Reactions (2a) and (2b). This is mostly since the tangent height is by definition at SZA=90◦where most of the absorption signal comes from. Hence, our solar occultation observations mostly probe the atmosphere for a more-or-less constant J(BrONO2), but at
the same time the effectively probed air masses (i.e. tangent points) move more and more away from the payload (up to 1200 km), towards the northwest during sunset.
Noteworthy in the comparison of measured and mod-elled BrO SCDs is the kink observed in the measurements for SZAs>92.5◦, or tangent heights lower than 25.5 km. It is suspected that this kink is due to a dynamically dif-ferent lowermost stratosphere close to and distant to the balloon sounding, rather than due to deficits in modelling the photochemistry of BrO. Two pieces of evidence sup-port this hypothesis. First, a similar kink for the same SZA occurs in the measured O3 SCDs (see Fig. 5, lower
panel), which requires the inferred profiles of O3 close to
and distant to the sounding to be distinctly different for tangent heights lower than 25.5 km (see the insets in the lower panel of Fig. 5). Accordingly, since in the lower-most stratosphere at high latitudes the profile shape of O3is
mostly due to dynamical processes (i.e. quasi-isentropic ex-change of air masses with mid-latitudes, or the height of the tropopause), it is also suspected that the profile shape of Bry
2 BrO+NO2
0.0 0.5 1.0 1.5 2.0
0.0 0.5 1.0 1.5 2.0
O3 SCDs [1020
molec/cm2
]
0.0 0.5 1.0 1.5 2.0 2.5 0.0
0.5 1.0 1.5 2.0 2.5
sunset sunrise
NO
2 SCDs [10 17
molec/cm2
]
0 1 2 3 4
0 1 2 3 4
Modelled
M
e
a
s
u
re
d
BrO SCDs [1014
molec/cm2
]
Fig. 4.Inter-comparison of limb measured versus modelled slant column concentrations of O3 (upper panel), NO2(middle panel)
and BrO (lower panel) for the standard JPL-2011 kinetics in units as given in the panels. Due to the scaling the slant column densities of O3and NO2excellently agree, but only fair agreement is obtained for BrO with standard model parameters. In the lower panel the JPL-2011 uncertainty of the J(BrONO2)/ kBrO+NO2 ratio is indicated
(dashed lines).
indicates a negligible PV gradient at the upper level (950 K), and a small west/east PV gradient at the lower levels (at 475 K and 550 K), again indicative of different origins of the air masses close to and distant to the balloon sounding. Therefore, it is rather likely that the kink of the measured BrO SCD at around SZA=92.5◦is not due to photochem-istry, but due to transport. Therefore, the solar occultation
measurements during dusk for SZAs>92.5◦are disregarded
for the following discussion.
Accordingly, the findings inferred from the comparisons of the limb and solar occultation measurements with the photo-chemical modelling can be taken as evidence that either the ratio J(BrONO2)/ kBrO+NO2 is larger than indicated by the
JPL-2011 compilations, or that Bryis incorrectly assumed in
the model. These possibilities are investigated in the follow-ing section.
4 Discussion
In order to investigate potential causes for the deviation of the measured versus modelled BrO SCDs, a sensitivity test for the magnitude of the parameters J(BrONO2),kBrO+NO2,
and Bry is performed for limb and solar occultation
mea-surements (Figs. 6 and 7). In both cases the best agree-ment between measureagree-ments and simulations is found by in-creasing J(BrONO2)and decreasing kBrO+NO2, when
forc-ing the regression line of measured versus modelled BrO SCDs through 0. Figure 8 illustrates the situation when varying J(BrONO2)andkBrO+NO2 for both the limb (dusk
and dawn) and the solar occultation measurements (dusk), whereby the colour coding denotes the slope of the regres-sion of measured versus modelled BrO SCDs. The figure in-dicates that for the limb measurement the best combination of J(BrONO2), and kBrO+NO2 is obtained when increasing
J(BrONO2)to a range of 1.1 to 1.4 and decreasingkBrO+NO2
to a range of 0.65 to 0.80. RT calculations show that the limb samples are taken 30–70 km on the right-hand side of the payload, while the probed air masses of the solar occul-tation measurements move further and further away (up to 1200 km) as the sun sets.
The best agreement for the limb observations is found for a ratio J(BrONO2)/ kBrO+NO2|obs=1.7(+0.4−0.2)× J (BrONO2)/ kBrO+NO2|JPL, for both the sunset and sunrise
measurements.
For the solar occultation observations, the comparison be-tween measured and modelled SCDs fully supports this con-clusion, however, only for SZA<92.5◦. For the solar occul-tation observations, the best agreement is obtained for a ra-tio of J(BrONO2)/ kBrO+NO2|obs=1.7(+0.2−0.1). Here the
uncertainties are smaller compared to the limb observations, when varying the J(BrONO2)/ kBrO+NO2 ratio within the
er-rors of the slope due to the higher accuracy of calculating the RT. However, since the direct sunlight observations are less sensitive to Reactions (2a) and (2b), these results are only used to confirm the results of the limb observations.
Sensitivity runs for [Bry] within the given uncertainty
range (corresponding to ±2.5 ppt of Bry) are also
17:20 17:30 17:40 17:50 18:00 18:10 18:20 1
2 3 4 5 6
17:20 17:30 17:40 17:50 18:00 18:10 18:20
0 5 10 15 20 25 30 35
Measurement
Simulations k=1.00 J=1.0
k=1.00 J=1.2 k=0.90 J=1.2 k=0.65 J=1.1 k=0.70 J=1.2 k=0.75 J=1.3 k=0.85 J=1.4 k=0.70 J=1.3
B
rO
S
C
D
s
[
1
0
1
4 m
o
le
c
/c
m
2 ]
90°
91°
92.5°
94°
O3
S
C
D
s
[1
0
2
0 m
o
le
c
/c
m
2 ]
Time [UT]
Measurement O3 profile 1 O3 profile 2
92.5° 10
15 20 25 30 35
10 15 20 25 30 35 40 45
O3 concentration [1011
molec/cm3
]
A
lt
it
u
d
e
[
k
m
]
Fig. 5.Inter-comparison of measured versus modelled slant column densities of BrO (upper panel) and O3(lower panel) for the sunset solar
occultation measurements on 7 September 2009. The data points shown with filled black dots are included, while the data points with open dots are disregarded in the analysis. The coloured lines in the upper panel show simulations for different pairs of J(BrONO2)andkBrO+NO2
as indicated by the legend. Local solar zenith angles (e.g. 90◦, 91◦, 92.5◦, and 94◦) of some measurements are also indicated. The lower panel shows the measured O3SCDs in solar occultation, and the lines in red and light blue show the modelled O3SCDs for the two ozone
profiles shown in the inset, respectively. The ozone profile (red line) is inferred from direct sunlight measurements in the visible spectral range during the balloon ascent (i.e. close to balloon sounding) and the ozone profile in light blue is a tuned profile to fit best the O3SCDs
for SZA>92.5◦.
obtain a 1:1 agreement between the modelled and measured BrO SCDs (Figs. 6 and 7).
Next, we address potential causes for the uncertainty in the J(BrONO2)/ kBrO+NO2ratio. Incorrectly modelled actinic
fluxes by the required amount are rather unlikely, since our RT model nicely explains the measured limb radiances at different wavelengths, different elevation angles and SZAs
2 BrO+NO2
0.0 0.5 1.0 1.5 2.0 2.5 3.0 3.5 4.0
0.0 0.5 1.0 1.5 2.0 2.5 3.0 3.5 4.0
0.0 0.5 1.0 1.5 2.0 2.5 3.0 3.5 4.0
0.0 0.5 1.0 1.5 2.0 2.5 3.0 3.5 4.0
0.0 0.5 1.0 1.5 2.0 2.5 3.0 3.5 4.0
0.0 0.5 1.0 1.5 2.0 2.5 3.0 3.5 4.0
0.0 0.5 1.0 1.5 2.0 2.5 3.0 3.5 4.0
0.0 0.5 1.0 1.5 2.0 2.5 3.0 3.5 4.0
sunset sunrise
kmod/ kJPL = 0.80
Jmod/ JJPL = 1.4
s = (1.003 ± 0.041) kmod/ kJPL = 0.75
Jmod/ JJPL = 1.3
s = (0.990 ± 0.044)
M
e
a
s
u
re
d
B
rO
S
C
D
s
[
1
0
1
4 m
o
le
c
/c
m
2 ]
kmod/ kJPL = 0.70
Jmod/ JJPL = 1.2
s = (1.011 ± 0.040)
Modelled BrO SCDs [1014 molec/cm2]
kmod/ kJPL = 0.65
Jmod/ JJPL = 1.1
s = (0.996 ± 0.043)
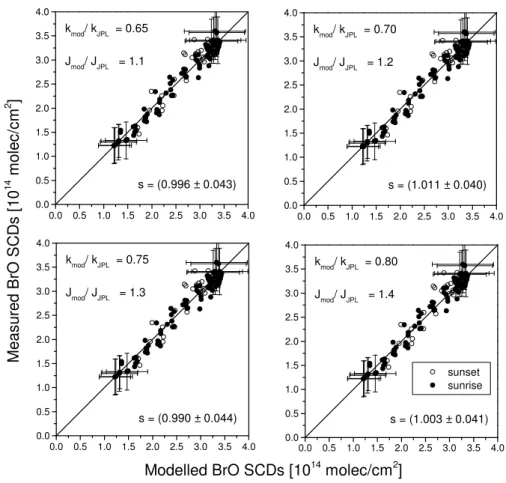
Fig. 6.Inter-comparison of limb measured versus modelled slant column densities of BrO for different scaling factors of J(BrONO2)and
kBrO+NO2as indicated in the individual panels. The open dots are for sunset and the full dots for sunrise observations. Thesvalue indicates the slope and its uncertainty between modelled and measured BrO SCDs.
to form BrO), an incorrect J(BrONO2) points to an
incor-rectσ (BrONO2). For J(BrONO2)JPL-2011 states an
over-all uncertainty factor of 1.4 (Table 4.2) most likely due to uncertainties of σ (BrONO2)in the UV-A and visible, and
its temperature dependence. Since atT =298 Kσ (BrONO2)
agrees fairly well among the different studies, one may spec-ulate whether the recommended temperature correction for T =220 K at which our measurements are made is in fact too strong. Furthermore, JPL-2011 states a 1σ uncertainty factor of 1.47 forkBrO+NO2 at 220 K. Here, the major
uncer-tainty arises from theT dependence of the high pressure limit of the reaction, which is found to be rather large (m=2.9). Attempts to fit the data with the JPL master equation were found to be insufficient at low pressures (Sander et al., 2011). Therefore, one may again speculate as to whetherkBrO+NO2
at 220 K is somewhat lower than recommended by JPL-2011. We note while our finding requires that J(BrONO2)is larger
andkBrO+NO2is lower than recommended by JPL-2011, such
that J(BrONO2)/ kBrO+NO2=1.7(+0.4−0.2), we cannot
indi-vidually assess the magnitude of each of the involved param-eters. However, it is likely that, with respect to the given error
bars for each parameter, both parameters need to be changed from recommended values at low temperatures.
The finding has also implications for total stratospheric bromine. Using the inorganic method to assess stratospheric Bry relies on a photochemical correction: Bry is
calcu-lated from measured BrO according to [Bry]=[BrO] ·(1+
kBrO+NO2·[NO2]·[M]/JBrONO2 . . .)where “. . .” indicates
con-tributions from minor bromine species in the stratosphere (e.g. HOBr, Br, BrCl, and HBr). In our case, taking the revised J(BrONO2)/ kBrO+NO2 ratio (i.e. 1.7(+0.4−0.2)),
stratospheric Brymay decrease by as much as 1.4 ppt. In fact,
a smaller Bry assessed using the inorganic method would
tend to close the existing gap to total stratospheric bromine assessed using measurements of organic source gases. Also the potential contribution of so-called very short-lived sub-stances (VSLSs) to stratospheric bromine would accordingly decrease. For example, while our assessment of Bry for 4.5
year old air probed over Brazil in 2005 indicated a VSLS contribution of [VSLS]inorg=(5.2±2.5)ppt (Dorf et al.,
2008), the organic method resulted in only [VSLS]org=
0 1 2 3 4 5 6
0 1 2 3 4 5 6
0 1 2 3 4 5 6
0 1 2 3 4 5 6
0 1 2 3 4 5 6
0 1 2 3 4 5 6
0 1 2 3 4 5 6
0 1 2 3 4 5 6
M
e
a
s
u
re
d
B
rO
S
C
D
s
[
1
0
1
4 m
o
le
c
/c
m
2 ]
s = (1.0163 ± 0.0023)
kmod/ kJPL = 0.65
Jmod/ JJPL = 1.1
s = (1.0152 ± 0.0023)
kmod/ kJPL = 0.70
Jmod/ JJPL = 1.2
Modelled BrO SCDs [1014 molec/cm2]
s = (1.0045 ± 0.0022)
kmod/ kJPL = 0.75
Jmod/ JJPL = 1.3
s = (1.0226 ± 0.0024)
kmod/ kJPL = 0.80
Jmod/ JJPL = 1.4
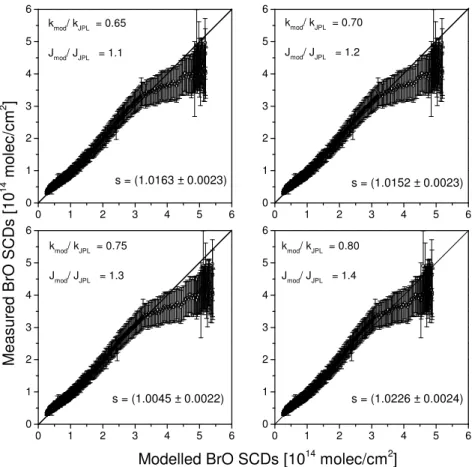
Fig. 7.Inter-comparison of solar occultation measured versus modelled slant column densities of BrO for different scaling factors of J(BrONO2)andkBrO+NO2as indicated in the individual panels. The closed dots are for SZA<92.5
◦and the open dots for SZA>92.5◦,
the latter being disregarded in the analysis (see text). Thesvalue indicates the slope and its uncertainty between modelled and measured BrO SCDs.
0.6 0.7 0.8 0.9 1.0 1.1 1.2 1.3 1.4 1.5
0.7 0.8 0.9 1.0 1.1 1.2 1.3 1.4 1.5
0.90
1.00 BA
0.95 1.05 1.10 1.15 1.20 1.25 1.30
Jmo
d
/
JJP
L
k
mod / kJPL
JPL(2011) range of uncertainty
S
lo
p
e
o
f
L
in
e
a
r
F
it
Fig. 8.Regression of J(BrONO2)versuskBrO+NO2for the limb and
solar occultation BrO measurements together with the uncertainty range for both parameters as indicated by the JPL-2011 compila-tion. The colour coding indicates the resulting slopes of the mod-elled versus measured BrO SCD regression of the limb and solar occultation observations, when forcing the regression line through zero. The best agreement (BA) is given for a slope of 1. The results shown in Figs. 6 and 7 are represented by the black dots.
our own BrO measurement using the Langley method) and about [VSLS]org=2.25 ppt (Brinckmann et al., 2012), for
the air masses jointly probed by both methods over Brazil in 2008.
The implications of our finding for stratospheric ozone loss are small or even negligible, since the ozone loss by the BrONO2 photolysis has a small contribution to the
to-tal ozone loss by bromine (dominated by the reaction BrO+
ClO), which is presently assessed to amount to about 30– 35 % on a global average (Sinnhuber et al., 2009). Further-more, even though BrONO2mostly photolyses into Br+NO3
(Reaction 2b), only about 12 % of the produced NO3
pho-tolyses into the channel NO+O2, which in fact may cause
some ozone loss (via reformation of BrO and NO2 and the
consumption of two ozone molecules). A possibly larger im-pact would be through the altered partitioning of bromine between BrO and its reservoir BrONO2, as BrO participates
in a number of ozone loss cycles.
2 BrO+NO2
(a)
(b)
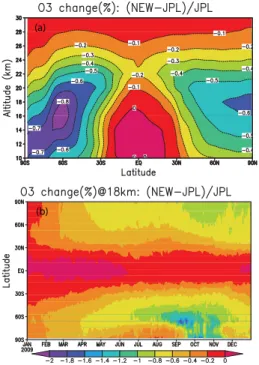
Fig. 9.Difference in ozone from a simulation of the SLIMCAT 3-D CTM with scaled J(BrONO2)(×1.27) andkBrO+NO2 (×0.75)
compared to a run with standard JPL kinetics.(a)Difference (%) in annually and zonally averaged ozone and(b)difference (%) in zonal mean ozone at 18 km as a function of time. Note the different colour scales in the two panels.
integrated for 14 months using ECMWF meteorology. The model run has a horizontal resolution of 2.8◦×2.8◦ and included a detailed stratospheric chemistry scheme (Chip-perfield, 1999). One model run is performed with standard JPL kinetics. In the other run J(BrONO2)is scaled by 1.27
and kBrO+NO2 is scaled by 0.75, thereby scaling the ratio
J(BrONO2)/ kBrO+NO2by 1.7. Figure 9 shows the percentage
ozone difference between these runs for 2009 as an annual and zonal mean and as a zonal mean at 18 km altitude. Over-all the impact of these kinetic changes on stratospheric ozone is small and confined to altitudes below about 30 km where BrONO2is a reservoir for bromine. The largest decrease in
ozone is around 0.8 % at the edge of the Antarctic ozone re-gion in September/October. The kinetics changes lead to less BrONO2(and HOBr) and more bromine in the form of BrO
which catalyses ozone loss. The small effect itself is more important at the edge of the polar vortex and late in the sea-son when NOyis more readily available to form BrONO2.
Smaller changes are seen in the Arctic and at mid-latitudes. In consequence, an increase in the photolysis rate and a de-crease in the formation rate of BrONO2as determined here
would eventually imply only a small change in the bromine-mediated ozone loss in the stratosphere.
5 Conclusions
We performed an atmospheric test of the J(BrONO2)/
kBrO+NO2 ratio assisted by photochemical and radiative
transfer modelling. It is found that, under stratospheric conditions (T =220±5 K and p≈65 mbar), the ratio J(BrONO2)/ kBrO+NO2 is 1.7(+0.4−0.2)larger than given
in the JPL-2011 compilation. Our sensitivity study indicates that very likely bothσ (BrONO2)andkBrO+NO2 differ from
the JPL-2011 recommendation.
The major consequences of our study are threefold. (1) Re-cent assessments of total stratospheric bromine using the in-organic method during high stratospheric NOxloadings may
have overestimated the necessary correction for the BrO to Bry ratio. As a consequence, stratospheric [Bry] should be
1.4 ppt lower, which amounts to 6.8 % of the total strato-spheric bromine. (2) A larger J(BrONO2)/ kBrO+NO2 ratio
may also cause a small increase (maximum−0.8 %) in the bromine-mediated ozone loss in the stratosphere, because ozone loss by BrONO2 and its products is anyhow small.
Also an overestimated stratospheric Bry due to an
incor-rect J(BrONO2)/ kBrO+NO2 ratio would be compensated in
the photochemical models, when reactive bromine is cal-culated using the inorganic method. (3) In the cold tro-posphere, a diminished formation of BrONO2 where high
NOx meets reactive bromine released from the degradation
of organic bromine compounds, or bromine being hetero-geneously released from salty aerosols or salt lakes, may lead to a longer lifetime of ozone-destroying BrO. In conse-quence, the revised J(BrONO2)/ kBrO+NO2 ratio may cause
more ozone destruction and a more efficient degradation of organic molecules by their reaction with Br atoms on the one hand. On the other hand, it may hinder the activation of re-active bromine tied to the aerosol or in bulk salt at low tem-peratures (e.g. von Glasow et al., 2004; Salawitch, 2006). Ac-cordingly, the consequences of our finding for ozone, and the oxidation capacity, in the troposphere may largely depend on the specific conditions.
Acknowledgements. This study was funded by the German
cooperation. Finally we are grateful for the hospitality and support given by the personnel of Esrange/Kiruna to successfully perform the balloon flight.
Edited by: W. T. Sturges
References
Aliwell, S., Van Roozendael, M., Johnston, P., Richter, A., Wagner, T., Arlander, D., Burrows, J., Fish, D., Jones, R., Tornkvist, K., Lambert, J.-C., Pfeisticker, K., and Pundt, I.: Anal-ysis for BrO in zenith-sky spectra: an intercomparison exer-cise for analysis improvement, J. Geophys. Res., 107, 4199, doi:10.1029/2001JD000329, 2002.
Bösch, H., Camy-Peyret, C., Chipperfield, M. P., Fitzenberger, R., Harder, H., Schiller, C., Schneider, M., Trautmann, T., and Pfeil-sticker, K.: Comparison of measured and modeled startospheric UV/visible actinic fluxes at large solar zenith angles, Geophys. Res. Lett., 28, 1179–1182, 2001.
Bösch, H., Camy-Peyret, C., Chipperfield, M. P., Fitzenberger, R., Harder, H., Platt, U., and Pfeilsticker, K.: Upper limits of strato-spheric IO and OIO inferred from center-to-limb-darkening-corrected balloon-borne solar occultation visible spectra: impli-cations for total gaseous iodine and stratospheric ozone, J. Geo-phys. Res., 108, 4455, doi:10.1029/2002JD003078, 2003. Brinckmann, S., Engel, A., Bönisch, H., Quack, B., and
At-las, E.: Short-lived brominated hydrocarbons – observations in the source regions and the tropical tropopause layer, Atmos. Chem. Phys., 12, 1213–1228, doi:10.5194/acp-12-1213-2012, 2012.
Butz, A., Bösch, H., Camy-Peyret, C., Chipperfield, M., Dorf, M., Dufour, G., Grunow, K., Jeseck, P., Kühl, S., Payan, S., Pepin, I., Pukite, J., Rozanov, A., von Savigny, C., Sioris, C., Wagner, T., Weidner, F., and Pfeilsticker, K.: Inter-comparison of strato-spheric O3and NO2abundances retrieved from balloon borne di-rect sun observations and Envisat/SCIAMACHY limb measure-ments, Atmos. Chem. Phys., 6, 1293–1314, doi:10.5194/acp-6-1293-2006, 2006.
Camy-Peyret, C., Jeseck, P., Payan, S., Hawat, T., Durry, G., and Flaud, J.-M.: Comparison of CH4 and N2O profiles at high and mid-latitudes using the LPMA balloon borne Fourier Trans-form instrument, in: Air Pollution Research Report, Polar Strato-spheric Ozone Symposium, Schliersee, 1995.
Chipperfield, M. P.: Multiannual simulations with a three-dimensional chemical transport model, J. Geophys. Res., 104, 1781–1805, 1999.
Chipperfield, M. P.: New version of the TOMCAT/SLIMCAT off-line chemical transport model: intercomparison of stratospheric tracer experiments, Q. J. Roy. Meteorol. Soc., 132, 1179–1203, 2006.
Deutschmann, T., Beirle, S., Frieß, U., Grzegorski, M., Kern, C., Kritten, L., Platt, U., Puk¸¯ıte, J., Wagner, T., Werner, B., and Pfeilsticker, K.: The Monte Carlo atmospheric radiative transfer model McArtim: introduction and validation of Jacobians and 3D features, J. Quant. Spectrosc. Ra., 112, 1119–1137, 2011. Dorf, M., Bösch, H., Butz, A., Camy-Peyret, C.,
Chipper-field, M. P., Engel, A., Goutail, F., Grunow, K., Hendrick, F., Hrechanyy, S., Naujokat, B., Pommereau, J. P., Van Roozen-dael, M., Sioris, C., Stroh, F., Weidner, F., and Pfeilsticker, K.:
Balloon-borne stratospheric BrO measurements: comparison with Envisat/SCIAMACHY BrO limb profiles, Atmos. Chem. Phys., 6, 2483–2501, doi:10.5194/acp-6-2483-2006, 2006a. Dorf, M., Butler, J., Butz, A., Camy-Peyret, C., Chipperfield, M.,
Kritten, L., Montzka, S., Simmes, B., Weidner, F., and Pfeil-sticker, K.: Long-term observations of stratospheric bromine re-veal slow down in growth, Geophys. Res. Lett, 33, L24803, doi:10.1029/2006GL027714, 2006b.
Dorf, M., Butz, A., Camy-Peyret, C., Chipperfield, M. P., Krit-ten, L., and Pfeilsticker, K.: Bromine in the tropical troposphere and stratosphere as derived from balloon-borne BrO observa-tions, Atmos. Chem. Phys., 8, 7265–7271, doi:10.5194/acp-8-7265-2008, 2008.
Erle, F., Grendel A., Perner D., Platt, U., and Pfeilsticker, K.: Evi-dence of heterogeneous bromine chemistry on cold stratospheric sulphate aerosols, Geophys. Res. Lett., 25, 23, 4329-4332, 1998. Feng, W., Chipperfield, M., Davies, S., von der Gathen, S., Kyro, E., Volk, C., Ulanovsky, A., and Belyaev, G.: Large chemical ozone loss in 2004/05 Arctic Winter/Spring, Geophys. Res. Lett., 34, L09803, doi:10.1029/2006GL029098, 2007.
Ferlemann, F., Bauer, N., Fitzenberger, R., Harder, H., Os-terkamp, H., Perner, D., Platt, U., Scheider, M., Vradelis, P., and Pfeilsticker, K.: Differential optical absorption spectroscopy in-strument for stratospheric balloon-borne trace gas studies, Appl. Opt., 39, 2377–2386, 2000.
Gurlit, W., Bösch, H., Bovensmann, H., Burrows, J. P., Butz, A., Camy-Peyret, C., Dorf, M., Gerilowski, K., Lindner, A., Noël, S., Platt, U., Weidner, F., and Pfeilsticker, K.: The UV-A and vis-ible solar irradiance spectrum: inter-comparison of absolutely calibrated, spectrally medium resolution solar irradiance spectra from balloon- and satellite-borne measurements, Atmos. Chem. Phys., 5, 1879–1890, doi:10.5194/acp-5-1879-2005, 2005. Harder, H., Camy-Peyret, C., Ferlemann, F., Fitzenberger, R.,
Hawat, T., Osterkamp, H., Schneider, M., Perner, D., Platt, U., Vradelis, P., and Pfeilsticker, K.: Stratospheric BrO profiles mea-sured at different latitudes and seasons: atmospheric observa-tions, Geophys. Res. Lett., 25, 3843–3846, 1998.
Harder, H., Bösch, H., Camy-Peyret, C., Chipperfield, M., Fitzen-berger, R., Payan, S., Perner, D., Platt, U., Sinnhuber, B.-M., and Pfeilsticker, K.: Comparison of measured and modeled Strato-spheric BrO: implications for the total amount of stratoStrato-spheric bromine, Geophys. Res. Lett., 27, 3695–3698, 2000.
Kritten, L., Butz, A., Dorf, M., Deutschmann, T., Kühl, S., Prados-Roman, C., Puk˛¯ıte, J., Rozanov, A., Schofield, R., and Pfeil-sticker, K.: Time dependent profile retrieval of UV/vis absorbing radicals from balloon-borne limb measurements – a case study on NO2and O3, Atmos. Meas. Tech., 3, 933–946,
doi:10.5194/amt-3-933-2010, 2010.
Laube, J. C., Engel, A., Bönisch, H., Möbius, T., Worton, D. R., Sturges, W. T., Grunow, K., and Schmidt, U.: Contribution of very short-lived organic substances to stratospheric chlorine and bromine in the tropics – a case study, Atmos. Chem. Phys., 8, 7325–7334, doi:10.5194/acp-8-7325-2008, 2008.
Payan, S., Camy-Peyret, C., Jeseck, P., Hawat, T., Durry, G., and Lefèvre, F.: First direct simultaneous HCl and ClONO2profile
measurements in the artic vortex, Geophys. Res. Lett., 25, 2663– 2666, 1998.
3-340-2 BrO+NO2
21193-4, Springer Verlag, Heidelberg, 2008.
Salawitch, R.: Atmospheric chemistry: biogenic bromine, Nature, 439, 275–277, 2006.
Sander, S., Friedl, R. R., Barkern, J., Golden, D., Kurylo, M., Wine, P., Abbat, J., Burkholder, J., Moortgart, C., Huie, R., and Orkin, R. E.: Chemical kinetics and photochemical data for use in atmospheric studies, Technical Report, NASA/JPL Publica-tion, 17, 2011.
Sinnhuber, B.-M., Rozanov, A., Sheode, N., Afe, O. T., Richter, A., Sinnhuber, M., Wittrock, F., Burrows, J. P., Stiller, G. P., von Clarmann, T., and Linden, A.: Global observations of strato-spheric bromine monoxide from SCIAMACHY, Geophys. Res. Lett., 32, 1–5, 2005.
Sinnhuber, B.-M., Sheode, N., Sinnhuber, M., Chipperfield, M. P., and Feng, W.: The contribution of anthropogenic bromine emis-sions to past stratospheric ozone trends: a modelling study, At-mos. Chem. Phys., 9, 2863–2871, doi:10.5194/acp-9-2863-2009, 2009.
Soller, R., Nicovich, J., and Wine, P.: Bromine nitrate photochem-istry: quantum yields for O, Br, and BrO over the wavelength range 248–355 nm, J. Phys. Chem. A, 106, 8378–8385, 2002. Spencer, J. E. and Rowland, F. S.: Bromine nitrate and its
strato-spheric significance, J. Phys. Chem., 82, 7–10, 1977.
von Glasow, R., von Kuhlmann, R., Lawrence, M. G., Platt, U., and Crutzen, P. J.: Impact of reactive bromine chemistry in the tropo-sphere, Atmos. Chem. Phys., 4, 2481–2497, doi:10.5194/acp-4-2481-2004, 2004.
Weidner, F., Bösch, H., Bovensmann, H., Burrows, J. P., Butz, A., Camy-Peyret, C., Dorf, M., Gerilowski, K., Gurlit, W., Platt, U., von Friedeburg, C., Wagner, T., and Pfeilsticker, K.: Balloon-borne limb profiling of UV/vis skylight radiances, O3, NO2,