ACPD
12, 27821–27845, 2012In-situ test of the J(BrONO2)/kBrO+NO2
ratio
S. Kreycy et al.
Title Page
Abstract Introduction
Conclusions References
Tables Figures
◭ ◮
◭ ◮
Back Close
Full Screen / Esc
Printer-friendly Version
Interactive Discussion
Discussion
P
a
per
|
Dis
cussion
P
a
per
|
Discussion
P
a
per
|
Discussio
n
P
a
per
|
Atmos. Chem. Phys. Discuss., 12, 27821–27845, 2012 www.atmos-chem-phys-discuss.net/12/27821/2012/ doi:10.5194/acpd-12-27821-2012
© Author(s) 2012. CC Attribution 3.0 License.
Atmospheric Chemistry and Physics Discussions
This discussion paper is/has been under review for the journal Atmospheric Chemistry and Physics (ACP). Please refer to the corresponding final paper in ACP if available.
Atmospheric test of the
J(BrONO
2
)
/k
BrO
+
NO
2ratio: implications for
total stratospheric Br
y
and
bromine-mediated ozone loss
S. Kreycy1, C. Camy-Peyret2, M. P. Chipperfield3, M. Dorf1, W. Feng4, R. Hossaini3, L. Kritten5, B. Werner1, and K. Pfeilsticker1
1
Institute of Environmental Physics, University of Heidelberg, Heidelberg, Germany
2
Laboratoire de Physique Moléculaire pour l’Atmosphère et l’Astrophysique (LPMAA), Université Pierre et Marie Curie, Paris, France
3
Institute for Climate and Atmospheric Science, School of Earth and Environment, University of Leeds, Leeds, UK
4
National Centre for Atmospheric Science, School of Earth and Environment, University of Leeds, Leeds, UK
5
Institute for Space Sciences, Free University Berlin, Berlin, Germany
Received: 26 September 2012 – Accepted: 8 October 2012 – Published: 23 October 2012
Correspondence to: S. Kreycy ([email protected])
ACPD
12, 27821–27845, 2012In-situ test of the J(BrONO2)/kBrO+NO2
ratio
S. Kreycy et al.
Title Page
Abstract Introduction
Conclusions References
Tables Figures
◭ ◮
◭ ◮
Back Close
Full Screen / Esc
Printer-friendly Version
Interactive Discussion
Discussion
P
a
per
|
Dis
cussion
P
a
per
|
Discussion
P
a
per
|
Discussio
n
P
a
per
|
Abstract
We report on time-dependent O3, NO2 and BrO profile measurements taken in the
stratosphere by limb observations of scattered skylight at high-latitudes during au-tumn circulation turn-over. The observations are complemented by simultaneous di-rect solar occultation measurements around sunset and sunrise performed aboard
5
the same stratospheric balloon payload. Supporting radiative transfer and photochem-ical modelling indicates that, the measurements can be used to constrain the ratio
J(BrONO2)/kBrO+NO2, for which overall a 1.69±0.04 larger ratio is found than indicated
by the most recent JPL compilation (Sander et al., 2011). Sensitivity studies reveal the
major reasons likely to be (1) a larger BrONO2 absorption cross-sectionσBrONO2,
pri-10
marily for wavelengths larger than 300 nm, and (2) a smallerkBrO+NO2 at 220 K than
given by Sander et al. (2011). Other factors, e.g. the actinic flux and quantum yield for
the dissociation of BrONO2, can be ruled out.
The observations also have consequences for total inorganic stratospheric bromine
(Bry) estimated from stratospheric BrO measurements at high NOxloadings, since the
15
J(BrONO2)/kBrO+NO2 ratio largely determines the stratospheric BrO/Bry ratio during
daylight. Using the revised J(BrONO2)/kBrO+NO2 ratio, total stratospheric Bry is likely
to be 1.4 ppt smaller than previously estimated from BrO profile measurements at high
NOx loadings. This brings estimates of total stratospheric bromine inferred from
or-ganic source gas measurements (i.e. CH3Br, the halons, CH2Br2, CHBr3, ...) into closer
20
agreement with estimates based on BrO observations (inorganic method). The
conse-quences for stratospheric ozone due to the revised J(BrONO2)/kBrO+NO2ratio are small
(maximum−0.8 %), since at high NOx(for which most Bry assessments are made) an
overestimated Bry using the inorganic method would in return almost cancel out with
the amount of reactive bromine calculated in the photochemical models.
ACPD
12, 27821–27845, 2012In-situ test of the J(BrONO2)/kBrO+NO2
ratio
S. Kreycy et al.
Title Page
Abstract Introduction
Conclusions References
Tables Figures
◭ ◮
◭ ◮
Back Close
Full Screen / Esc
Printer-friendly Version
Interactive Discussion
Discussion
P
a
per
|
Dis
cussion
P
a
per
|
Discussion
P
a
per
|
Discussio
n
P
a
per
|
1 Introduction
The effect reactive bromine has on stratospheric ozone is largely dominated by the
Reactions (1), (2a), and (2b) (Spencer and Rowland, 1977)
BrO+NO2+M−→BrONO2+M (1)
5
BrONO2+h·ν−→BrO+NO2 (0.15) (2a)
BrONO2+h·ν−→Br+NO
3 (0.85) (2b)
(the brackets give the recommended quantum yields Φ for λ >300 nm), since they
10
determine the amount of reactive bromine (BrO) and thus the bromine-mediated ozone loss in almost the whole global lower stratosphere in daytime, except in the chlorine-activated polar ozone hole regions. Sander et al. (2011) report for the termolecular
Reaction (1) a 1σuncertainty of 1.465 (at 220 K) and for the BrONO2absorption
cross-section,σ(BrONO2) (Eqs. 2a and 2b) and hence for J(BrONO2) an overall uncertainty
15
of about 1.4 (e.g. taken from Table 4.2 in JPL-2011). The former uncertainty mostly
arises from the extrapolation of the laboratory measurements ofkBrO+NO2 from high to
low temperatures. The uncertainty ofσ(BrONO2) though is due to its large decrease
by 3.5 orders of magnitude with wavelength, when going from the extreme UV (λ=
200 nm) to λ >300 nm, where the actinic fluxes, and thus the spectral contribution to
20
J(BrONO2) strongly increases.
BrONO2can also be destroyed by reaction (Soller et al., 2002)
BrONO2+O(3P)−→BrO+NO3 (3)
Nevertheless, Reaction (3) has a negligible effect on the lifetime of BrONO2 below
about 25 km (Sinnhuber et al., 2005), where the bulk of BrONO2 resides during our
25
ACPD
12, 27821–27845, 2012In-situ test of the J(BrONO2)/kBrO+NO2
ratio
S. Kreycy et al.
Title Page
Abstract Introduction
Conclusions References
Tables Figures
◭ ◮
◭ ◮
Back Close
Full Screen / Esc
Printer-friendly Version
Interactive Discussion
Discussion
P
a
per
|
Dis
cussion
P
a
per
|
Discussion
P
a
per
|
Discussio
n
P
a
per
|
2 Methods
We report on spectroscopic measurements taken during a balloon flight of the
LPMA/DOAS (Limb Profile Monitor of the Atmosphere/Differential Optical Absorption
Spectroscopy) payload at Kiruna, Sweden (67.9◦N, 22.1◦E) on 7 and 8 September
2009. The payload accommodated three spectrometers: (a) a near-IR (LPMA)
spec-5
trometer that is suitable for the detection of O3, NO2, CH4, N2O, HNO3, and other
trace-gases (e.g. Camy-Peyret et al., 1995; Payan et al., 1998), (b) a UV/vis
spectrom-eter for the high precision detection of O3, NO2, BrO, IO, O4, ... in direct sunlight (e.g.
Harder et al., 1998; Ferlemann et al., 2000), and (c) a UV/vis mini-DOAS instrument
primarily for the detection of O3, NO2, and BrO in limb scattered skylight (e.g. Weidner
10
et al., 2005; Kritten et al., 2010).
While spectrometers (a) and (b) measure in direct sun during balloon ascent, solar occultation at sunset and sunrise, the mini-DOAS instrument records the atmosphere
in limb geometry, with the azimuth angle being clock-wise perpendicular (α=90◦) to
the sun’s azimuth direction. Viewing elevation angles are held constant (+0.05o) during
15
balloon ascent and but subsequently changed from+0.6◦ to−4.88◦elevation angle in
steps of 0.39◦for the limb observations at balloon float altitude.
The balloon was launched at 14:50 UT and a solar zenith angle (SZA) of 75◦ on 7
September 2009 and balloon float altitude (≈33.5 km) was reached around 16:45 UT
(SZA=86◦). The solar occultation and limb observations during sunset on 7
Septem-20
ber 2009 lasted until 18:15 UT (SZA=94◦), and were resumed at 02:30 UT during
sunrise on 8 September 2009 (SZA=94◦). They lasted until 06:00 UT (SZA=75◦),
when the payload was separated from the balloon. Due to the low stratospheric winds at high-latitudes during summer/winter circulation turn-over, the balloon payload gently drifted from Kiruna to the Finish-Russian border (at around 350 km distance) within the
25
ACPD
12, 27821–27845, 2012In-situ test of the J(BrONO2)/kBrO+NO2
ratio
S. Kreycy et al.
Title Page
Abstract Introduction
Conclusions References
Tables Figures
◭ ◮
◭ ◮
Back Close
Full Screen / Esc
Printer-friendly Version
Interactive Discussion
Discussion
P
a
per
|
Dis
cussion
P
a
per
|
Discussion
P
a
per
|
Discussio
n
P
a
per
|
2010). Here we primarily report on the data obtained from the spectrometers (b), and (c) obtained during sunset and of spectrometer (c) during sunrise.
For both instruments the spectral retrieval is based on the DOAS method (Platt and Stutz, 2008). Since in previous studies, they have been described at length (e.g. Wei-dner et al., 2005; Dorf et al., 2006a; Butz et al., 2006; Kritten et al., 2010), here only
5
those details are described which depart from our previous work. The retrieval of O3,
NO2, and BrO from the solar occultation and the mini-DOAS measurements is
per-formed along the parameters as given in Butz et al. (2006) and Aliwell et al. (2002), with updates as recently described in Dorf et al. (2008), and Kritten et al. (2010). Also, the errors and uncertainties the DOAS retrievals have already been discussed in length
10
in previous studies (e.g. Harder et al., 1998; Aliwell et al., 2002; Weidner et al., 2005; Dorf et al., 2006a; Butz et al., 2006), they are only referred to when necessary.
The limb radiances are modelled using version 2.1 of the Monte Carlo radiative trans-fer (RT) model McArtim (Deutschmann et al., 2011). The model’s input is chosen ac-cording to measured atmospheric temperatures and pressures, including a
climato-15
logical high-latitude summer aerosol profile inferred from SAGE III (http://eosweb.larc. nasa.gov/PRODOCS/sage3/table_sage3.html) and confirmed with the direct sun mea-surement of spectrometer (b), the balloon altitude and the geolocation, SZAs as en-countered during each measurement, the azimuth and elevation angles, as well as the field of view (FOV) of the mini-DOAS telescopes. Since the mini-DOAS spectrometer
20
is not radio-metrically calibrated, all simulations are performed relative to the first limb
spectrum (elevation angle+0.6◦) of each limb sequence. It is noteworthy that the
radio-metric calibration does not change between the individual limb sequences, except for
very high SZAs≥93◦, when spectrometer straylight becomes important. This finding is
in agreement with the small mismatch between measured and modelled limb radiances
25
also found by Deutschmann et al. (2011) (see Figs. 5 and 6 therein). Figure 2 indicates how well the modelled and measured relative radiances are reproduced for the limb
observations atλ=350, 450, and 495 nm, where BrO, NO2and O3are evaluated. The
ACPD
12, 27821–27845, 2012In-situ test of the J(BrONO2)/kBrO+NO2
ratio
S. Kreycy et al.
Title Page
Abstract Introduction
Conclusions References
Tables Figures
◭ ◮
◭ ◮
Back Close
Full Screen / Esc
Printer-friendly Version
Interactive Discussion
Discussion
P
a
per
|
Dis
cussion
P
a
per
|
Discussion
P
a
per
|
Discussio
n
P
a
per
|
altitude, SZA, elevation and azimuth angles, FOV), and the atmospheric parameters
(T, p, aerosol concentration, and their optical properties) are well represented in the
RT model.
For the interpretation of the direct sun observations, our group’s raytracing model (DAMF) is used that was extensively tested in the profile retrievals of past balloon
5
flights (e.g. Harder et al., 2000, see Fig. 1 therein).
For the photochemical modelling the output from the most recent simulations of the 3-D CTM SLIMCAT (Chipperfield, 1999) at Kiruna for 6 September 2009 is used to initialise our lab-owned 1-D Facsimile code Labmos (e.g. Bösch et al., 2003). This approach is neccessary here because the output from global SLIMCAT run is only
10
available every 48 h. This time resolution is too coarse to be used for comparisons with measurements. On the other hand using a 1-D photochemical model for the model vs measurement inter-comparison appears justified, since during the balloon flight stratospheric winds were low, and thus very likely the same air masses were probed throughout our observations. However, both photochemical models use the most
re-15
cent version of the JPL kinetics and thermochemical data for all relevant gas-phase and heterogeneous reactions (Sander et al., 2011). Finally, the Labmos simulations
are constrained to the measured N2O and CH4 from spectrometer (a) to correct for
small mismatches in the profiles of the source gases due to a small bias in the diabatic
heating rate of SLIMCAT. Total stratospheric bromine (Bry) is set to 20.3 ppt, derived
20
from BrO observations of spectrometer (b), and the Brymixing ratio profile are
accord-ingly vertically shifted (about 2 km) until the modelled and measured N2O and CH4
profiles matched. The initialisation is further constrained to O3and NO2obtained from
the direct sun observations of spectrometer (b).
As an example of the simulations, Fig. 3 shows the simulated 2-D fields of BrO,
25
BrONO2, and HOBr over Kiruna for 7 and 8 September 2009. Here, the simulation
indicates that balloon soundings are well suited to study the Reactions (1), (2a), and (2b) at northern high-latitudes during the summer to winter circulation turn-over, mostly
ACPD
12, 27821–27845, 2012In-situ test of the J(BrONO2)/kBrO+NO2
ratio
S. Kreycy et al.
Title Page
Abstract Introduction
Conclusions References
Tables Figures
◭ ◮
◭ ◮
Back Close
Full Screen / Esc
Printer-friendly Version
Interactive Discussion
Discussion
P
a
per
|
Dis
cussion
P
a
per
|
Discussion
P
a
per
|
Discussio
n
P
a
per
|
and BrO) nicely overlap as well, thus providing a good sensitivity for Reaction (1) during sunset.
However, the Bry partitioning at early dawn during the solar occultation
measure-ments (the period of the red dashed lines in Fig. 3), is largely given by the efficiency of
the heterogenous reaction of
5
BrONO2+H
2O|aqueous−→HOBr+HNO3 (4)
at night. Therefore, our high-latitude sunrise solar occultation measurements are not considered any further here but they will be discussed in a separate study addressing the HOBr photochemistry.
In order to support an inter-comparison of measured and modelled slant column
10
densities (SCDs) of O3, NO2and BrO, the simulated photochemical fields are fed into
the RT models McArtim and DAMF, where path integrals through the simulated photo-chemical fields are calculated and then compared with the measured SCDs.
3 Results
Figure 4 displays the inter-comparison of the measured and modelled limb SCDs of O3,
15
NO2and BrO. While for O3and NO2the agreement is close to perfect for all elevation
angles and tangent heights, measured limb BrO is in general larger than obtained from
the simulations for the standard run (i.e. [Bry]=20.3 ppt,σ(BrONO2) andkBrO+NO
2 from
JPL-2011). This is in particular true for the high BrO SCDs values, which are obtained for large negative elevation angles (low tangent heights, or much lower altitudes than
20
the balloon float altitude), where the bulk of BrO and BrONO2 resides. In short, our
observations indicate that during dusk BrO tends to react later (or at higher SZAs) into
its major nighttime reservoir gas BrONO2, while at dawn limb BrO tends to appear
more rapidly than the standard simulation suggests.
A similar finding is obtained from the solar occultation measurements during
sun-25
ACPD
12, 27821–27845, 2012In-situ test of the J(BrONO2)/kBrO+NO2
ratio
S. Kreycy et al.
Title Page
Abstract Introduction
Conclusions References
Tables Figures
◭ ◮
◭ ◮
Back Close
Full Screen / Esc
Printer-friendly Version
Interactive Discussion
Discussion
P
a
per
|
Dis
cussion
P
a
per
|
Discussion
P
a
per
|
Discussio
n
P
a
per
|
less sensitive to Reactions (1), (2a), and (2b), since by definition the samples are
al-ways taken at SZA=90◦, i.e. at the tangent height from where most of the absorption
(signal) comes from (Fig. 5). Hence, our solar occultation observations mostly probe
the atmosphere for a more-or-less constant J(BrONO2), but at the same time the
ef-fectively probed air masses (i.e. tangent points) move more and more away from the
5
payload (up to 1200 km), i.e. towards the northwest during sunset. An inspection of the assimilation maps of the MIMOSA model’s (http://ether.ipsl.jussieu.fr/ether/pubipsl/ mimosa_2009_uk.jsp) potential vorticity (PV) indicate a negligible PV gradient at the upper level (950 K), and a small west/east PV gradient at the lower levels (475 and
550 K), indicative of different origins of both air masses. Therefore, it is likely that the
10
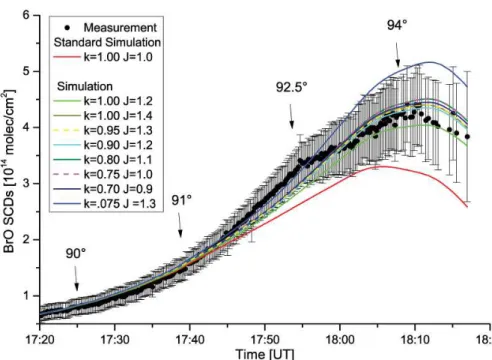
kink of the measured BrO SCD at around SZA= 92.5◦ (tangent height 27 km) is not
due to photochemistry, but transport. However, the measured BrO SCDs are larger than predicted by the standard model run (red line in Fig. 5). Therefore, the overall re-sult obtained from the solar occultation measurements is similar than deduced for limb measurements, however less robust.
15
Both findings can be taken as evidence that, either the ratio J(BrONO2)/kBrO+NO
2 is
larger than indicated by the JPL-2011 compilations, or that Bry is incorrectly assumed
in the model. These possibilities are investigated in the following section.
4 Discussion
In order to investigate potential causes for the deviation of the measured vs.
mod-20
elled BrO SCDs, a sensitivity test for the size of the parameters J(BrONO2),kBrO+NO2,
and Bry is performed for limb and solar occultation measurements (Figs. 6 and 7).
In both cases the best agreement between measurements and simulations is found
by increasing J(BrONO2), and decreasing kBrO+NO2, when forcing the regression line
measured vs. modelled BrO SCDs through 0. Figure 8 illustrates the situation, when
25
varying J(BrONO2), and kBrO+NO2 for both, the limb (dusk and dawn) and the
ACPD
12, 27821–27845, 2012In-situ test of the J(BrONO2)/kBrO+NO2
ratio
S. Kreycy et al.
Title Page
Abstract Introduction
Conclusions References
Tables Figures
◭ ◮
◭ ◮
Back Close
Full Screen / Esc
Printer-friendly Version
Interactive Discussion
Discussion
P
a
per
|
Dis
cussion
P
a
per
|
Discussion
P
a
per
|
Discussio
n
P
a
per
|
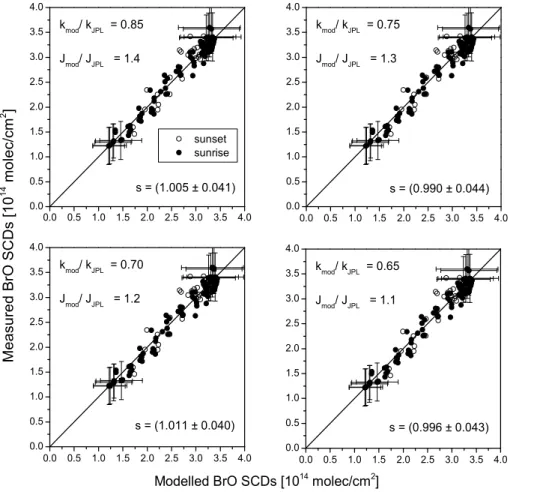
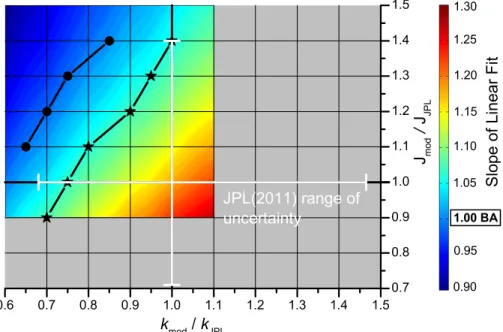
of the regression measured vs. modelled BrO SCDs. The figure indicates that for
the limb measurement the best combination of J(BrONO2), and kBrO+NO2 is obtained
when increasing J(BrONO2) to a value of 1.1 to 1.4 and decreasing kBrO+NO2 to
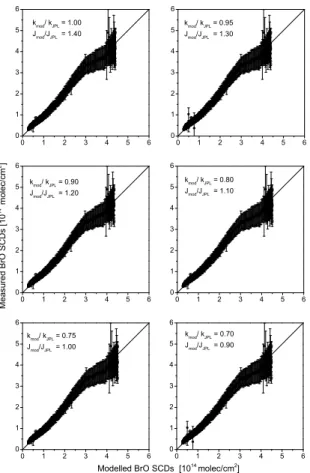
a value of 0.65 to 0.85. For the solar occulation measurements the best set of
val-ues is 0.9 to 1.4 for J(BrONO2) and 0.7 to 1 for kBrO+NO2. Most likely this
discrep-5
ancy is due to different air masses observed by both instruments, since RT
calcu-lations show that the limb samples are taken 30–70 km right hand of the payload, but the solar occulation measurements 200–1200 km towards the sun. Merging both
measurements, the best agreement is found for a ratio J(BrONO2)/kBrO+NO2|obs=
(1.69±0.04)·J(BrONO2)/kBrO+NO2|JPL, whereby less weight is put on the result of the
10
solar occultation measurements at dusk for the reasons given above.
For this flight [Bry] was (20.3±2.5) ppt (presumably in 5-yr-old air), which is
deter-mined from the direct sun measurements at balloon float using the so-called Langley
method (e.g. Dorf et al., 2006b, 2008). Also note that, for the assessment of Bryusing
Langley’s method, stratospheric BrO is probed above balloon float, where the BrO/Bry
15
partitioning is mostly due to Br atoms and BrO, and thus insensitive to J(BrONO2),
and/orkBrO+NO
2.
Sensitivity runs for [Bry] within the given uncertainty range (±2.5 ppt) are also
per-formed (not shown). Proportionally increasing/decreasing the modelled BrO SCD by
±12.5 % (±2.5 ppt) slightly decreases/increases the slope of the data, but evidently not
20
by far enough to obtain a 1 : 1 agreement between the modelled and measured BrO SCDs (Figs. 6 and 7).
Next, we address potential causes for the uncertainty in the J(BrONO2)/kBrO+NO
2
ratio. Incorrect modelled actinic fluxes by the required amount are rather unlikely, since
our RT model nicely explains the measured limb radiances at different wavelengths,
25
different elevation angles and SZAs (e.g. see Fig. 2, Bösch et al., 2001, and Fig. 5
in Deutschmann et al., 2011). Also the largely dominant contribution of the direct solar irradiance to the actinic flux seems to be well understood (e.g. Bösch et al., 2001; Gurlit
ACPD
12, 27821–27845, 2012In-situ test of the J(BrONO2)/kBrO+NO2
ratio
S. Kreycy et al.
Title Page
Abstract Introduction
Conclusions References
Tables Figures
◭ ◮
◭ ◮
Back Close
Full Screen / Esc
Printer-friendly Version
Interactive Discussion
Discussion
P
a
per
|
Dis
cussion
P
a
per
|
Discussion
P
a
per
|
Discussio
n
P
a
per
|
of Reactions (2a) and (2b) (the Br atoms formed in Reaction (2b) would readily react
with O3 to form BrO), an incorrect J(BrONO2) points to an incorrect σ(BrONO2). For
J(BrONO2) JPL-2011 states an overall uncertainty of 1.4 (Table 4.2) most likely due to
uncertainties ofσ(BrONO2) in the UV-A and visible, and its temperature dependence.
Since atT=298 Kσ(BrONO
2) agrees fairly well among the different studies, one may
5
speculate whether the recommended temperature correction forT =220 K is in fact too
strong. Furthermore, JPL-2011 states a 1σ uncertainty of 1.465 forkBrO+NO
2 at 220 K.
Here, the major uncertainty arises from the T-dependence of the high pressure limit of
the reaction, which is found to be rather large (m=2.9). Attempts to fit the data with
the JPL master equation analysis was found to be insufficient to fit the data at low
10
pressures (Sander et al., 2011). Therefore, one may again speculate as to whether
kBrO+NO2 at 220 K is somewhat lower than recommended by JPL-2011.
The finding has also implications for total stratospheric bromine. Using the inorganic
method to assess stratospheric Bryrelies on a photochemical correction, i.e. Bryis
cal-culated from measured BrO according to [BrO]=[Bry]·(1+kBrO+NO
2·[NO2]·[M]/JBrONO2...)
15
where “...” indicates contributions from minor bromine species in the stratosphere (e.g.
HOBr, Br, BrCl, and HBr). In our case, taking the revised J(BrONO2)/kBrO+NO2
ra-tio (i.e. 1.69±0.04), stratospheric Bry may decrease by as much as 1.4 ppt. In fact,
a smaller Bry assessed using the inorganic method would tend to close the existing
gap to total stratospheric bromine assessed using measurements of organic source
20
gases. Also the potential contribution of so-called very short-lived substances (VSLS) to stratospheric bromine would accordingly decrease. For example, while our
assess-ment of Bry for 4.5 old air probed over Brazil in 2005 indicated a VSLS contribution
of [VSLS]inorg=(5.2±2.5) ppt (Dorf et al., 2008), the organic method resulted in only
[VSLS]org=(1.25±0.08) ppt (Laube et al., 2008). A more recent comparison indicated
25
[VSLS]inorg=(3.5±2.5) ppt (inferred from our own BrO measurement using the Langley
method) and about [VSLS]org=2.25 ppt (Brinckmann et al., 2012), for the air masses
ACPD
12, 27821–27845, 2012In-situ test of the J(BrONO2)/kBrO+NO2
ratio
S. Kreycy et al.
Title Page
Abstract Introduction
Conclusions References
Tables Figures
◭ ◮
◭ ◮
Back Close
Full Screen / Esc
Printer-friendly Version
Interactive Discussion
Discussion
P
a
per
|
Dis
cussion
P
a
per
|
Discussion
P
a
per
|
Discussio
n
P
a
per
|
The implications of our finding for stratospheric ozone loss are small or even
negli-gible, since the ozone loss by the BrONO2 photolysis has a small contribution to the
total ozone loss by bromine (dominated by the reaction BrO+ClO), which is presently
assessed to amount to about 30–35 % on a global average (Sinnhuber et al., 2009).
Furthermore, even though BrONO2mostly photolyses into Br+NO
3(Reaction 2b), only
5
about 12 % of the produced NO3 photolyses into the channel NO+O2, which in fact
may cause some ozone loss (via reformation of BrO and NO2and the consumption of
two ozone molecules). A possibly larger impact would be through the altered
partition-ing of bromine between BrO and its reservoir BrONO2, as BrO participates in a number
of ozone loss cycles.
10
To quantify the impact of our findings two runs with the SLIMCAT off-line 3-D CTM
are performed (e.g. Chipperfield, 2006; Feng et al., 2007). The runs are initialised in November 2008 from an existing SLIMCAT run and integrated for 14 months using
ECMWF meteorology. The model run has a horizontal resolution of 2.8◦×2.8◦ and
in-cluded a detailed stratospheric chemistry scheme (Chipperfield, 1999). One model run
15
is performed with standard JPL kinetics. In the other run J(BrONO2) is scaled by 1.27
and kBrO+NO2 was scaled by 0.75, thereby scaling the ratio J(BrONO2)/kBrO+NO2 by
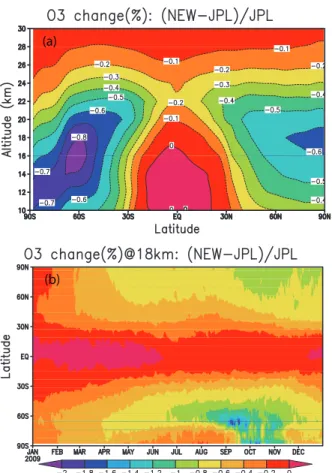
1.69. Figure 9 shows the percentage ozone difference between these runs for 2009 as
an annual mean zonal mean and as a zonal mean at 18 km altitude. Overall the im-pact of these kinetic changes on stratospheric ozone is small and confined to altitudes
20
below about 30 km where BrONO2is a reservoir for bromine. The largest decrease in
ozone is around 0.8 % at the edge of the Antarctic ozone region in September/October.
The kinetics changes lead to less BrONO2(and HOBr) and more bromine in the form
of BrO which catalyses ozone loss. The small effect itself is more important at the edge
of the polar vortex and late in the season when NOy is more readily available to form
25
BrONO2. Smaller changes are seen in the Arctic and at mid-latitudes.
In consequence, an increase in the photolysis rate and a decrease in the formation
rate of BrONO2as determined here would eventually imply only a small change in the
ACPD
12, 27821–27845, 2012In-situ test of the J(BrONO2)/kBrO+NO2
ratio
S. Kreycy et al.
Title Page
Abstract Introduction
Conclusions References
Tables Figures
◭ ◮
◭ ◮
Back Close
Full Screen / Esc
Printer-friendly Version
Interactive Discussion
Discussion
P
a
per
|
Dis
cussion
P
a
per
|
Discussion
P
a
per
|
Discussio
n
P
a
per
|
5 Conclusions
We performed an atmospheric test of the J(BrONO2)/kBrO+NO2ratio assisted by
photo-chemical and radiative transfer modelling. It is found that under stratospheric conditions
(T ≈220 K andp=50 mbar), the ratio J(BrONO
2)/kBrO+NO2 is 1.69±0.04 larger than
given in the JPL-2011 compilation. Our sensitivity study indicates that very likely both
5
σ(BrONO2) andkBrO+NO
2 differ from the JPL-2011 recommendation.
The major consequences of our study are threefold. (1) Recent assessments of
to-tal stratospheric bromine using the inorganic method during high stratospheric NOx
loadings may have overestimated the necessary correction for the BrO to Bryratio. As
a consequence, stratospheric [Bry] should be 1.4 ppt lower, which amounts to 6.8 % of
10
the total stratospheric bromine. (2) A larger J(BrONO2)/kBrO+NO2 ratio may also cause
a small increase (maximum−0.8 %) in the bromine-mediated ozone loss in the
strato-sphere, because ozone loss by BrONO2, and its products is anyhow small. Also an
overestimated stratospheric Brydue to an incorrect J(BrONO2)/kBrO+NO2ratio would be
compensated in the photochemical models, when reactive bromine is calculated using
15
the inorganic method. (3) In the troposphere, a diminished formation of BrONO2where
high NOx meets reactive bromine released from the degradation of organic bromine
compounds, or bromine being heterogeneously released from salty aerosols or salt lakes, may lead to a longer lifetime of ozone destroying BrO. In consequence, the
revised J(BrONO2)/kBrO+NO2 ratio may cause more ozone destruction and a more
ef-20
ficient degradation of organic molecules by their reaction with Br atoms on one hand. On the other hand it may hinder the activation of reactive bromine tied to the aerosol or in bulk salt (e.g. von Glasow et al., 2004; Salawitch, 2006). Accordingly, the conse-quences of our finding for ozone, and the oxidation capacity, in the troposphere may largely depend on the specific conditions.
25
ACPD
12, 27821–27845, 2012In-situ test of the J(BrONO2)/kBrO+NO2
ratio
S. Kreycy et al.
Title Page
Abstract Introduction
Conclusions References
Tables Figures
◭ ◮
◭ ◮
Back Close
Full Screen / Esc
Printer-friendly Version
Interactive Discussion
Discussion
P
a
per
|
Dis
cussion
P
a
per
|
Discussion
P
a
per
|
Discussio
n
P
a
per
|
384/5-1 and PF384/9-1/2). Additional funding from the EU projects Reconcile (FP7-ENV-2008-1-226365), and SHIVA (FP7-ENV-2007-1-226224) is highly acknowledged. The SLIMCAT mod-elling was supported by the NERC National Centre for Atmospheric Science (NCAS), UK. We thank the CNES equipe nacelles pointées and the balloon team from Aire sur l’Adour/France without which the balloon flight would not have been possible. We also thank our colleagues
5
from the LPMA balloon team (P. Jeseck, I. Pepin and Y. Té) for the successful cooperation. Finally we are grateful for the hospitality and support given by the personnel of Esrange/Kiruna to successfully perform the balloon flight.
References
Aliwell, S., Van Roozendael, M., Johnston, P., Richter, A., Wagner, T., Arlander, D., Burrows, J.,
10
Fish, D., Jones, R., Tornkvist, K., Lambert, J.-C., Pfeisticker, K., and Pundt, I.: Analysis for BrO in zenith-sky spectra: an intercomparison exercise for analysis improvement, J. Geo-phys. Res., 107, 4199, doi:10.1029/2001JD000329, 2002. 27825
Bösch, H., Camy-Peyret, C., Chipperfield, M. P., Fitzenberger, R., Harder, H., Schiller, C., Schneider, M., Trautmann, T., and Pfeilsticker, K.: Comparison of measured and modeled
15
startospheric UV/visible actinic fluxes at large solar zenith angles, Geophys. Res. Lett., 28, 1179–1182, 2001. 27829
Bösch, H., Camy-Peyret, C., Chipperfield, M. P., Fitzenberger, R., Harder, H., Platt, U., and Pfeil-sticker, K.: Upper limits of stratospheric IO and OIO inferred from center-to-limb-darkening-corrected balloon-borne solar occultation visible spectra: implications for total gaseous iodine
20
and stratospheric ozone, J. Geophys. Res., 108, 4455, doi:10.1029/2002JD003078, 2003. 27826
Brinckmann, S., Engel, A., Bönisch, H., Quack, B., and Atlas, E.: Short-lived brominated hy-drocarbons – observations in the source regions and the tropical tropopause layer, Atmos. Chem. Phys., 12, 1213–1228, doi:10.5194/acp-12-1213-2012, 2012. 27830
25
ACPD
12, 27821–27845, 2012In-situ test of the J(BrONO2)/kBrO+NO2
ratio
S. Kreycy et al.
Title Page
Abstract Introduction
Conclusions References
Tables Figures
◭ ◮
◭ ◮
Back Close
Full Screen / Esc
Printer-friendly Version
Interactive Discussion
Discussion
P
a
per
|
Dis
cussion
P
a
per
|
Discussion
P
a
per
|
Discussio
n
P
a
per
|
limb measurements, Atmos. Chem. Phys., 6, 1293–1314, doi:10.5194/acp-6-1293-2006, 2006. 27825
Camy-Peyret, C., Jeseck, P., Payan, S., Hawat, T., Durry, G., and Flaud, J.-M.: Comparison of CH4and N2O profiles at high and mid-latitudes using the LPMA balloon borne Fourier Trans-form instrument, in: Air Pollution Research Report, Polar Stratospheric Ozone Symposium,
5
Schliersee, 1995. 27824
Chipperfield, M. P.: Multiannual simulations with a three-dimensional chemical transport model, J. Geophys. Res., 104, 1781–1805, 1999. 27826, 27831
Chipperfield, M. P.: New version of the TOMCAT/SLIMCAT off-line chemical transport model: intercomparison of stratospheric tracer experiments, Q. J. Roy. Meteorol. Soc., 132, 1179–
10
1203, 2006. 27831
Deutschmann, T., Beirle, S., Frieß, U., Grzegorski, M., Kern, C., Kritten, L., Platt, U., Puk¸¯ıte, J., Wagner, T., Werner, B., and Pfeilsticker, K.: The Monte Carlo atmospheric radiative transfer model McArtim: introduction and validation of Jacobians and 3D features, J. Quant. Spec-trosc. Ra., 112, 1119–1137, 2011. 27825, 27829
15
Dorf, M., Bösch, H., Butz, A., Camy-Peyret, C., Chipperfield, M. P., Engel, A., Goutail, F., Grunow, K., Hendrick, F., Hrechanyy, S., Naujokat, B., Pommereau, J. P., Van Roozen-dael, M., Sioris, C., Stroh, F., Weidner, F., and Pfeilsticker, K.: Balloon-borne stratospheric BrO measurements: comparison with Envisat/SCIAMACHY BrO limb profiles, Atmos. Chem. Phys., 6, 2483–2501, doi:10.5194/acp-6-2483-2006, 2006a. 27824, 27825
20
Dorf, M., Butler, J., Butz, A., Camy-Peyret, C., Chipperfield, M., Kritten, L., Montzka, S., Simmes, B., Weidner, F., and Pfeilsticker, K.: Long-term observations of strato-spheric bromine reveal slow down in growth, Geophys. Res. Lett, 33, L24803, doi:10.1029/2006GL027714, 2006b. 27829
Dorf, M., Butz, A., Camy-Peyret, C., Chipperfield, M. P., Kritten, L., and Pfeilsticker, K.: Bromine
25
in the tropical troposphere and stratosphere as derived from balloon-borne BrO observations, Atmos. Chem. Phys., 8, 7265–7271, doi:10.5194/acp-8-7265-2008, 2008. 27825, 27829, 27830
Feng, W., Chipperfield, M., Davies, S., von der Gathen, S., Kyro, E., Volk, C., Ulanovsky, A., and Belyaev, G.: Large chemical ozone loss in 2004/05 Arctic Winter/Spring, Geophys. Res.
30
Lett., 34, L09803, doi:10.1029/2006GL029098, 2007. 27831
ACPD
12, 27821–27845, 2012In-situ test of the J(BrONO2)/kBrO+NO2
ratio
S. Kreycy et al.
Title Page
Abstract Introduction
Conclusions References
Tables Figures
◭ ◮
◭ ◮
Back Close
Full Screen / Esc
Printer-friendly Version
Interactive Discussion
Discussion
P
a
per
|
Dis
cussion
P
a
per
|
Discussion
P
a
per
|
Discussio
n
P
a
per
|
instrument for stratospheric balloon-borne trace gas studies, Appl. Opt., 39, 2377–2386, 2000. 27824, 27827
Gurlit, W., Bösch, H., Bovensmann, H., Burrows, J. P., Butz, A., Camy-Peyret, C., Dorf, M., Gerilowski, K., Lindner, A., Noël, S., Platt, U., Weidner, F., and Pfeilsticker, K.: The UV-A and visible solar irradiance spectrum: inter-comparison of absolutely calibrated, spectrally
5
medium resolution solar irradiance spectra from balloon- and satellite-borne measurements, Atmos. Chem. Phys., 5, 1879–1890, doi:10.5194/acp-5-1879-2005, 2005. 27829
Harder, H., Camy-Peyret, C., Ferlemann, F., Fitzenberger, R., Hawat, T., Osterkamp, H., Schnei-der, M., Perner, D., Platt, U., Vradelis, P., and Pfeilsticker, K.: Stratospheric BrO profiles mea-sured at different latitudes and seasons: atmospheric observations, Geophys. Res. Lett., 25,
10
3843–3846, 1998. 27824, 27825
Harder, H., Bösch, H., Camy-Peyret, C., Chipperfield, M., Fitzenberger, R., Payan, S., Perner, D., Platt, U., Sinnhuber, B.-M., and Pfeilsticker, K.: Comparison of measured and modeled Stratospheric BrO: implications for the total amount of stratospheric bromine, Geo-phys. Res. Lett., 27, 3695–3698, 2000. 27826
15
Kritten, L., Butz, A., Dorf, M., Deutschmann, T., Kühl, S., Prados-Roman, C., Puk˛¯ıte, J., Rozanov, A., Schofield, R., and Pfeilsticker, K.: Time dependent profile retrieval of UV/vis absorbing radicals from balloon-borne limb measurements – a case study on NO2and O3, Atmos. Meas. Tech., 3, 933–946, doi:10.5194/amt-3-933-2010, 2010. 27824, 27825
Laube, J. C., Engel, A., Bönisch, H., Möbius, T., Worton, D. R., Sturges, W. T., Grunow, K., and
20
Schmidt, U.: Contribution of very short-lived organic substances to stratospheric chlorine and bromine in the tropics – a case study, Atmos. Chem. Phys., 8, 7325–7334, doi:10.5194/acp-8-7325-2008, 2008. 27830
Payan, S., Camy-Peyret, C., Jeseck, P., Hawat, T., Durry, G., and Lefèvre, F.: First direct simul-taneous HCl and ClONO2profile measurements in the artic vortex, Geophys. Res. Lett., 25,
25
2663–2666, 1998. 27824
Platt, U. and Stutz, J.: Differential Optical Absorption Spectroscopy (DOAS), Principle and Ap-plications, ISBN 3-340-21193-4, Springer Verlag, Heidelberg, 2008. 27825
Salawitch, R.: Atmospheric chemistry: biogenic bromine, Nature, 439, 275–277, 2006. 27832 Sander, S., Friedl, R. R., Barkern, J., Golden, D., Kurylo, M., Wine, P., Abbat, J., Burkholder, J.,
30
ACPD
12, 27821–27845, 2012In-situ test of the J(BrONO2)/kBrO+NO2
ratio
S. Kreycy et al.
Title Page
Abstract Introduction
Conclusions References
Tables Figures
◭ ◮
◭ ◮
Back Close
Full Screen / Esc
Printer-friendly Version
Interactive Discussion
Discussion
P
a
per
|
Dis
cussion
P
a
per
|
Discussion
P
a
per
|
Discussio
n
P
a
per
|
Sinnhuber, B.-M., Rozanov, A., Sheode, N., Afe, O. T., Richter, A., Sinnhuber, M., Wittrock, F., Burrows, J. P., Stiller, G. P., von Clarmann, T., and Linden, A.: Global observations of strato-spheric bromine monoxide from SCIAMACHY, Geophys. Res. Lett., 32, 1–5, 2005. 27823 Sinnhuber, B.-M., Sheode, N., Sinnhuber, M., Chipperfield, M. P., and Feng, W.: The
contri-bution of anthropogenic bromine emissions to past stratospheric ozone trends: a modelling
5
study, Atmos. Chem. Phys., 9, 2863–2871, doi:10.5194/acp-9-2863-2009, 2009. 27831 Soller, R., Nicovich, J., and Wine, P.: Bromine nitrate photochemistry: quantum yields for O, Br,
and BrO over the wavelength range 248–355 nm, J. Phys. Chem. A, 106, 8378 –8385, 2002. 27823
Spencer, J. E. and Rowland, F. S.: Bromine nitrate and its stratospheric significance, J. Phys.
10
Chem., 82, 7–10, 1977. 27823
von Glasow, R., von Kuhlmann, R., Lawrence, M. G., Platt, U., and Crutzen, P. J.: Impact of reactive bromine chemistry in the troposphere, Atmos. Chem. Phys., 4, 2481–2497, doi:10.5194/acp-4-2481-2004, 2004. 27832
Weidner, F., Bösch, H., Bovensmann, H., Burrows, J. P., Butz, A., Camy-Peyret, C., Dorf, M.,
15
ACPD
12, 27821–27845, 2012In-situ test of the J(BrONO2)/kBrO+NO2
ratio
S. Kreycy et al.
Title Page Abstract Introduction Conclusions References Tables Figures ◭ ◮ ◭ ◮ Back Close
Full Screen / Esc
Printer-friendly Version Interactive Discussion Discussion P a per | Dis cussion P a per | Discussion P a per | Discussio n P a per | 0 5 10 15 20 25 30 0 5 10 15 20
15:00 16:00 17:00 18:00 0 2 4 6 O 3 O 3 dSCDs [10 19 molec/cm 2 ] NO 2 dSCDs [10 16 molec/cm 2 ] S l a n t C o l u m n D e n s i t i e s NO 2
BrO dSCDs [10
14 molec/cm 2 ] Time [UT] BrO
03:00 04:00 05:00 06:00
Fig. 1.Measured slant column densities of O3 (upper panel), NO2 (middle panel), and BrO
ACPD
12, 27821–27845, 2012In-situ test of the J(BrONO2)/kBrO+NO2
ratio
S. Kreycy et al.
Title Page
Abstract Introduction
Conclusions References
Tables Figures
◭ ◮
◭ ◮
Back Close
Full Screen / Esc
Printer-friendly Version
Interactive Discussion
Discussion
P
a
per
|
Dis
cussion
P
a
per
|
Discussion
P
a
per
|
Discussio
n
P
a
per
|
Fig. 2.Inter-comparison of measured (black) and modelled (red) relative radiances atλ=350,
ACPD
12, 27821–27845, 2012In-situ test of the J(BrONO2)/kBrO+NO2
ratio
S. Kreycy et al.
Title Page
Abstract Introduction
Conclusions References
Tables Figures
◭ ◮
◭ ◮
Back Close
Full Screen / Esc
Printer-friendly Version
Interactive Discussion
Discussion
P
a
per
|
Dis
cussion
P
a
per
|
Discussion
P
a
per
|
Discussio
n
P
a
per
|
Time [UT]
Altitude [km]
00:00 04:00 08:00 12:00 16:00 20:00 24:00
35
30
25
20
15
10 0
1 2 3 x 10
SZA [°]
Altitude [km]
105 95 90 86 75 62 75 85 90 95 105
35
30
25
20
15
10 0
0.5 1 1.5 2 2.5 3 x 10⁷
Time [UT]
Altitude [km]
00:00 04:00 08:00 12:00 16:00 20:00 24:00
35
30
25
20
15
10 0
0.5 1 1.5 2 2.5 3 x 10⁷ Concentration [10
7 molec/cm 3]
Fig. 3.Standard simulation of the key stratospheric bromine species for 7 September 2009
ACPD
12, 27821–27845, 2012In-situ test of the J(BrONO2)/kBrO+NO2
ratio
S. Kreycy et al.
Title Page
Abstract Introduction
Conclusions References
Tables Figures
◭ ◮
◭ ◮
Back Close
Full Screen / Esc
Printer-friendly Version
Interactive Discussion
Discussion
P
a
per
|
Dis
cussion
P
a
per
|
Discussion
P
a
per
|
Discussio
n
P
a
per
|
Fig. 4. Inter-comparison of limb measured vs. modelled slant column concentrations of O3
ACPD
12, 27821–27845, 2012In-situ test of the J(BrONO2)/kBrO+NO2
ratio
S. Kreycy et al.
Title Page
Abstract Introduction
Conclusions References
Tables Figures
◭ ◮
◭ ◮
Back Close
Full Screen / Esc
Printer-friendly Version
Interactive Discussion
Discussion
P
a
per
|
Dis
cussion
P
a
per
|
Discussion
P
a
per
|
Discussio
n
P
a
per
|
Fig. 5.Inter-comparison of measured vs. modelled slant column densities of BrO for the sunset
solar occultation measurements on 7 September 2009. The coloured lines show simulations for different pairs of J(BrONO2) andkBrO+NO2 as indicated by the insert. Local solar zenith angles
ACPD
12, 27821–27845, 2012In-situ test of the J(BrONO2)/kBrO+NO2
ratio
S. Kreycy et al.
Title Page Abstract Introduction Conclusions References Tables Figures ◭ ◮ ◭ ◮ Back Close
Full Screen / Esc
Printer-friendly Version Interactive Discussion Discussion P a per | Dis cussion P a per | Discussion P a per | Discussio n P a per | 0.0 0.5 1.0 1.5 2.0 2.5 3.0 3.5 4.0
0.0 0.5 1.0 1.5 2.0 2.5 3.0 3.5 4.0 0.0 0.5 1.0 1.5 2.0 2.5 3.0 3.5 4.0
0.0 0.5 1.0 1.5 2.0 2.5 3.0 3.5 4.0
0.0 0.5 1.0 1.5 2.0 2.5 3.0 3.5 4.0
0.0 0.5 1.0 1.5 2.0 2.5 3.0 3.5 4.0 0.0 0.5 1.0 1.5 2.0 2.5 3.0 3.5 4.0
0.0 0.5 1.0 1.5 2.0 2.5 3.0 3.5 4.0 sunset sunrise k mod / k JPL = 0.85 J mod / J JPL = 1.4
s = (1.005 ± 0.041)
k mod / k JPL = 0.75 J mod / J JPL = 1.3
s = (0.990 ± 0.044)
M e a su r e d B r O S C D s [ 1 0 1 4 m o l e c/ cm 2 ] k mod / k JPL = 0.70 J mod / J JPL = 1.2
s = (1.011 ± 0.040)
Modelled BrO SCDs [10
14 molec/cm 2 ] k mod / k JPL = 0.65 J mod / J JPL = 1.1
s = (0.996 ± 0.043)
Fig. 6.Inter-comparison of limb measured vs. modelled slant column densities of BrO for diff
er-ent scaling factors of J(BrONO2) andkBrO+NO2 as indicated in the individual panels. The open
ACPD
12, 27821–27845, 2012In-situ test of the J(BrONO2)/kBrO+NO2
ratio
S. Kreycy et al.
Title Page
Abstract Introduction
Conclusions References
Tables Figures
◭ ◮
◭ ◮
Back Close
Full Screen / Esc
Printer-friendly Version
Interactive Discussion
Discussion
P
a
per
|
Dis
cussion
P
a
per
|
Discussion
P
a
per
|
Discussio
n
P
a
per
|
Fig. 7.Inter-comparison of solar occultation measured vs. modelled slant column densities of
ACPD
12, 27821–27845, 2012In-situ test of the J(BrONO2)/kBrO+NO2
ratio
S. Kreycy et al.
Title Page
Abstract Introduction
Conclusions References
Tables Figures
◭ ◮
◭ ◮
Back Close
Full Screen / Esc
Printer-friendly Version
Interactive Discussion
Discussion
P
a
per
|
Dis
cussion
P
a
per
|
Discussion
P
a
per
|
Discussio
n
P
a
per
|
Fig. 8.Regression of J(BrONO2) vs. kBrO+NO2 for the limb (black dots) and solar occultation
ACPD
12, 27821–27845, 2012In-situ test of the J(BrONO2)/kBrO+NO2
ratio
S. Kreycy et al.
Title Page
Abstract Introduction
Conclusions References
Tables Figures
◭ ◮
◭ ◮
Back Close
Full Screen / Esc
Printer-friendly Version
Interactive Discussion
Discussion
P
a
per
|
Dis
cussion
P
a
per
|
Discussion
P
a
per
|
Discussio
n
P
a
per
|
(a)
(b)
Fig. 9.Difference in ozone from a simulation of the SLIMCAT 3-D CTM with scaled J(BrONO2)
(×1.27) andkBrO+NO2(×0.75) compared to a run with standard JPL kinetics.(a)Difference (%)