MULTIVARIATE STATISTICAL ANALYSIS OF SOME TRAITS OF BREAD WHEAT FOR BREEDING UNDER RAINFED CONDITIONS
Mohsen Janmohammadi1*, Zahra Movahedi2 and Naser Sabaghnia1
1Department of Agronomy and Plant Breeding, Faculty of Agriculture,
University of Maragheh, P.O. Box 55181-83111, Maragheh, Iran
2Department of Agronomy and Plant Breeding, Faculty of Agriculture,
P.O. Box 65719-95863, Malayer University, Malayer, Iran
Abstract: In order to evaluate several agro-morphological traits in 56 wheat
genotypes, an experiment based on randomized complete block design with three replications was carried out. Principal component analysis (PCA) and factor analysis were used for understanding the data structure and trait relations. The PCA showed that five components explained 69% of the total variation among traits. The first PCA was assigned 28% and the second PCA was assigned 13% of total variation among traits. The first PCA was more related to grain number, floret number, tiller number, stem diameter, leaf width and spikelet number. Therefore, the selection may be done according to the first component and it was helpful for a good breeding program for development of high yielding cultivars. The correlation coefficient between any two traits is approximated by the cosine of the angle between their vectors in the plot of the first two PCAs and the most prominent relations were between grain diameter and grain yield; and between grain length and 1,000 seed weight. The factor analysis divided the eighteen traits into five factors and the first factor included stem diameter, leaf width, tiller number, spike length, floret number, spikelet number, grain number and grain yield. The second factor was composed of some morphological traits and indicated the importance of the grain diameter, grain length, 1,000 seed weight and grain yield. The two PCA and factor analysis methods were found to give complementary information, and therefore such knowledge would assist the plant breeders in making their selection. In other words, this data reduction would let the plant breeder reduce field costs required to obtain the genetic parameter estimates necessary to construct selection indices.
Key words: factor analysis, morphological traits, grain yield, principal
component analysis.
Introduction
Wheat (Triticum aestivum L.) has been a food of the major civilizations for
8,000 years and it is the most cultivated cereal crop in the world, feeding about 40% of world population. It was cultivated on an area of 7.0 million hectare during 2011‒2012 with a production of 13.8 million tons (FAOSTAT, 2012). Wheat is the
second major food crop of the world following rice, while in Iran the crop ranks first in terms of total production. It plays an appreciable role of supplying the production with carbohydrates, proteins and minerals in human diets (Schulthess et
al., 2000; Stipešević et al., 2009; Deyong, 2011). For a successful wheat breeding
program, the presence of genetic diversity plays a vital role which is essential to meet the diversified goals of plant improvement such as attempting to increase yield potential, adaptation, desirable quality, and resistance to biotic and abiotic stresses. Developing high yielding wheat cultivars is an important objective of breeding programs. Information on the structure of genetic diversity of wheat aids the plant breeder in choosing the diverse parents for hybridization (Samsuddin, 1985; Mohamed, 1999). Breeding high yielding wheat cultivars which are an important strategy to sustain yield production draws the plant breeders’ attention. Indirect selection through traits related to grain yield is one of the most important strategies in wheat breeding.
While researching crops grown for grain yield, their yield components are marked and these are: spike density, number of grains per spike, and 1,000-seed weight. Grain yield of wheat is the integration of many traits that affect plant growth throughout the growing period (Leilah and Al-Khateeb, 2005; Protić et al.,
2009). Each trait changes to a different extent and direction under the influence of environmental factors. The studied traits are usually correlated, and therefore it may be interesting to find general regularities in the interrelations that occur among them (Rymuza et al., 2012). Statistical analysis of agronomic traits could be informative in wheat breeding program, because agronomic traits are a reflection of gene effects. Different statistical procedures have been used in modelling crop yield, including principal component analysis and factor analysis. The principal component analysis is a multivariate statistical method for exploring and simplifying complex data sets. Each principal component is a linear combination of the original variables, and so it is often possible to ascribe the meaning to what the components represent (Lewis and Lisle, 1998). Factor analysis suggested by Walton (1972) has been used to identify growth and plant characters related to wheat (Leiah and Al-Khateeb, 2005).
(2005) illustrated that number of tillers and 1,000-seed weight positively improved yield potential. The 1,000-seed weight was reported by many researchers as the variable most closely related to grain yield and was often used in selecting high yielding wheat cultivars (Deyong, 2011; Rymuza et al., 2012). The PCA is known by the fact that it includes the total variance of variables, describes maximum of variance within a data set, and is a function of primary traits. This approach seems to be effective in deciding which agronomic traits of crop contribute most to yield. The identified agronomic traits should be emphasized in the wheat breeding program. The selection of parents plays an important role in plant improvement program, as the genotype of progenies depends on the genotypes of parents. Attempts to develop ideal plant architecture of wheat have rarely been made. Briggs and Shebeski (1972) reported change in number of factors and yield related traits by the genotype × environment interaction and the first seven factors explained 90.7% of total variation. Mohamed (1999) found that two factors (grain yield and spike density) accounted for 80.8% of variation among traits in some bread wheat genotypes. Leilah and Al-Khateeb (2005) studied bread wheat genotypes and they showed that three factors including yield factor, biomass factor and harvest index factor accounted for 74.4% of total variation. One objective of this investigation was to clarify the association among some agronomic traits of bread wheat using PCA and factor analysis which provide valuable information for plant breeders who are interested in researching the agronomic traits of bread wheat and breeding new high yielding wheat cultivars in future.
Material and Methods
Fifty-six genotypes of bread wheat listed in Table 1 were assessed using a
randomized complete block design with three replications during 2012‒2013
growing season at the Research Farm of Agricultural Faculty, University of Maragheh (latitude 37°23’N, longitude 46°16’E, altitude 1,478 m). The experiment included 13 bread wheat cultivars which represent a range of phenotypic variation in maturity, adaptation zone, yield potential and date of release. The experimental region has a semi-arid climate characterized by relatively long winters. Minimum and maximum temperatures at the research station were -25°C and 40°C, respectively and the climate is characterized by mean annual precipitation of 378 mm, mean annual temperature of 18.3°C, and mean temperature of growing season of 33°C. Sowing was done by hand in plots with six rows 2.5 m long and 25 cm wide.
Tillage of all field plots was performed prior to sowing date and fertility was constrained by low organic matter and phosphorus contents. The fertilizer application was performed before sowing, 60 kg ha-1 of N, 30 kg ha-1 of P
2O5 and
weeds were controlled chemically. The number of days to flowering (DF) was recorded for each plot. Stem diameter (SD), plant height (PH), leaf number (LN), leaf length (LL), leaf width (LW), tiller number (TN), internode length (NL), peduncle length (PL), spike length (SL), floret number (FN), spikelet number (SN), grain number (GN), length of awn (AL), grain diameter (GD), and grain length (GL) were measured based on guarded plants which were randomly selected from each plot. Similarly, thousand seed weight (TS) and grain yield (GY) of each plot were measured. The grain yield per plot was measured by taking a net plot of 2 × 1 m or 2 m2.
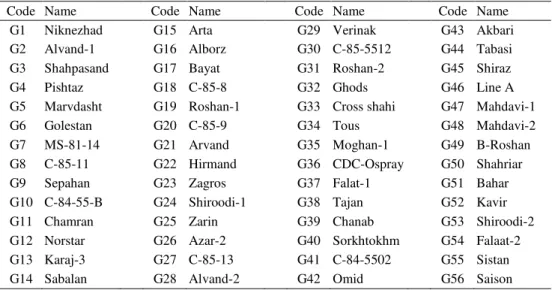
Table 1. The name and code of 56 bread wheat genotypes.
Code Name Code Name Code Name Code Name G1 Niknezhad G15 Arta G29 Verinak G43 Akbari G2 Alvand-1 G16 Alborz G30 C-85-5512 G44 Tabasi G3 Shahpasand G17 Bayat G31 Roshan-2 G45 Shiraz G4 Pishtaz G18 C-85-8 G32 Ghods G46 Line A G5 Marvdasht G19 Roshan-1 G33 Cross shahi G47 Mahdavi-1 G6 Golestan G20 C-85-9 G34 Tous G48 Mahdavi-2 G7 MS-81-14 G21 Arvand G35 Moghan-1 G49 B-Roshan G8 C-85-11 G22 Hirmand G36 CDC-Ospray G50 Shahriar G9 Sepahan G23 Zagros G37 Falat-1 G51 Bahar G10 C-84-55-B G24 Shiroodi-1 G38 Tajan G52 Kavir G11 Chamran G25 Zarin G39 Chanab G53 Shiroodi-2 G12 Norstar G26 Azar-2 G40 Sorkhtokhm G54 Falaat-2 G13 Karaj-3 G27 C-85-13 G41 C-84-5502 G55 Sistan G14 Sabalan G28 Alvand-2 G42 Omid G56 Saison
Results and Discussion
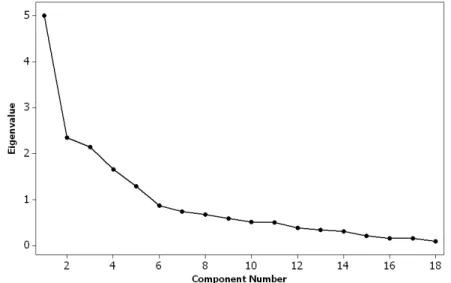
In order to know with which combination type of agronomic traits the bread wheat would attain high grain yield PCA was performed (Table 2). The Scree plot of the PCA (Figure 1) shows that the first five eigenvalues correspond to the whole percentage of the variance in the dataset. The first five main PCAs are extracted from the complicated components, the total cumulative variance of these five factors amounted to 69.24% and these components had eigenvalues >1. The PCA simplifies the complex data by transforming the number of associated traits into a smaller number of variables as PCAs. The first PCA accounts for maximum variability in the data with respect to succeeding components. The PCA grouped the estimated bread wheat variables into five main components which PCA1 accounted for about 27.80% of the variation; PCA2 for 13.07%; PCA3 for 11.93%; PCA4 for 9.24% and PCA5 for 7.19% (Table 2). The first PCA was related to grain number and its contributing traits such as floret number and tiller number, whereas the second PCA was related to grain yield and its contributing traits such as grain diameter, grain length and thousand seed weight (Table 2). The traits, which contributed more positively to PCA1, were grain number, floret number, tiller number, stem diameter, leaf width and spikelet number suggesting that this component reflected the yield potential of each genotype through some yield component aspects. In addition, the traits, which contributed positively to PCA2, were grain diameter, grain length and thousand seed weight suggesting that this component reflected the yield potential of each genotype.
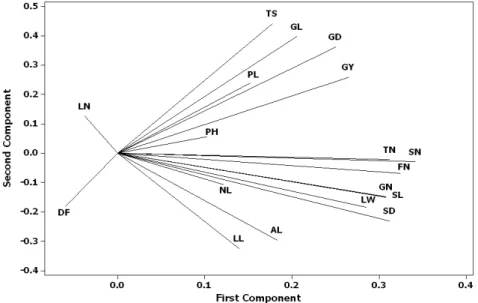
The third PCA contrasts variables that are related solely to height properties such as plant height, internode length and peduncle length (Table 2). The traits, which contributed more positively to PCA3, were plant height, internode length and peduncle length suggesting that this component reflected the height characteristics of each genotype through some related components. The forth PCA was related to spike properties and its contributing traits such as length of awn, whereas the fifth PCA was related to number of days to flowering (Table 2). The traits, which contributed more positively to PCA4, were spike length, length of awn and leaf length suggesting that this component reflected the spike potential of each genotype. The first two principal components contributing about half of the variance were plotted to observe relationships between the measured traits of wheat (Figure 2). The correlation coefficient between any two traits is approximated by the cosine of the angle between their vectors (Yan and Rajcan, 2002; Dehghani et al., 2008). The correlation coefficients among the traits indicate that the plot currently shows the relationship among the traits that had relatively large loading on both PCA1 and PCA2 axes.
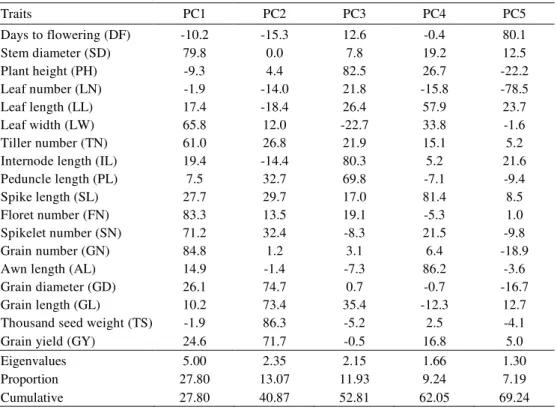
Table 2. Loadings of PCA for the estimated traits of wheat.
Traits PC1 PC2 PC3 PC4 PC5
Days to flowering (DF) -10.2 -15.3 12.6 -0.4 80.1
Stem diameter (SD) 79.8 0.0 7.8 19.2 12.5
Plant height (PH) -9.3 4.4 82.5 26.7 -22.2
Leaf number (LN) -1.9 -14.0 21.8 -15.8 -78.5
Leaf length (LL) 17.4 -18.4 26.4 57.9 23.7
Leaf width (LW) 65.8 12.0 -22.7 33.8 -1.6
Tiller number (TN) 61.0 26.8 21.9 15.1 5.2
Internode length (IL) 19.4 -14.4 80.3 5.2 21.6 Peduncle length (PL) 7.5 32.7 69.8 -7.1 -9.4
Spike length (SL) 27.7 29.7 17.0 81.4 8.5
Floret number (FN) 83.3 13.5 19.1 -5.3 1.0
Spikelet number (SN) 71.2 32.4 -8.3 21.5 -9.8
Grain number (GN) 84.8 1.2 3.1 6.4 -18.9
Awn length (AL) 14.9 -1.4 -7.3 86.2 -3.6
Grain diameter (GD) 26.1 74.7 0.7 -0.7 -16.7 Grain length (GL) 10.2 73.4 35.4 -12.3 12.7 Thousand seed weight (TS) -1.9 86.3 -5.2 2.5 -4.1
Grain yield (GY) 24.6 71.7 -0.5 16.8 5.0
Eigenvalues 5.00 2.35 2.15 1.66 1.30
Proportion 27.80 13.07 11.93 9.24 7.19
The most prominent relations shown in Figure 2 are: a strong positive association between GD and GY; between GL and TS; between LL and AL; among GN, SL, LW and SD; among TN, SN and FN; as indicated by the small obtuse angles between their vectors (r=cos0=+1). There was a near zero correlation between TS and GL, between LL and AL, between DF and LN, and of DF with LL (Figure 2) as indicated by the near perpendicular vectors (r=cos90=0). There was a negative correlation between LN and LN, and between DF and TS (Figure 2) as indicated by the angle of approximately 180 degrees (r=cos180= –1). Some discrepancies of the plot predictions and original data were expected because the first two PCAs accounted for <100% of the total variation.
Figure 2. Plot of the first two PCAs showing relation among various bread wheat traits. For explanation of character symbols, see section Material and Methods.
combination of traits that constitute an ideal plant. By plotting the PCAs that are considered to be important, plants close to the ideal plant would be selected (Yan and Rajcan, 2002). The PCA may be deemed important if their associated coefficients are of relative magnitude with breeding targets and given this apparent potential for using PCA, further work is required to compare multivariate methods for reaching actual gains.
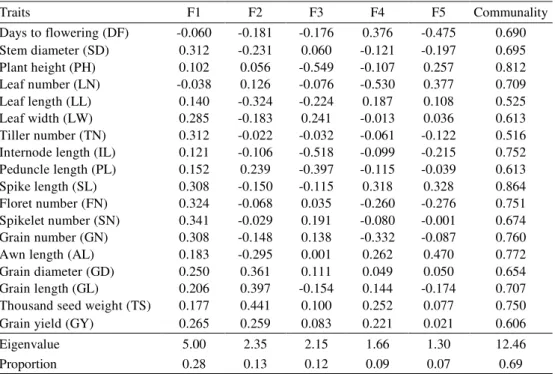
The factor analysis divided the eighteen traits into five groups or factors (Table 3) and the varimax orthogonal rotation was subjected to the matrix of factor loadings after the first extraction of factor loadings. This rotation accentuated the larger loadings in the extracted factors and suppressed the minor loadings thus improving the opportunity of achieving meaningful interpretation of factors. The factor which made the largest contribution accounted for 28% of the total variation and was composed of the some components of grain yield including stem diameter, leaf width, tiller number, spike length, floret number, spikelet number, grain number and grain yield (Table 3). Increasing floret number, spikelet number, and grain number would be the most effective way of increasing yield. The second factor, which accounted for 13% of the total variation, was composed of some of morphological traits and indicated the importance of the grain diameter, grain length, 1,000 seed weight and grain yield. It is clear that both of the first two factors which would express the combined effect of stem diameter, leaf width, tiller number, spike length, floret number, spikelet number, grain number, grain diameter, grain length, 1,000 seed weight were most closely associated with grain yield. Grain yield of bread wheat may be regarded as being composed of the components such as heads per plant, spikelets per spike, grains per spike and the 1,000 seed weight (Leilah and Al-Khateeb, 2005; Protić et al., 2009).
Table 3. Rotated (varimax rotation) factor loadings and communalities for the estimated variables of wheat.
Traits F1 F2 F3 F4 F5 Communality
Days to flowering (DF) -0.060 -0.181 -0.176 0.376 -0.475 0.690 Stem diameter (SD) 0.312 -0.231 0.060 -0.121 -0.197 0.695 Plant height (PH) 0.102 0.056 -0.549 -0.107 0.257 0.812 Leaf number (LN) -0.038 0.126 -0.076 -0.530 0.377 0.709 Leaf length (LL) 0.140 -0.324 -0.224 0.187 0.108 0.525 Leaf width (LW) 0.285 -0.183 0.241 -0.013 0.036 0.613 Tiller number (TN) 0.312 -0.022 -0.032 -0.061 -0.122 0.516 Internode length (IL) 0.121 -0.106 -0.518 -0.099 -0.215 0.752 Peduncle length (PL) 0.152 0.239 -0.397 -0.115 -0.039 0.613 Spike length (SL) 0.308 -0.150 -0.115 0.318 0.328 0.864 Floret number (FN) 0.324 -0.068 0.035 -0.260 -0.276 0.751 Spikelet number (SN) 0.341 -0.029 0.191 -0.080 -0.001 0.674 Grain number (GN) 0.308 -0.148 0.138 -0.332 -0.087 0.760 Awn length (AL) 0.183 -0.295 0.001 0.262 0.470 0.772 Grain diameter (GD) 0.250 0.361 0.111 0.049 0.050 0.654 Grain length (GL) 0.206 0.397 -0.154 0.144 -0.174 0.707 Thousand seed weight (TS) 0.177 0.441 0.100 0.252 0.077 0.750 Grain yield (GY) 0.265 0.259 0.083 0.221 0.021 0.606
Eigenvalue 5.00 2.35 2.15 1.66 1.30 12.46
Proportion 0.28 0.13 0.12 0.09 0.07 0.69
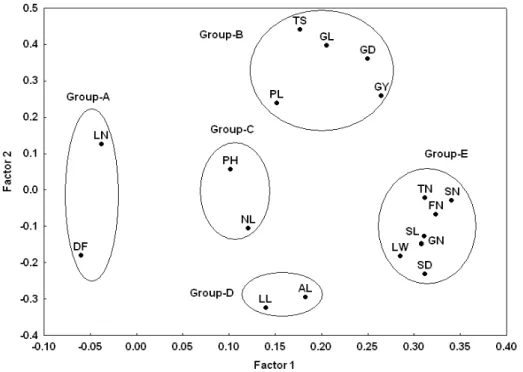
To better understand the relationships among the measured traits of bread wheat, the relationships are graphically displayed in a plot of factor-1 and factor-2 (Figure 3). In this plot, the factor-1 axis mainly distinguishes the traits of LN (leaf number) and DF (days to flowering) as Group-A from the other traits. Grain yield (GY) groups near TS (1,000 seed weight), GL (grain length), GD (grain diameter) and PL (peduncle length) traits, and we refer to these as Group-B (Figure 3). In the plot of the first two factors (Figure 3), the factor-2 axis mainly distinguishes the mentioned traits as Group-B from the other traits. Grouping of traits by multivariate methods in the research is of practical value for the bread wheat breeders (Walton, 1971; Ajmal et al., 2013). Representative genotypes with good performance of identified traits may be chosen from the particular groups for hybridization programs with other approved genotypes. This strategy will help in identifying and combining favorable genotypes to obtain important traits in one genotype with a broad genetic base.
diameter). Morphological traits of different crops have been used for estimation of genetic diversity and genetic improvement since they provide a simple way of quantifying genetic variation (Fufa et al., 2005). Analysis of genetic diversity in germplasm helps in classification of traits and identification of possible utility of different traits for breeding goals (Mohammadi and Prasanna, 2003).
Figure 3. Plot of the first two factors of factor analysis indicating relation among various bread wheat traits. For explanation of character symbols, see section Material and Methods.
Taken together, the PCA and factor analysis methods then indicate which component of grain yield was the most important under the environmental conditions prevailing for this research. The plant breeder would have useful information which would enable him to identify which morphological traits he should select in order to achieve high yield (Godshalk and Timothy, 1988).
In the present research, analysis of the diversification of wheat traits was carried out depending on the applied growth system which may to a large extent modify not only wheat traits, such as grain number, 1,000 seed weight, etc. but also the correlation of those traits (Sabo et al., 2002). Yield of wheat depended mostly on spikelet number, grain number, and 1,000 seed weight. Other investigations show, however, that the yield of wheat may be to a greater extent formed by the number of spike, number of grain and 1,000 seed weight (Protić et al., 2009; Rymuza et al.,
2012). The applied method of PCA made it possible to fully assess the relations among wheat traits which are used for the analysis of observed diversity in regard to different traits. Westerlund et al. (1991) and Schung et al. (1993) used the PCA for the description of some wheat genotypes in regard to grain quality traits. The conducted PCA allowed the reduction from eighteen primary traits to four or five new variables as principal components, which can explain 69% of the variability of the primary data. The traits that form the first, second, and subsequent PCAs, according to Ajmal et al. (2013) indicate the strongest discriminatory power. In the conducted experiment, the strongest discriminatory power was shown by the 1,000 seed weight, number of grains and grain yield.
Conclusion
References
Ajmal, S.U., Minhas, N.M., Hamdani, A., Shakir, A., Zubair, M., Ahmad, Z. (2013): Multivariate analysis of genetic divergence in wheat (Triticum aestivum) germplasm. Pakistan Journal of
Botany 45:1643-1648.
Anderson, T.W., Darling, D.A. (1952): Asymptotic theory of certain “goodness-of-fit” criteria based on stochastic processes. Annals of Mathematical Statistics 23:193-212.
Briggs, K.G., Shebeski, L.H. (1972): An application of factor analysis to some bread making quality data. Crop Science 12:44-46.
Cattell, R.B. (1965): Factor analysis: an introduction to essentials. 1. The purpose and underlying models. Biometrics 21:190-215.
Collaku, A. (1989): Analysis of the structure of correlations between yield and some quantitative traits in bread wheat. Buletini i Shkencave Bujqësore 28:137-144.
Dehghani, D., Omidi, H., Sabaghnia, N. (2008): Graphic analysis of trait relations of canola (Brassica
napus L.) using biplot method. Agronomy Journal 100:760-764.
Deyong, Z. (2011): Analysis among main agronomic traits of spring wheat (Triticum aestivum) in
Qinghai Tibet plateau. Bulgarian Journal of Agricultural Science 17:615-622.
Everitt, B.S., Dunn, G. (1992): Applied multivariate data analysis. Oxford University Press, New York, USA.
FAOSTAT (2012): FAO STAT data of Food and Agriculture Organization of the United Nations. http://faostat.fao.org/.
Fufa, H., Baenziger, P.S., Beecher, B.S., Dweikat, I., Graybosch, R.A., Eskridge, K.M. (2005): Comparison of phenotypic and molecular marker-based classifications of hard red winter wheat cultivars. Euphytica 145:133-146.
Godshalk, E.B., Timothy, D.H. (1988): Factor and principal component analyses as alternatives to index selection. Theoretical and Applied Genetics 76:352-360.
Hailegiorgis, D., Mesfin, M., Genet, T. (2011): Genetic divergence analysis on some bread wheat genotypes grown in Ethiopia. Journal of Central European Agriculture 12:344-352.
Kaiser, H.F. (1958): The varimax criterion for analytic notation in factor analysis. Psychometrika 23:187-200.
Leilah, A.A., Al-Khateeb, S.A. (2005): Statistical analysis of wheat yield under drought conditions. Journal of Arid Environments 61:483-496.
Lewis, G.J., Lisle, A.T. (1998): Towards better canola yield; a principal components analysis approach. Proceedings of the 9th Australian Agronomy Conference, Wagga Wagga, New South Wales, Australia.
Mohamed, N.A. (1999): Some statistical procedures for evaluation of the relative contribution for yield components in wheat. Zagazig Journal of Agricultural Research 26:281-290.
Mohammadi, S.A., Prasanna, B.M. (2003): Analysis of genetic diversity in crop plants-salient statistical tools and considerations. Crop Science 43:1235-1248.
Protić, R., Todorović, G., Protić, N. (2009): Correlations of yield and grain yield components of
winter wheat varieties. Journal of Agricultural Sciences (Belgrade) 54:213-221.
Rymuza, K., Turska, E., Wielogórska, G., Bombik, A. (2012): Use of principal component analysis for the assessment of spring wheat characteristics. Acta Scientiarum Polonorum – Agricultura 11:79-90.
Sabaghnia, N., Dehghani, H., Alizadeh, B., Moghaddam, M. (2011): Yield analysis of rapeseed
(Brassica napus L.) under water-stress conditions using GGE biplot methodology. Journal of
Crop Improvement 25:26-45.
Samsuddin, A.K.M. (1985): Genetic diversity in relation to heterosis and combining analysis in spring wheat. Theoretical and Applied Genetics 70:306-308.
Schulthess, U.B., Feil, J., Jutzi, S.C. (2000): Yield independent variation in grain nitrogen and phosphorus concentration among Ethiopian wheat. Agronomy Journal 89:497-506.
Schung, E., Evans, E., Heneklaus, S. (1993): Multivariate analysis of relations between mineral element concentrations in grain and baking quality of wheat. Journal of Agronomy and Crop Science 170:1-11.
Seiller, G.J., Stafford, R.E. (1985): Factor analysis of components in guar. Crop Science 25:905-908.
Stipešević, B., Stošić, M., Teodorović, B., Jug, I., Jug, D., Šimon, M., Bede, Z., Simić, M.,
Stipešević, B. (2009): Comparison of different side-dressings on winter wheat yield. Journal of
Agricultural Sciences (Belgrade) 54:189-196.
Walton, P.D. (1971): The use of factor analysis in determining characters for yield selection in wheat. Euphytica 20:416-421.
Walton, P.D. (1972): Factor analysis of yield in spring wheat (Triticum aestivum L.). Crop Science
12:731-733.
Westerlund, E., Andersson, R., Hämäläinen, M., Aman, P. (1991): Principal component analysis – an efficient tool for selection of wheat samples with wide variation in properties. Journal of Cereal Science 14:95-104.
Yan, W., Rajcan, I. (2002): Biplot analysis of test sites and trait relations of soybean in Ontario. Crop Science 42:11-20.
MULTIVARIJACIONA STATISTIČKA ANALIZA NEKIH OSOBINA
PŠENICE ZA OPLEMENJIVANJE U USLOVIMA BEZ NAVODNJAVANJA
Mohsen Janmohammadi1*, Zahra Movahedi2 i Naser Sabaghnia1
1Odsek za agronomiju i oplemenjivanje biljaka, Poljoprivredni fakultet,
Univerzitet u Maragi, Maraga, Iran
2Odsek za agronomiju i oplemenjivanje biljaka, Poljoprivredni fakultet,
Univerzitet u Malajeru, Malajer, Iran
R e z i m e
U cilju procene nekoliko agro-morfoloških osobina kod 56 genotipova
pšenice, sproveden je ogled zasnovan na potpuno slučajnom blok sistemu sa tri ponavljanja. Analiza glavnih komponenti (PCA) i faktorska analiza su korišćene za
razumevanje strukture podataka i odnosa osobina. PCA je pokazala da su pet komponenti objasnile 69% ukupne varijacije koja postoji među osobinama. Prva glavna komponenta je činila 28%, a druga glavna komponenta je činila 13% ukupne varijacije među osobinama. Prva glavna komponenta se više odnosila na broj zrna, broj cvetića, broj izdanaka, prečnik stabljike, širinu lista i broj klasića.
Prema tome, selekcija može biti izvršena prema prvoj komponenti i to je bilo od
pomoći za dobar program oplemenjivanja za razvoj visokoprinosnih sorti. Koeficijent korelacije između bilo koje dve osobine se približno izračunava kosinusom ugla između njihovih vektora u polju prve dve PCA. Najistaknutiji odnosi su bili između prečnika zrna i prinosa zrna, kao i između dužine zrna i mase
1.000 semena. Faktorska analiza je podelila osamnaest osobina u pet faktora i prvi
faktor je uključivao prečnik stabljike, širinu lista, broj izdanaka, dužinu klasa, broj cvetića, broj klasića, broj zrna i prinos zrna. Drugi faktor se sastojao od određenih morfoloških osobina i ukazivao je na važnost prečnika zrna, dužinu zrna, masu
1.000 semena i prinos zrna. Utvrđeno je da su metode PCA i faktorske analize dale komplementarne informacije i takva saznanja bi mogla pomoći oplemenjivačima biljaka prilikom selekcije. Drugim rečima, ovo smanjenje podataka će omogućiti
oplemenjivačima biljaka smanjenje troškova poljskih ogleda potrebnih za dobijanje procene genetičih parametara neophodnih za indekse selekcije.
Ključne reči: faktorska analiza, morfološke osobine, prinos zrna, analiza glavnih komponenti.
Primljeno: 24. decembra 2013. Odobreno: 24. januara 2014.