JOURNAL OF GEOPHYSICAL RESEARCH, VOL. 106, NO. D16, PAGES 17,877-17,887, AUGUST 27, 2001
Biomass
fire consumption
and carbon release rates of rainforest-
clearing experiments
conducted
in northern Mato Grosso,
Brazil
Jo•o
A. Carvalho
Jr.,
1 Fernando
S. Costa,
2 Carlos
A. Gurgel
Veras,
3 David
V. Sandberg,
4
Ernesto
C. Alvarado,
s Ralf Gielow,
2 Aguinaldo
M. Serra
Jr.,
2 and
Jos6
C. Santos
2
Abstract. Biomass consumption and carbon release rates during the process of forest clearing by fire in five test plots are presented and discussed. The experiments were conducted at the Caiabi Farm, near the town of Alta Floresta, state of Mato Grosso, Brazil, in five square plots of 1 ha each, designated A, B, C, D, and E, with different locations and timing of fire. Plot A was located in the interface with a pasture, with three edges bordering on the forest, and was cut and burned in 1997. Plots B,C, D, and E were located inside the forest. Plot B was cut and burned in 1997. Plot C was inside a deforested 9-ha area, which was cut and burned in 1998. Plot D was inside a deforested 4-ha area, which was cut in 1998 and burned in 1999. Plot E was inside a deforested 4- ha area, which was cut and burned in 1999. Biomass consumption was 22.7%, 19.5%, 47.5%, 61.5%, and 41.8%, for A, B, C, D, and E, respectively. The effects of an extended curing period and of increasing the deforested area surrounding the plots could be clearly observed. The con- sumption, for areas cut and burned during the same year, tended toward a value of nearly 50% when presented as a function of the total area burned. The aboveground biomass of the test site
and
the amount
of carbon
before
the fire were
496 Mg ha
'1 and 138 Mg ha
'1, respectively.
Consid-
ering that the biomass that remains unburned keeps about the same average carbon content of fresh biomass, which is supported by the fact that the unburned material consists mainly of large logs, and considering the value of 50% for consumption, the amount of carbon released to the
atmosphere
as gases
was
69 Mg ha
'1. The amounts
of CO2
and
CO released
to the atmosphere
by
the burning
process
were
then
estimated
as 228 Mg ha
'1 and 15.9
Mg ha
'1, respectively.
Observa-
tions on fire propagation and general features of the slash burnings in the test areas complete the paper.
1. Introduction
Approximately one quarter of all tropical rainforests are
located in Brazil [Myers, 1991]. The Brazilian Amazon Basin
occupies
a total area
of 3,940,000
km
2, including
3,648,000
km 2 of forested land and 292,000 km 2 of nonforested land [Braga, 1979]. Fearnside et al. [1993] and Higuchi et al. [1994] have estimated the average stock of carbon per hectare in the aboveground biomass as 151 +_ 39 Mg throughout the Amazon Basin in dense forestland.
Uncertainties in the estimates of emission rates from forest
burning for land conversion are very high, mainly because of (1) uncertainties about the rate of deforestation and land area cleared by fires, (2) difficulties in determining total biomass, and (3) the purpose, and therefore the future vegetation type, of
1Universidade
Estadual
Paulista,
Guamtinguet•,
Brazil
2Instituto
Nacional
de
Pesquisas
Espaciais,
Cachoeira
Paulista,
Brazil3Universidade
de
Brasflia,
Brasilia,
Brazil
4United
States
Department
of Agriculture
Forest
Service,
Corvallis, Oregon
5University
of
Washington,
Seattle,
Washington
Copyright 2001 by the American Geophysical Union.
Paper number 2000JD900791.
0148-0227/01/2000JD900791 $09.00
the land being deforested [Martinelli et al., 1996]. Uncertainty in the amount of biomass buming in each ecosystem causes large uncertainties in the assessment of its impact on the atmospheric chemistry and on global climate change [Hao and Liu, 1994; Hao et al., 1994; Ferguson et al., 2000].
The vegetation in Brazil contains 5 times more carbon than that of Zaire, the world's second largest carbon-storing country
[Food and Agriculture Organization, 1992]; therefore, these difficulties and uncertainties are more significant in Brazil than anywhere else in the world. Carbon dioxide emission resulting from deforestation and biomass combustion is of great concern not only in Brazil but worldwide because of its influence on global warming.
Clearing and biomass burning are part of the land conversion process that follows the colonization of the Amazon region. Every year, the land preparation process for farming in the Amazon begins in the dry season, during June and July,
when the felling starts. Fires are initiated 2 or 3 months later,
prior to the rainy season, after the biomass has dried out enough to sustain combustion. An increasing number of clearing fires have been observed in recent years [Cunha, 1989; Martinelli et al., 1996].
Researchers have been working to obtain more acc•e and representative data on deforestation and burning of biomass in the Brazilian Amazon [Ward et al., 1992; Fearnside et al., 1993; Kauffrnan et al., 1995; Carvalho et al., 1995, 1998; Aragjo et al., 1999; Fearnside, 2000]. Data of this kind for Africa, as well as the procextures adopted to determine the main burning parameters, can be found in the spedal issue "Southern Africa Fire-Atmosphere
17,878 CARVALHO ET AL.: BIOMASS FIKE CONSUMPTION AND CARBON RELEASE RATES
•ON
•'OSSO
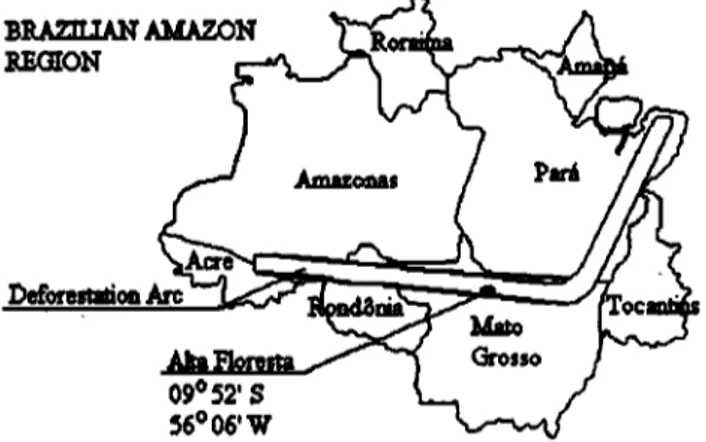
Figure 1. The Brazilian Amazon region and the location of Alta Floresta and the Are of Deforestation.
Research Initiative (SAFARI)" (Journal of Geophysical Research, 101(D19), 23,521-23,863, 1996) [e.g,, Scholes et al., 1996a, 1996b; Shea et al., 1996; Ward et al., 1996].
Results of the work undertaken to estimate the biomass
consumption and the carbon release rates to the atmosphere through the process of forest clearing in five test plots are presented and discussed. The forest in the 1-ha test plots and in their surrounding areas, each with different characteristics of location and timing of the fire, was cut and burned between 1997 and 1999. Experiments were carried out at the Caiabi
Farm, 30 km Southwest of the town of Alta Floresta, state of
Mato G-rosso, Brazil.
Alta Floresha, shown in the map of Figure 1, is located in the Amazonian arc of deforestation and has experienced a very active expansion of its agricultural frontier. The region is characterized by a long and relatively well defined drought season from June to August, which facilitates the execution of field bum tests.
and burned in 1998. D was located inside a deforested 4-
hectare area, which was cut in 1998 and burned in 1999. E, was located inside a deforested 4-hectare area, which was cut
and burned in 1999.
Tests in plots A and B were designed to investigate the edge effect of the interface with pastures on the consumption. The pasture adjacent to A was formed in 1994, and its original forest vegetation was felled in 1977. From 1977 to 1994 the area was a coffee plantation. The test in C was planned to investigate the effects of the border width with the adjacent forest. The tests in D and E were planned to provide differ- ences between two curing periods in areas with reasonable border widths.
In C, D, and E, not only were the test plots burned but also the area around them. The border width here is defined as the distance from the sides of the square test plot to the uncut
forest. For C the border width was of the order of 100 m (the
total area felled was not a square), and for D and E it was 50
m.
Each of the test plots was divided into 10 subsample rectangle units, each measuring 10 x 100 m, to simplify the activities and the location of trunks and small sampling areas. As a first step, a forest inventory was carried out in the test areas. Tree measurements included DBH, trunk height, and canopy height. The next step was the clearing of the forest. This activity was done at the beginning of the dry season in May. Fires were lit in August.
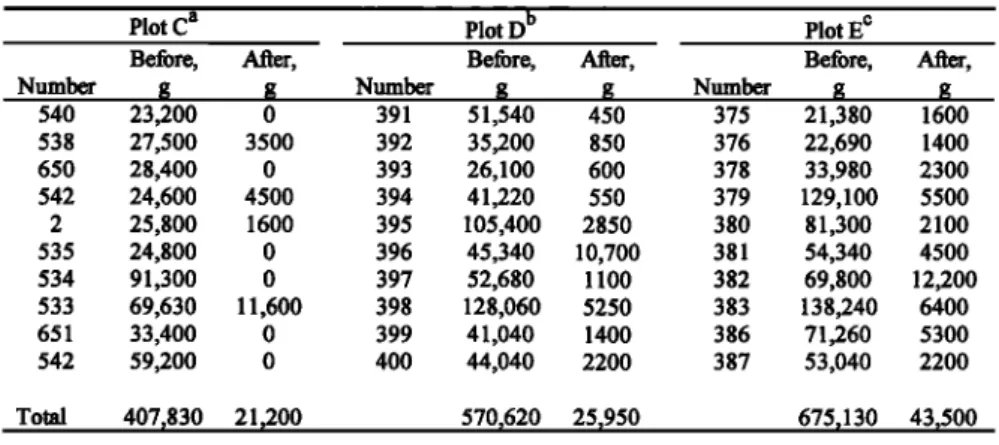
Consumption of small size material was estimated by weighing the biomass before and after the burning in 10 square 2 x 2 m subplots identified before the fire in each test area. Small-size material was composed of leaves, small bushes and branches, litter, and lianas. The sub plots were bounded with wires for identification afire the fire. Weighing was performed on site with a portable scale with a precision of 0.01 kg.
Logs and larger branches (diameter (D) > 10em) were considered as medium- and large-size materials. In the tests of A and B the consumption for these categories was estimated by direct
2. Experimental
Procedure
The sequence for land clearing using fire in the Amazon follows seasonal variations. At the beginning of the dry season, farmers cut small trees whose diameter at breast height (DBH) is <5 cm (breast height is ~1.3 m); these are left to cure. These small trees act as fuel to sustain the fire to bum the larger trees. The next step, generally 1 month later, is to complete felling of all trees and vegetation in the area. ARer 2 months of exposure to sunlight drying the vegetation is sufficiently dry to sustain fire. This is the peak period of emission of gases in the region. Another step, not always necessary, is the so-called "coivara," which is the gathering and burning of the remaining unburned or partially burned logs and branches to clean the soil for planting. It is usually performed 1 month after the main fire. The biomass burned in this second step is of the order of 3% of the initial biomass in the main fire [Aradjo et al., 1999].
The tests were performed in five square plots of 1 ha each,
designated
A, B, C, D, and E, as shown
in Figure
2. The
following are the main characteristics of each plot: A was located in the interface with a pasture, with three sides facing directly the forest; it was cut and burned in 1997. B was located approximately 400 m inside the forest, with four sides directly bordering the forest; it was cut and burned in 1997. C
was located inside a deforested 9-hectare area, which was cut
•N
09 ø 58' S 56 ø 21' W
FOREST
•, .
Figure 2. Location of the 100 x 100 m test plots on Caiabi
farm. A and B were felled and burned in 1997, C was felled
and burned in 1998, D was felled in 1998 and burned in 1999,
CARVALHO ET AL.: BIOMASS FIRE CONSUMPTION AND CARBON RELEASE RATES 17,879
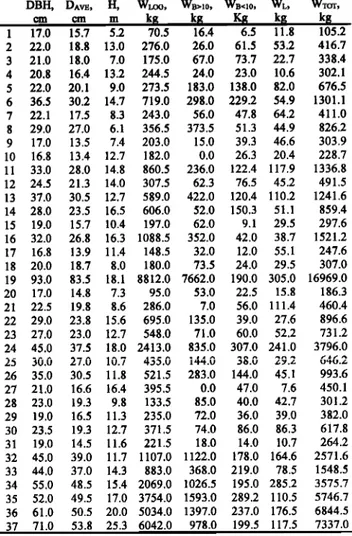
Table 1. Results of Weighing Procedure With 37 Individuals a
Table 3. Number of Individual Trees in Each DBH Class in
Plot C
DBH, D^v•,
cm cm
1 17.0 15.7 2 22.0 18.8 3 21.0 18.0 4 20.8 16.4 5 22.0 20.1 6 36.5 30.2 7 22.1 17.5 8 29.0 27.0 9 17.0 13.5 10 16.8 13.4 11 33.0 28.0 12 24.5 21.3 13 37.0 30.5 14 28.0 23.5 15 19.0 15.7 16 32.0 26.8 17 16.8 13.9 18 20.0 18.7 19 93.0 83.5 20 17.0 14.8 21 22.5 19.8 22 29.0 23.8 23 27.0 23.0 24 45.0 37.5 25 30.0 27.0 26 35.0 30.5 27 21.0 16.6 28 23.0 19.3 29 19.0 16.5 30 23.5 19.3 31 19.0 14.5 32 45.0 39.0 33 44.0 37.0 34 55.0 48.5 35 52.0 49.5 36 61.0 50.5 37 71.0 53.8
H, WLO0, WB>10, WB<10, WL, WTOT,
m kl• kl• Kg kg kg
5.2 70.5 16.4 6.5 11.8 105.2
13.0 276.0 26.0 61.5 53.2 416.7
7.0 175.0 67.0 73.7 22.7 338.4
13.2 244.5 24.0 23.0 10.6 302.1
9.0 273.5 183.0 138.0 82.0 676.5
14.7 719.0 298.0 229.2 54.9 1301.1
8.3 243.0 56.0 47.8 64.2 411.0
6.1 356.5 373.5 51.3 44.9 826.2
7.4 203.0 15.0 39.3 46.6 303.9
12.7 182.0 0.0 26.3 20.4 228.7
14.8 860.5 236.0 122.4 117.9 1336.8
14.0 307.5 62.3 76.5 45.2 491.5
12.7 589.0 422.0 120.4 110.2 1241.6
16.5 606.0 52.0 150.3 51.1 859.4
10.4 197.0 62.0 9.1 29.5 297.6
16.3 1088.5 352.0 42.0 38.7 1521.2
11.4 148.5 32.0 12.0 55.1 247.6
8.0 180.0 73.5 24.0 29.5 307.0
18.1 8812.0 7662.0 190.0 305.0 16969.0
7.3 95.0 53.0 22.5 15.8 186.3
8.6 286.0 7.0 56.0 111.4 460.4
15.6 695.0 135.0 39.0 27.6 896.6
12.7 548.0 71.0 60.0 52.2 731.2
18.0 2413.0 835.0 307.0 241.0 3796.0
i0.7 435.0 144.0 32.0 29.2 646.2
11.8 521.5 283.0 144.0 45.1 993.6
16.4 395.5 0.0 47.0 7.6 450.1
9.8 133.5 85.0 40.0 42.7 301.2 11.3 235.0 72.0 36.0 39.0 382.0
12.7 371.5 74.0 86.0 86.3 617.8
11.6 221.5 18.0 14.0 10.7 264.2 11.7 1107.0 1122.0 178.0 164.6 2571.6
14.3 883.0 368.0 219.0 78.5 1548.5 15.4 2069.0 1026.5 195.0 285.2 3575.7 17.0 3754.0 1593.0 289.2 110.5 5746.7 20.0 5034.0 1397.0 237.0 176.5 6844.5
25.3 6042.0 978.0 199.5 117.5 7337.0
a Abbreviations are as follows: DBH, diameter at breast height; DAVE,
log diameter at half height; H, log height; W, weight; LOG, log; B> 10, branches with diameter higher than 10 cm; B< 10, branches with diameter
lower than 10 cm; L, leaves; TOT, total.
observations of a number of randomly selected logs, using the same
procedure
described
by Carvalho
et al. [1998]
and
Aragjo
et al.
[1999].
In the tests
of C, D, and E the consumption
of these
categories
was estimated
using the log-wiring
procedure
of
Sandberg and Ottmar [1983]. Both procedures led to similar results.
Table 2. Summary Results of the Weighing Procedure of 37 Individual Trees
Branches, Branches,
DBH class, Logs, D> 10 cm, D<I 0 cm, Leaves,
em Trees k 8 kg kl• kg
10-20 9 1532.5 341.9 189.7 258.4 20- 30 15 5346.5 1359.8 988.1 730.9 30 - 40 5 3778.5 1591.0 658.0 366.8 40- 50 3 4403.0 2325.0 704.0 484.1
50 - 60 2 5823.0 2619.5 484.2 395.7
60- 70 1 5034.0 1397.0 237.0 176.5 70 - 80 1 6042.0 978.0 199.5 117.5 > 80 1 8812.0 7662.0 190.0 305.0
DBH Class,
cm Individu• Trees
10-20 231
20- 30 156
30-40 62
40 - 50 14
50 -60 8
60- 70 5
70 - 80 7
> 80 5
The
present
method
is an alternative
to the
line
intersect
method
[Brown,
1974;
Van
Wagner,
1982].
It is especially
appropriate
for
the
rain
forest
vegetation,
which
contains
a large
number
of species
and
has
significant
differences
in biomass
demities
and
buming
characteristics.
The data for consumption
and mass
of carbon
in each
dry
biomass
size category
present
in the 1-ha plots allowed
the
estimation
of the
quantity
of CO2
released
to the atmosphere
by the
combustion process.
The unbumed fuel that will eventually end up as atmospheric
CO2
via biological
processes
and
the amount
of carbon
sequestered
in soil are not considered here. Fearnside [1992] reports that the carbon released to the atmosphere by biological decay over the
years
can
be as
high
as
69%
of the
original
aboveground
biomass.
3. Biomass Distribution and Total Biomass
per Hectare
In order to estimate the biomass distribution among tree
biomass
categories,
37 individual
trees
were felled in a site
adjacent
to the bums,
and the logs,
branches,
and leaves
were
weighted.
Results
of this activity
are presented
in Table
1. Data
were then grouped by DBH class, as shown in Table 2.
The mass of litter per hectare was estimated with weight measurements in three randomly chosen areas: 30.4 kg in area
1 (16
m2),
73 kg in area
2 (25
m2),
53.4
kg in area
3 (25
m2).
The mass
of litter (Mlitter)
per unit area
was
then
calculated:
30.4
+ 73
+ 53.4
kg = 23758
kg
Mlitter=
16+25+25
m
2
m
2 '
Table
3 gives
the number
of individual
trees
in each
DBH
class
in plot C. Using
the data
of C, the results
of Table
2 were
extrapolated
to yield estimates
of biomass
distribution
per
biomass
category
and the total weight
of fresh
biomass
in the
test field (Table
4). The biomass
in the test field added
up to
Table 4. Biomass Distribution as Function of Biomass Cate-
Total Weight in Biomass Distri-
Biomass Category 1 ha, bution,
k!• %
Logs, 10 cm < DBH < 30 cm 94938 19.1
Loga, DBH > 30 cm 202972 40.9
Branches, D > 10 cm 116433 23.5
Branches, D < 10 cm 32190 6.5
Leaves 25927 5.2
Litter 23758 4.8
7,880 CARVALHO ET AL.: BIOMASS FIKE CONSUMPTION AND CARBON RELEASE RATES
Table $. Biomass Consumption of Plots A to E
Plot A Plot B Plot C Plot D Plot E
Dist, qind, Ctb, qind, Ctb, qind, Ctb, qind, Ctb, qind, Ctb,
Biomass cate8o .ry % % % % % % % % % % %
Logs, 10 cm < DBH < 30 cm 19.1 13.3 2.6 10.4 2.0
Logs, DBH > 30 cm 40.9 5.3 2.2 3.1 1.3
Branches, D > 10 cm 23.5 13.3 3.1 10.4 2.4
Branches, D < 10 cm 6.5 84.0 5.4 82.6 5.4
Leaves 5.2 93.7 4.9 84.0 4.4 Litter 4.8 93.7 4.5 84.0 4.0 Total 100.0 22.7 19.5
51.0 9.8 72.5 13.9 42.2 8.1 24.7 10.1 36.2 14.8 20.5 8.4 51.0 12.0 72.5 17.0 42.2 9.9 94.8 6.1 95.5 6.2 93.6 6.1 94.8 5.0 95.5 5.0 93.6 4.9 94.8 4.6 95.5 4.6 93.6 4.5 47.5 61.5 41.8
a Abbreviations
are
as
follows:
Dist,
mass
distribution
among
biomass
categories;
qiad,
individual
biomass
consumption
of
biomass category; Ctb, contribution of biomass category to biomass consumption.
496 Mg ha
'1. Values
of fresh
biomass
in the Amazon
forest
vary
between
290 and 900
Mg ha'l [Klinge
and Rodrigues,
1973;
Higuchi and Carvalho, 1994; Brown et al., 1992, 1995].
4. Biomass
Consumption
and Carbon Release
Rates to the Atmosphere
Data on the consumption for each of the biomass categories in areas A to E, determined with the procedure described in section 3, are presented in Table 5. Specific data of consump- tion in areas C, D, and E for the 2 x 2 m subplots and in areas D and E for the logs are presented in Tables 6 - 10.
The consumption obtained for plot A (22.7%) was 16% higher than that obtained for plot B (19.5%). This is the effect of the single free border with a pasture in plot A. As the total burned area increases, the consumption also increases. This change is drastic in the interval of total deforested area of 1 to 4 ha: The consumption for plot E (41.8%) is 84% higher in comparison with that of plot A; for plot C (47.5%) it is 14% higher in comparison with that of plot E.
A long period of curing under the Sun produced a significantly higher consumption. The result of 61.5% for plot D is the highest of all.
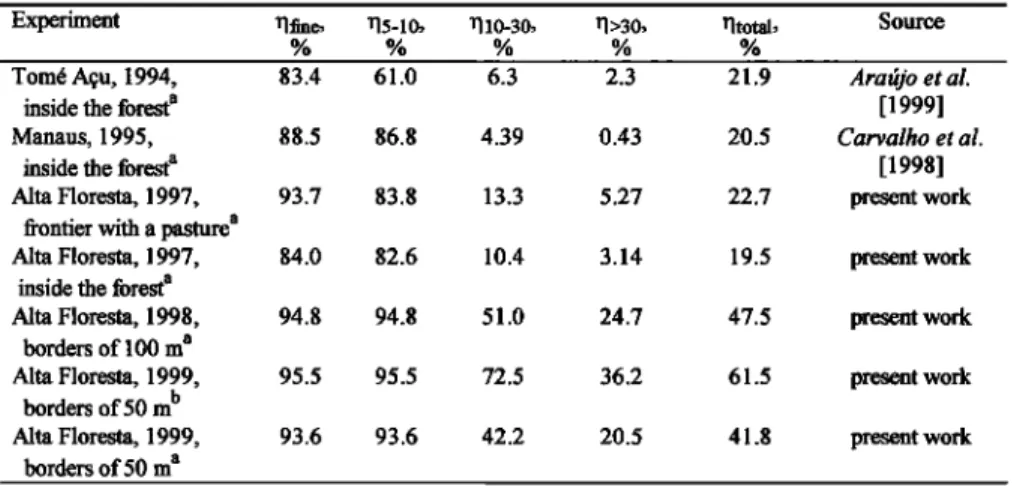
Combustion results for consumption of plots A and B qualitatively reproduce previous results obtained by AratJjo et al. [1999] in Tom6 Agu, state of Par/t, and Carvalho et al.
[1998] in Manaus, state of Amazonas, which also had similar test site configurations of 100 x 100 m with no felled borders
with the surrounding forest. This can be seen in Table 11. Figure 3 presents the consumption, given in Table 11, as a function of the total deforested and burned area. This curve indicates the tendency to a maximum value of the order of 50% for bums occurring in the same year that the biomass is cut, which is the usual burning procedure in the Amazon region. A similar asymptotic trend in fire intensity that may be related to the amount of biomass cornbusted was observed by McNaughton et al. [1998]. They suggested that for higher intensities, combustion may be limited by oxygen starvation and thermal quenching due to air entrainment.
Using
the average
carbon
content
of dry biomass
(48%) and
the average moisture content of fresh biomass (42%, in terms of mass of moisture per total biomass) determined by Carvalho et al. [1995], and considering the determined biomass of the
test site, 496 Mg ha
'l, the amount
of carbon
on the ground
before
the burning
is calculated
as 138 Mg ha
4. Assuming
that
the biomass which remains unburned on the ground keeps the same average of 48% carbon, which is supported by the fact that the unburned material consists mainly of large logs, and considering the value of 50% for the consumption, then the amount of carbon released to the atmosphere as gases during
the burn
is calculated
as 69 Mg ha
4.
The amounts of CO2 and CO released to the atmosphere by the burning process are estimated by assuming that, in practice, these
gases account for 95 - 99% of the carbon released fixan the fuel
[Ward and Hardy, 1991] and that - 90% of the CO2/CO mixture is CO2 on a volumetric basis [Crutzen and Andreae, 1990]. The latter
Table 6. Biomass Consumption of Fine Material in the 2 x 2 m Subareas
Plot C a Plot D b Plot E c
Befog, After, Before, After,
Number • g Number 8 •
540 23,200 0 391 51,540 450
538 27,500 3500 392 35,200 850
650 28,400 0 393 26,100 600
542 24,600 4500 394 41,220 550
2 25,800 1600 395 105,400 2850
535 24,800 0 396 45,340 10,700
534 91,300 0 397 52,680 1100
533 69,630 11,600 398 128,060 5250
651 33,400 0 399 41,040 1400
542 59,200 0 400 44,040 2200
Total 407•830 21•200 570•620 25,950
a Efficiency is 94.8%.
b Efficiency
is 95.5%.
c Efficiency is 93.6%.
Befog, After,
Number g .•
375 21,380 1600
376 22,690 1400
378 33,980 2300
379 129,100 5500
380 81,300 2100
381 54,340 4500
382 69,800 12,200
383 138,240 6400
386 71,260 5300
387 53,040 2200
CARVALHO ET AL.' BIOMASS FIKE CONSUMPTION AND CAKBON RELEASE RATES 17,881
Table 7. Biomass
Consumption
of Logs
With 10 cm < DBH < 30 cm in Plot D a
DBH, Diameter, b
Orientation, cm cm Height,
Identification Species de 8 Before After m Before
745 Jambo 28 26.5 20 17.1 14.9 0.2340 19.3 16.5 0.2180 746 Not Identified 360 24.2 18.6 0 21.8 0.2962 18.3 0 0.2867
749 Seringueira 336 27.7 22.2 0 9.0 0.1742
20.3 0 0.1456 765 Emba6ba 51 27.2 27 0 13.8 0.3951 23.5 0 0.2993 768 Jambo 302 17.7 15.9 6.6 8.3 0.0824 18 0 0.1056
771 Morcegueira 220 24.2 14.2 0 9.2 0.0728
18.4 0 0.1223 772 Jambo 225 23.2 21.1 15.8 12.7 0.2220 20.8 18.2 0.2158 773 Guatambu 296 25.9 36.7 0 10.1 0.5342 41.1 0 0.6700 783 Inhar6 151 22.7 20.5 20.5 7.3 0.1205 21.2 20.6 0.1288
784 Morcegueiva 324 30.0 23.5 23.5 10.7 0.2320
28 23.4 0.3294 785 Canela 280 28.6 16.5 0 6.9 0.0738 19.6 0 0.1041 789 Canela 317 23.0 21.5 19.8 10.4 0.1888 19.5 16.7 0.1553 791 Emba6ba 267 29.1 21 0 7.2 0.1247 26.2 10.9 0.1941 792 Guatambu 161 22.8 19.6 0 8.9 0.1343 20.8 0 0.1512
794 Laranjinha 48 24.7 19.2 0 8.3 0.1202
20 0 0.1304
796 Laranjinha 246 28.9 24.9 0 9.8 0.2386
27.2 0 0.2847 799 Maracatiara 282 27.2 23 22.2 8.3 0.1724 24.4 22.1 0.1941
Volume, c
0.1711 0.1593 0.0000
Burned 0.0630 0.0587 0.2962 0.0000
0.0000
0.0000 0.0000 0.0000 0.0142 0.0000 0.0000 0.0000 0.1245 0.1652 0.0000 0.0000 0.1205 0.1217 0.2320 0.2301 0.0000 0.0000 0.1601 0.1139 0.0000 0.0336 0.0000
0.0000
0.0000 0.0000
0.0000
0.0000 0.1606 0.1592
0.2867
0.1742
0.1456 0.3951 0.2993 0.0682 0.1056 0.0728 0.1223 0.0975 0.0506
0.5342
0.6700 0.0000 0.0072 0.0000 0.0993 0.0738 0.1041 0.0287 0.0414
0.1247
0.1605 0.1343 0.1512 0.1202 0.1304 0.2386
0.2847
0.0118 0.0349
Total 7.1515 5.1856
a Efficiency oflogs with 10 cm < DBH < 30 cm in plot D is 72.5%( = 5.1856/7.1515). Diameter at wire location, two wires by log, at ¬ and •A length.
Volume corresponds to half height.
80 -
60 -
' I I I I I I I
4 6 8 10
Deforested area (ha)
Figure 3. Biomass consumption in the cemral 1-ha plot as a runtion of the total deforested and burned area. The circles represem plots that were burned 3 months after they were cut; the square represems the plot that was burned 15 months after it was cut.
means that in the combustion reaction each Mg of C produces 3.30 Mg of CO2 and 0.23 Mg of CO.
Taking 97ø/6 as the average of Ward and Hardy's [1991] values and 90ø/6 CO2 in the COYCO mixture, the release rates of CO2 and
CO in the experiment
were
estimated
to be 228 Mg ha
'l and 15.9
Mg ha
'l, respectively.
Alternative data on CO2 and CO emission ratios could be used to
estimate the release rates of these gases to the atmosphere in the Alta Floresta experiments. Those are reported by Cofir et al. [1990, 1998] for boreal forest fires and Blake et al. [1996] and Cofir et al. [1996] for savanna fires. Nearly 90ø/6 of the carbon gases are
released in the form of CO: in boreal forest fires. For savanna fires
this value increases to 93%. CO emissions vary d•ding on the conditions of the fire. Cofir et al. [1996] compare wetlands, savanna, and bor• forest fire CO emissions during flaming and smouldering conditions. They report the following CO/CO: ratios during flaming and smouldering (1) 4.7 + 1.1% and 5.3 + 1.2%, respectively, for wetlands; (2) 4.8 + 0.8ø/6 and 4.6 + 2.0ø/6, respectively, for savanna; (3) 6.7 + 1.2% and 12.3 + 1.9ø/6, respectively, for b(nml forests. The values for b(nml forest fires,
which are more similar to the "Terra Firme" Amazon forest than the
17,882 CARVALHO ET AL.' BIOMASS FIRE CONSUMPTION AND CARBON RELEASE RATES
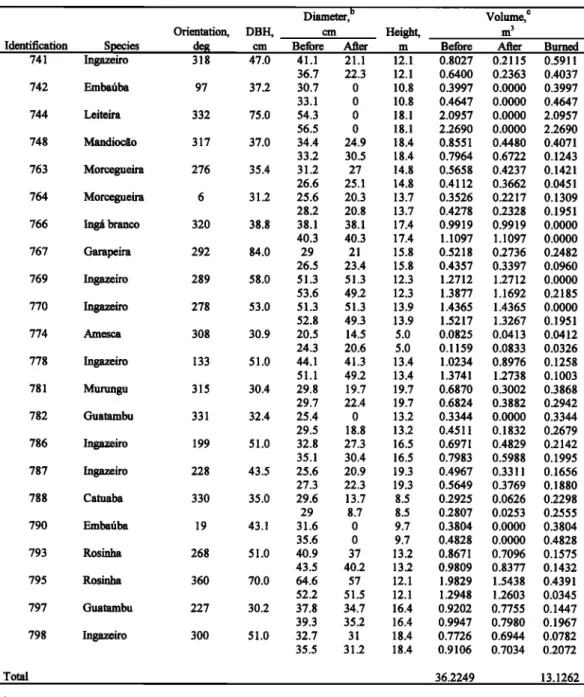
Table 8. Biomass Consumption of Logs With DBH > 30 crn in Plot D a
Diameter, b Volume, ½
Orientation, DBH, cm Height, m 3
Identification Species de• em Before After m Before After Burned
741 Ingazeiro 318 47.0 41.1 21.1 12.1 0.8027 0.2115 0.5911
36.7 22.3 12.1 0.6400 0.2363 0.4037 742 Embafiba 97 37.2 30.7 0 10.8 0.3997 0.0000 0.3997 33.1 0 10.8 0.4647 0.0000 0.4647
744 Leiteira 332 75.0 54.3 0 18.1 2.0957 0.0000 2.0957
56.5 0 18.1 2.2690 0.0000 2.2690
748 Mandioc•io 317 37.0 34.4 24.9 18.4 0.8551 0.4480 0.4071
33.2 30.5 18.4 0.7964 0.6722 0.1243
763 Morcegueira 276 35.4 31.2 27 14.8 0.5658 0.4237 0.1421
26.6 25.1 14.8 0.4112 0.3662 0.0451
764 Morcegueira 6 31.2 25.6 20.3 13.7 0.3526 0.2217 0.1309
28.2 20.8 13.7 0.4278 0.2328 0.1951
766 Ing,4 branco 320 38.8 38.1 38.1 17.4 0.9919 0.9919 0.0000
40.3 40.3 17.4 1.1097 1.1097 0.0000
767 Garapeira 292 84.0 29 21 15.8 0.5218 0.2736 0.2482
26.5 23.4 15.8 0.4357 0.3397 0.0960
769 Ingazeiro 289 58.0 51.3 51.3 12.3 1.2712 1.2712 0.0000
53.6 49.2 12.3 1.3877 1.1692 0.2185
770 Ingazeiro 278 53.0 51.3 51.3 13.9 1.4365 1.4365 0.0000
52.8 49.3 13.9 1.5217 1.3267 0.1951 774 Amesea 308 30.9 20.5 14.5 5.0 0.0825 0.0413 0.0412 24.3 20.6 5.0 0.1159 0.0833 0.0326
778 Ingazeiro 133 51.0 44.1 41.3 13.4 1.0234 0.8976 0.1258
51.1 49.2 13.4 1.3741 1.2738 0.1003
781 Murungu 315 30.4 29.8 19.7 19.7 0.6870 0.3002 0.3868
29.7 22.4 19.7 0.6824 0.3882 0.2942
782 Guatambu 331 32.4 25.4 0 13.2 0.3344 0.0000 0.3344
29.5 18.8 13.2 0.4511 0.1832 0.2679
786 Ingazeiro 199 51.0 32.8 27.3 16.5 0.6971 0.4829 0.2142
35.1 30.4 16.5 0.7983 0.5988 0.1995
787 Ingazeiro 228 43.5 25.6 20.9 19.3 0.4967 0.3311 0.1656
27.3 22.3 19.3 0.5649 0.3769 0.1880
788 Camaba 330 35.0 29.6 13.7 8.5 0.2925 0.0626 0.2298
29 8.7 8.5 0.2807 0.0253 0.2555
790 Embafba 19 43.1 31.6 0 9.7 0.3804 0.0000 0.3804
35.6 0 9.7 0.4828 0.0000 0.4828
793 Rosinha 268 51.0 40.9 37 13.2 0.8671 0.7096 0.1575
43.5 40.2 13.2 0.9809 0.8377 0.1432
795 Rosinha 360 70.0 64.6 57 12.1 1.9829 1.5438 0.4391
52.2 51.5 12.1 1.2948 1.2603 0.0345
797 Guatambu 227 30.2 37.8 34.7 16.4 0.9202 0.7755 0.1447
39.3 35.2 16.4 0.9947 0.7980 0.1967
798 Ingazeiro 300 51.0 32.7 31 18.4 0.7726 0.6944 0.0782
35.5 31.2 18.4 0.9106 0.7034 0.2072
Total 36.2249 13.1262
Efficiency
oflogs
with
DBH
> 30 cm
in plot
D is 36.2%
(= 13.1262/36.2249).
Diameter at wire location, two wires by log, at ¬ and •A length.
Volume corresponds to half height.
According to Instimto Nacional de Pesquisas Espaciais (INPE) (Monitoring of the Brazilian forest by satellite (1998 - 1999) data
available from World Wide Web server for INPE at
http'J/www.inpe. br/Informacoes-Eventos/amamnia. htm) the annual deforestation rate for the state ofMato Grosso was 6466 km 2
yr
'1 in the
period
from
mid 1997
to mid 1998.
This
represents
37.2% of the area deforestation of the entire Brazilian Amazonforest
(17,383
km
2 yr
'1)
in the
same
period.
Therefore,
assuming
as
an approximation that the reported deforested areas are burned in the forestland-clearing processes, Mato Grosso emission rates of C,CO2,
and
CO are
estimated
as
44.6
x 106
Mg yr
4, 147
x 106
Mg
yr
'1, and 10.3
x 106
Mg yr
'1, respectively.
These
values
may
overestimate the emissions, since INPE's deforestation data accountfor all types of vegetation in the state.
Considering again 97% as the average of Ward and Hardy's [1991] values, 3% of carbon is released to the atmosphere as
particles.
This
results
in an upper
limit of 1.34
x 106
Mg yr
4 of
particles for the state. In Alta Floresta most of the burnings occur from mid July until the end of August. Therefore
concentrating
the 1.34 x 10⁶ Mg over a 45-day
period
represents
29,800 Mg d '1 of particles
released
to the
CARV•HO ET AL.' BIOMASS FIRE CONSUMPTION AND CARBON KEL•SE RATES 17,883
5. Some Characteristics of the Combustion Process
Some details of fire spreading in several instances during the burn of plots D and E are presented in Figure 4. Fire was always ignited along the borders of the test areas. It is clearly observed that the fire propagated faster on the dryer area, cut in
1998, as expected. In the dryer area the main frontal flame reached 40 m, a height above that of the trees in the region.
The burning process is highly transient on a local scale, and the fire front propagates rapidly onto the dry biomass. Small-
size material, such as leaves and small branches, bum
completely if they are reached by fire, since radiation and convection heat transfer is larger for geometries having a larger
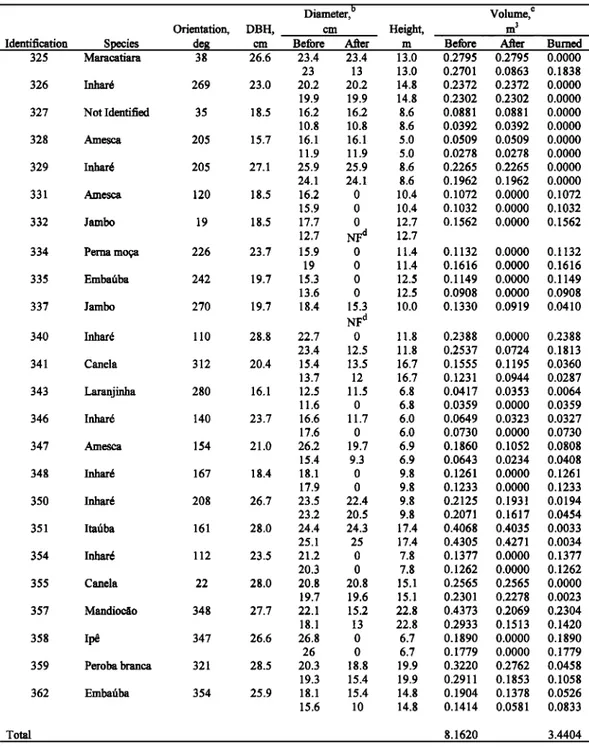
Table 9. Biomass Consumption of Logs With 10 cm < DBH < 30 cm in Plot E a
Diameter, b
Orientation, DBH, cm Height,
Identification Species deg cm Before After m
325 Maraeatiara 38 26.6 23.4 23.4 13.0 326 Inhar6 269 23.0
327 Not Identified 35 18.5
328 Amesca 205 15.7
329 Inhar6 205 27.1
331 Amesca 120 18.5
332 Jambo 19 18.5
334 Pema mo9a 226 23.7
335 Embafiba 242 19.7
337 Jambo 270 19.7 340 Inhar6 110 28.8 341 Canela 312 20.4
343 Laranjinha 280 16.1
346 Inhar6 140 23.7 347 Amesca 154 21.0 348 Inhar6 167 18.4 350 Inhar6 208 26.7
351 Itafiba 161 28.0
354 Inhar6 112 23.5
355 Canela 22 28.0
357 Mandiocfio 348 27.7
358 Ip• 347 26.6
359 Peroba branca 321 28.5
362 Embafiba 354 25.9
23 13 13.0 20.2 20.2 14.8 19.9 19.9 14.8 16.2 16.2 8.6 10.8 10.8 8.6 16.1 16.1 5.0 ll.9 ll.9 5.0 25.9 25.9 8.6 24.1 24.1 8.6 16.2 0 10.4 15.9 0 10.4 17.7 0 12.7
12.7 NF a 12.7
15.9 0 11.4 19 0 ll.4 15.3 0 12.5 13.6 0 12.5 18.4 15.3 10.0
NF a
22.7 0 ll.8 23.4 12.5 ll.8 15.4 13.5 16.7 13.7 12 16.7 12.5 11.5 6.8 ll.6 0 6.8 16.6 ll.7 6.0 17.6 0 6.0 26.2 19.7 6.9 15.4 9.3 6.9 18.1 0 9.8 17.9 0 9.8 23.5 22.4 9.8 23.2 20.5 9.8 24.4 24.3 17.4 25.1 25 17.4 21.2 0 7.8 20.3 0 7.8 20.8 20.8 15.1 19.7 19.6 15.1 22.1 15.2 22.8 18.1 13 22.8 26.8 0 6.7
26 0 6.7 20.3 18.8 19.9 19.3 15.4 19.9 18.1 15.4 14.8 15.6 l0 14.8
Volume, ½ m 3
Before After Burned
0.2795 0.2795 0.0000 0.2701 0.0863 0.1838 0.2372 0.2372 0.0000 0.2302 0.2302 0.0000 0.0881 0.0881 0.0000 0.0392 0.0392 0.0000 0.0509 0.0509 0.0000 0.0278 0.0278 0.0000 0.2265 0.2265 0.0000 0.1962 0.1962 0.0000 0.1072 0.0000 0.1072 0.1032 0.0000 0.1032 0.1562 0.0000 0.1562
0.1132 0.0000 0.1132 0.1616 0.0000 0.1616
0.1149 0.0000 0.1149
0.0908 0.0000 0.0908 0.1330 0.0919 0.0410
0.2388 0.0000 0.2388 0.2537 0.0724 0.1813 0.1555 0.1195 0.0360 0.1231 0.0944 0.0287 0.0417 0.0353 0.0064 0.0359 0.0000 0.0359 0.0649 0.0323 0.0327
0.0730 0.0000 0.0730
0.1860 0.1052 0.0808 0.0643 0.0234 0.0408 0.1261 0.0000 0.1261 0.1233 0.0000 0.1233 0.2125 0.1931 0.0194
0.2071 0.1617 0.0454 0.4068 0.4035 0.0033
0.4305 0.4271 0.0034 0.1377 0.0000 0.1377 0.1262 0.0000 0.1262 0.2565 0.2565 0.0000
0.2301 0.2278 0.0023
0.4373 0.2069 0.2304 0.2933 0.1513 0.1420
0.1890 0.0000 0.1890 0.1779 0.0000 0.1779
0.3220 0.2762 0.0458 0.2911 0.1853 0.1058 0.1904 0.1378 0.0526 0.1414 0.0581 0.0833
Total 8.1620 3.4404
Efficiency of logs with 10 cm < DBH < 30 cm in plot E is 42.2% (= 3.4404/8.1620). Diameter at wire location, two wires by log, at ¬ and •A length.
Volume corresponds to half height.
17,884 CAR.V•O ET AL.: BIOMASS FIRE CONSUMFrION AND CARBON RELEASE RATES
x,• •14:15•,
•14:28• •14:3•/
14:07
---•4:28
•__
•
14:•
14:07
• 14:34
14:08 •
AREA O sinshed lgg8
200 X 200 m:
CAIABI FARM -ALTA FLORESTA - MATO GRO•80 - AUG 21,1999
11:35 12:07
11:38
12:01 11:35
/ 1,11:4sI'11:471'11:,50f11:,531' 11:,58'",,.
AREA E sinshed 1009
200 X 200 m 2
TRAIL
CAIABI FARM -ALTA FLORESTA -MATO GRO880- AUG ?.4, 1999
Figure 4. Depiction of fire propagation in plots D and E.
supertidal area/volume ratio. We have observed that most of the logs and large branches, in general, bum only supertidally in exposed surfaces and sometimes only around their whole circumference. However, some tree species and rotten material, even of large size, can bum completely.
The amount of released gases increases drastically with the pyrolysis temperature and the biomass volatile content. Especially in plots A, B, and C, there was no significant thermal degradation (volatilization/pyrolysis) of the large-size material. Despite the strong radiation fi'om the flame fi'ont the exposition time is short, and below the supertidal layer, there is no significant drying/pyrolysis or ignition and, consequently, no flame propagation. It should be pointed out that the ignition temperature can be attained many times, but after an ignition ' interval, there can be no stable point where heat losses are smaller than reaction heats. Flame stabilization, in the homogeneous phase (gas phase) or in the heterogeneous phase (solid-gas interface), depends strongly on the ignition and extinction aspects of the flame in the wood. This explains why
many logs present only a supertidal burning and have an intact
core.
Smouldering is another important combustion mechanism during and after the flame fi'ont has crossed the burn site. Smouldering is characterized by combustion without flame and high emission rates of smoke due to the great quantity of unburned gases released by the thermal degradation of the biomass. These emissions are significantly related both to the safety of the fire fighters and the communities that live nearby the tires and to the local and global atmospheric chemistry. Emissions f•om smouldering combustion of biomass have been studied extensively in recent years [Cofer et al., 1990, 1996, 1998; Ferguson and Hardy, 1994; Mckenzie et al., 1995; Yokelson et al., 1997; Ferguson et al., 2000]. Emissions f•om smouldering combustion could be correlated to the low temperature and low heating rate of the biomass pyrolysis. However, the oxidative reaction zone through which the pyrolysis products flow, as they escape the hot substrate, may significantly alter the gas composition through processes such as tar cracking and partial oxidation of light hydrocarbons, for example. Emissions fi'om different smouldering fires were presented by Mckenzie et al. [1995]. The major condensable compounds were acetic acid and methanol. The results for the noncondensable gases were mainly CO and CO2, plus traces of
ethene, methane, and ethane.
The advance of a smouldering fi'ont is a complex mechanism in which many different processes are observed. At some distance fi'om the reacting solid surface (glowing surface) heat transfer provides energy for drying and thermal degradation of the biomass. Heat losses by convection and radiation to the surroundings are also important processes in the overall energy balance. The reactive surface needs an oxygen supply in order to be self sustaining Therefore mass transfer plays an important role in this combustion mechanism. The heterogene- ous reactions themselves are complex phenomena for which product formation is not very well quantified. To further complicate the process, gas phase reactions (homogeneous) may take place in the vicinity of the reacting surface, thus altering the composition of the gas that leaves the smoulder front, as well as consuming part of the oxygen that diffuses to the solid reaction zone. In practice, for some logs the process is not strictly heterogeneous since small flames are periodically observed near the glowing combustion of char. However, the release rate of volatiles fi'om the virgin wood is not high enough to allow formation of a stabilized homogeneous flame
near the solid surface; therefore, most of the volatiles are
released directly into the atmosphere mixed with heterogeneous combustion products.
CARVALHO ET AL.: BIOMASS FIKE CONSUMPTION AND CARBON RELEASE RATES 17,885
Table 10. Biomass
Consumption
of Logs
With DBH > 30 cm in Plot E a
Diameter, b Volume, ½
Orientation, DBH, em Height, m 3
Identification Species deg em Before ARer m Before After Burned
324 Maracatiara 238 32.4 25.4 24 14.9 0.3775 0.3370 0.0405 23.4 23.4 14.9 0.3204 0.3204 0.0000
330 Mandioc•o 148 35.5 24.7 24 20.2 0.4840 0.4569 0.0270
23.8 17.3 20.2 0.4493 0.2374 0.2119
333 Angelim 122 53.0 48 48 19.7 1.7824 1.7824 0.0000
45.6 44.9 19.7 1.6086 1.5596 0.0490 336 Leiteira branca 274 34.3 29.3 28 24.0 0.5394 0.4926 0.0468 20.3 20.3 24.0 0.2589 0.2589 0.0000 19.3 17.7 24.0 0.2340 0.1968 0.0372 338 Guatambu 79 38.8 27.5 21 13.1 0.3890 0.2269 0.1622 27.6 20 13.1 0.3919 0.2058 0.1861 339 Inhare 90 36.1 30.4 27 11.3 0.4101 0.3235 0.0866 33.5 32.3 11.3 0.4980 0.4630 0.0350 342 Embafiba 46 31.5 21.8 19.3 9.8 0.1829 0.1434 0.0395 18.4 13.4 9.8 0.1303 0.0691 0.0612
344 Ingazeiro 231 48.8 32.8 30.3 13.0 0.5492 0.4687 0.0805
25.2 20.5 13.0 0.3242 0.2145 0.1097 345 Leiteira branca 282 44.7 30.4 25 26.7 0.9690 0.6553 0.3137 30.7 22.4 26.7 0.9882 0.5261 0.4621 349 Maracatiara 226 34.9 29.3 25.5 14.1 0.4754 0.3600 0.1153 26.4 22 14.1 0.3859 0.2680 0.1179 352 Guatambu 182 34.0 28.9 17.3 6.9 0.2263 0.0811 0.1452
31.5 12.3 6.9 0.2689 0.0410 0.2279 353 Canela branca 70 32.1 26.8 24 14.1 0.3977 0.3189 0.0788 24.8 14.7 14.1 0.3406 0.1197 0.2209
356 Cajueiro 4 43.8 37.8 36.3 20.5 1.1503 1.0608 0.0895
31.2 29.3 20.5 0.7837 0.6911 0.0925 360 Maracatiara 38 37.2 38.2 33.4 12.5 0.7163 0.5476 0.1687
36 WB d 12.5 WB d WB d WB d
361 Inhar6 14 35.4 32.6 31 8.0 0.3339 0.3019 0.0320 23.7 0 8.0 0.1765 0.0000 0.1765 363 Inhar6 58 37.2 31.9 31.9 7.1 0.2845 0.2845 0.0000 28.8 28.8 7.1 0.2319 0.2319 0.0000 Total 16.6591 3.4142
Efficiency of logs with DBH > 30 cm in plot E is 20.5% (= 3.4142/16.6591 ).
Diameter at wire location, two wires by log, at ¬ and 3A length, except for number 336, which had three wires.
Volume corresponds to half height.
WB is wire broken.
Table 11. Comparison of Biomass Consumption Data of This Work in Alta Floresta
With Experiments Conducted in Manaus and Tom6 A9u
Experiment Brine, •15-10, •110-30, •1>30, •ltotal, Source
% % % % %
Tom6 Aqu, 1994, 83.4 61.0 6.3 2.3 21.9 Aratijo et al.
inside the forest a [ 1999]
Manaus, 1995, 88.5 86.8 4.39 0.43 20.5 Carvalho et al.
inside the forest a [1998]
Alta Floresta, 1997, 93.7 83.8 13.3 5.27 22.7 present work
frontier with a pasture a
Alta Floresta, 1997, 84.0 82.6 10.4 3.14 19.5 present work inside the forest a
Alta Floresta, 1998, 94.8 94.8 51.0 24.7 47.5 present work borders of 100 m a
Alta Floresta, 1999, 95.5 95.5 72.5 36.2 61.5 present work
borders of 50 m b
Alta Floresta, 1999, 93.6 93.6 42.2 20.5 41.8 present work borders of 50 m a
17,886 CARVALHO ET AL.: BIOMASS FIRE CONSUMPTION AND CARBON RELF. ASE RATES
part of the log; therefore heat losses are lowered, both through convection and radiation.
It seems that the self-sustained propagation wave reaches a stable point because of the intrinsically related processes of oxygen supply, heterogeneous combustion and heat losses to the substrate as well as to the surroundings. Extinction at a log that reached this stable point was not frequently observed. Conversely, almost all the logs subjected to smouldering com•i• burned completely without }ong periods of gas flame, except, as previously mentioned, in instances when oxygen supply was increased by wind effects and the log had an empty core throughout its length. The process can be explained as follows.
Higher oxygenation allows better penetration of the reaction zone into the porous structure. The temperature of the glowing surface is augmented with a subsequent increase in the production rate of CO. More carbon is then consumed, because of the stoichiometry, further increasing the reaction zone. The
heat release then diminishes - 3 times, on account of the lower
heat of reaction for the CO formation. As a consequence, the temperature of the reaction zone is lowered causing a shift to higher CO2 production and smaller penetration of the reaction zone, but with nearly the same overall heat release. Therefore the shift to flaming is not sustained, and the predominant mechanism of combustion is smouldering.
Smouldering has been observed mostly in rotten wood, in decomposing material that was naturally downed, or in dead material surrounded by another specimen. There seems to be no available data in the literature about smouldering in rotten or dead wood material in the form of larger logs from tropical forests.
The effects of smouldering were observed in the recent Roraima fire [Chambers et al., 1998], where low-intensity rain was enough to extinguish the main fire. Nevertheless, smouldering continued in many spots for several days.
It has also been observed that crossed logs are able to keep smouldering more frequently than isolated logs. This probably occurs because of the lower dissipation rate of heat in the erossing regions which act as flame holders, yielding better characteristics to sustain the combustion wave. The erossing surfaces burned more completely than the remaining log. Smouldering logs, however, do not contribute significantly to the overall biomass consumption.
6. Conclusion
The combustion characteristics of the biomass burning technique used in the process of forest clearing were investi- gated in five test plots of "Terra Firme" Amazon forest. The effects of the border widths, total clearing area sizes, and curing periods on the biomass consumption (or burned fraction) and on the amount of carbon release to the atmosphere were analyzed by measurements in 1-ha squares in the middle of the cleared areas.
Cleared areas with 1, 4, and 9 ha led to burned fractions of
about 21%, 41.8% and 47.5%, respectively, for curing periods of 3 months, while a clearing area of 4 ha with a curing period of 15 months presented a burned fraction of 61.5%. Carbon
release
to the atmosphere
was
estimated
as 69 Mg ha
4 for an
estimated biomass consumption of 50%.
Acknowledgments. Support of this research is acknowledged to the following institutions: Fundado de Amparo/t Pesquisa do Estado de S•io
Paulo (FAPESP), Brazil (projects 96/11742-0 and 98/00104-9), USDA Forest Service (project PNW 99-5147-1-CA), U.S. Agency for International Development, and U.S. National Science Foundation. The authors also thank the owners of Caiabi Farm, the Riva family of Alta Floresta, and the farm manager, Antonio Costa Correia.
References
Arafijo, T.M., J.A. Carvalho, N. Higuchi, A.C.P. Brasil Jr., and A.L.A. Mesquita, A Tropical Rainforest Clearing Experiment by Biomass Burning in the State of Pafft, Brazil, Atmos. Environ., 33, 1991-1998,
1999.
Blake, N.J., D.R. Blake, B.C. Sive, T.Y. Chen, F.S. Rowland, J.œ. Collins,
G.W. Sachse, and B.E. Anderson, Biomass burning emissions and vertical distribution of atomospheric methyl halides and other reduced carbon gases in the South Atlantic region, J. Geophys. Res., 101(D19),
24,151-24,164, 1996.
Braga, P.I.S., Subdivi•o fitogeogr•fica, tipos de vegeta•o, eonserva•io e inventSrio fioristieo da Floresta Amaz6nica, Acta Amazonica, 9(4), 53-
80, 1979.
Brown, I.F., Handbook for inventorying downed woody material, USDA For. Serv. Gen. Tech Rep. INT-16, 24 pp., U.S. Dept. of Agric., Washington, D.C., 1974.
Brown, I.F., D.C. Nepstad, I.O. Pires, L.M. Luz, and A.S. Alechandre, Carbon storage and land-use in extractive reserves, Acre, Brazil,
Environ. Conscry., 19, 307-315, 1992.
Brown, I.F., L.A. Martinelli, W.W. Thomas, M.Z. Moreira, C.A.C.
Ferreira, and R.L. Victoria, Uncertainty in the biomass of Amazonian forests: An example fi'om Rond6nia, Brazil, For. Ecol. Manage., 75,
175-189, 1995.
Carvalho, J.A., J.M. Santos, J.C. Santos, M.M. Lei•o, and N. Higuchi, A tropical rainforest clearing experiment by biomass burning in the Manaus region, Atmos. Environ., 29, 2301-2309, 1995.
Carvalho, J.A., N. Higuchi, T.M. Arafijo, and J.C. Santos, Combustion completeness in a rainforest clearing experiment in Manaus, Brazil, J. Geophys. Res., 103(D11), 13,195-13,200, 1998.
Chambers, J.Q., N. Higuchi and J.P. Schimel, Ancient trees in Amazonia, Nature, 391,135-136, 1998.
Cofer, W.R., J.S. Levine, E.L. Winstead, and B.J. Stocks, Gaseous emissions from Canadian boreal forest fires, Atmos. Environ., Part A, 24, 1653-1659, 1990.
Cofer, W.R., J.S. Levine, E.L. Winstead, D.R. Cahoon, D.I. Sebacher, J.P.
Pinto, and B.J. Stocks, Source composition of trace gases released during Afi'i• savanna fires, J. Geophys. Res., IOI(D19), 23,597-
23,602, 1996.
Cofer, W.R., E.L. Winstead, B.J. Stocks, J.G. Goldammer, and D. R. Cahoon, Crown fire emissions of CO2, CO, H2, CI-h, and TNMHC
•om a dense jack pine boreal forest fire, Geophys. Res. Lea., 25(21),
3919-3922, 1998.
Crutzen, P.J., and M.O. Andreae, Biomass burning in the tropics: Impact on atmospheric chemistry and biochemical cycles, Science, 250, 1669-
1678, 1990.
Cunha, R.P., Deforestation estimates through remote sensing: The state of the art in the Legal Amazonia, paper presented at Meeting Amazbnia: Facts, Problems and Solutions, Univ. de S•io Paulo, S•io Paulo, Brazil,
1989.
Fearnside, P.M., Greenhouse gas emissions from deforestation in the
Brazilian Amazon, in Carbon Emissions and Sequestration in
Forests: Case Studies from Developing Countries. Volume 2. LBL- 32758, UC-402. Climate Change Division, Environmental Protection Agency, Washington, DC, and Energy Environment Division, Law- renee Berkeley Laboratory (LBL), University of California (UC), Berkeley, California, 73 pp., 1992.
Fearnside, P.M., Global warming and tropical land-use change: greenhouse gas emissions from biomass bumhag, decomposition and soils in forest conversion, shifting cultivation and secondary vegetation, Clim. Change, 46, 115-158, 2000.
Fearnside, P.M., N. Leal Jr., and F.M. Fernandes, Rainforest burning and the global carbon budget: Biomass, combustion efficiency, and charcoal
formation in the Brazilian Amazon, J. Geophys. Res., 98(9), 16,733-
16,743, 1993.