www.atmos-chem-phys.net/14/2479/2014/ doi:10.5194/acp-14-2479-2014
© Author(s) 2014. CC Attribution 3.0 License.
Atmospheric
Chemistry
and Physics
High-resolution (375 m) cloud microstructure as seen from the
NPP/VIIRS satellite imager
D. Rosenfeld1, G. Liu2, X. Yu2, Y. Zhu2, J. Dai2, X. Xu2, and Z. Yue3
1Institute of Earth Sciences, The Hebrew University of Jerusalem, Israel 2Meteorological Institute of Shaanxi Province, Xi’an 710015, China 3Center of Weather Modification of Shaanxi Province, Xi’an 710015, China
Correspondence to:D. Rosenfeld ([email protected])
Received: 13 September 2013 – Published in Atmos. Chem. Phys. Discuss.: 13 November 2013 Revised: 20 January 2014 – Accepted: 30 January 2014 – Published: 10 March 2014
Abstract. VIIRS (Visible Infrared Imaging Radiometer
Suite), onboard the Suomi NPP (National Polar-orbiting Partnership) satellite, has an improved resolution of 750 m with respect to the 1000 m of the Moderate Resolution Imag-ing Spectroradiometer for the channels that allow retrievImag-ing cloud microphysical parameters such as cloud drop effective radius (re). VIIRS also has an imager with five channels of double resolution of 375 m, which was not designed for re-trieving cloud products. A methodology for a high-resolution retrieval of re and microphysical presentation of the cloud field based on the VIIRS imager was developed and evalu-ated with respect to MODIS in this study. The tripled mi-crophysical resolution with respect to MODIS allows obtain-ing new insights for cloud–aerosol interactions, especially at the smallest cloud scales, because the VIIRS imager can resolve the small convective elements that are sub-pixel for MODIS cloud products. Examples are given for new insights into ship tracks in marine stratocumulus, pollution tracks from point and diffused sources in stratocumulus and cu-mulus clouds over land, deep tropical convection in pristine air mass over ocean and land, tropical clouds that develop in smoke from forest fires and in heavy pollution haze over densely populated regions in southeastern Asia, and for pyro-cumulonimbus clouds.
It is found that the VIIRS imager provides more robust physical interpretation and refined information for cloud and aerosol microphysics as compared to MODIS, especially in the initial stage of cloud formation. VIIRS is found to iden-tify significantly more fully cloudy pixels when small bound-ary layer convective elements are present. This, in turn,
al-lows for a better quantification of cloud–aerosol interactions and impacts on precipitation-forming processes.
1 Introduction
The Suomi NPP (National Polar-orbiting Partnership) launched on 28 October 2011 inaugurated a new generation of operational US polar-orbiting satellites. Its primary imag-ing instrument is VIIRS (Visible Infrared Imagimag-ing Radiome-ter Suite). This study shows benefits of the added spatial resolution of the VIIRS imager with respect to the Moder-ate Resolution Imaging Spectroradiometer (MODIS). VIIRS has 22 visible–infrared channels that combine many of the best aspects of the NOAA Advanced Very High Resolution Radiometer (AVHRR), the Defense Meteorological Satellite Program (DMSP) Operational Linescan System (OLS), and the National Aeronautics and Space Administration (NASA) MODIS. VIIRS provides highly detailed imagery of global coverage, with multi-band imaging capabilities that support the acquisition of high-resolution atmospheric imagery for a variety of applications, including detection of cloud prop-erties, fires, smoke, and atmospheric aerosols1. The sensor data records (SDRs) of VIIRS are composed of 5 bands of imagery resolution (375 m) and 17 bands of moderate resolution (750 m), and have been made publicly available since 2 July 2012 via the NOAA’s Comprehensive Large Array-data Stewardship System (CLASS)2. In addition to the improved spatial resolution at nadir, the VIIRS footprint
VIIRS
MODIS
A
B
1
2 3 4
5
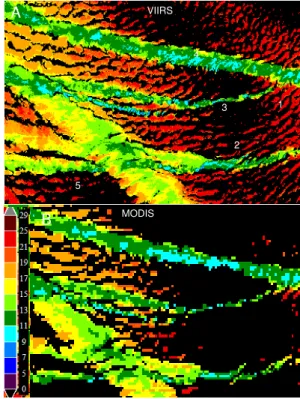
Fig. 1. Microphysical RGB composite imagery of ship tracks, as seen by VIIRS (22:20 UT, panel A) and MODIS (22:40 UT, panelB) overpasses on 15 July 2012 over the northeastern Pacific in an area of 174 km×107 km centered at 40.55◦N, 140.09◦W. The images show the same area and are scaled to show the full resolu-tion of 375 m of the VIIRS imager. This results in a blurred picture of the ship track in the MODIS image due to its lower resolution of 1000 m.
at the cross-track dimension is kept nearly constant, even though the width of the swath is increased to overlap even at the Equator between consecutive orbits, thus providing full global coverage twice daily.
Many environmental data records (EDRs) have already been derived and further ones are being developed and tested now, including sea surface temperature, cloud properties, ocean color, aerosol characteristics, etc. The EDRs of these and other products have recently reached the “beta” stage of maturity and are on their way to further levels of quality con-trol (Hillger et al., 2013).
Unlike the 1 km resolution of the infrared (IR) channels of MODIS and AVHRR, VIIRS has 375 m of spatial res-olution in the IR imager bands, which represents a signif-icant improvement over previous instruments. The benefit of the higher resolution becomes most evident when view-ing the tops of small-scale features in the thermal channels. For example, smaller boundary layer clouds can be resolved by VIIRS as compared to MODIS or AVHRR, whose foot-print area is 7 times larger than the NPP imager. Due to the improved resolution, smaller scale cloud tops can also be resolved with corresponding colder top temperatures as compared to lower resolution sensors. Hillger et al. (2013)
1
2 3 4
5
VIIRS
MODIS A
B
Fig. 2. VIIRS and MODIS retrievedre for the clouds shown in Fig. 1. Only clouds with 0.6 µm solar reflectance > 0.3 are analyzed.
showed that the coldest brightness temperature of a convec-tive complex from GOES, MODIS, and VIIRS within a 2 min time difference was−79.7◦C,−86.9◦C, and−90.6◦C,
re-spectively. They postulated the differences were due in part to the smaller pixel sizes of the instruments with better resolution, with VIIRS providing the most accurate esti-mate of the actual emitting temperature of the thunderstorm overshooting tops. Brunner et al. (2007) also tested the ef-fect of different resolutions on the temperature observed by AVHRR, and suggested that the observed minimum temper-ature of an overshooting top would be 11 K warmer for the 8 km sampled distance than for the 1 km sampled distance.
Focusing attention on cloud products, during the last 20 yr, the technology of visible and IR satellite retrieval has been applied to retrieve cloud drop effective radius (re), liquid wa-ter path (LWP), cloud optical depth (COD), cloud-top tem-perature (T), and thermodynamic phase (ice, mixed phase, or water). In addition, cloud drop number concentration (Nc) has been retrieved for marine layer clouds (e.g., Platnick et al., 2003).
Rosenfeld and Lensky (1998) used the retrieved T and
1 2
3 4
20120606 0356 VIIRS
MODIS
A
D
B
C
E
F
5
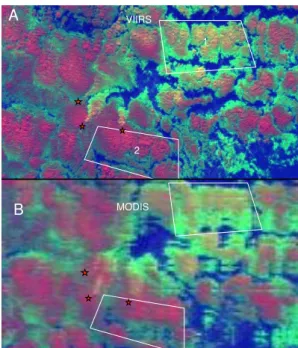
Fig. 3.Same as Fig. 1, but showing a pollution track from a coal power plant in Australia, as seen by VIIRS (03:56 UT, panelA) and MODIS (04:05 UT, panelD) overpasses on 6 June 2012, in an area of 163 km×154 km centered at 32.88◦S, 149.20◦E. The red stars show the origination points of a pollution track and a plume of smoky clouds from a small hot spot. These two features are magnified to VIIRS full resolution in panel(B)in an area of 54 km×58 km centered at 33.17◦S, 149.90◦E and(C)in an area of 20 km×18 km centered at 32.27◦S, 149.43◦E, respectively. The same magnification is applied to the MODIS image in panels(E) and(F).
TheT is given by the 10.8 µm brightness temperature, and there is approximated by the 3.7 µm solar reflectance com-ponent. The red is modulated by the visible reflectance. The qualitative approach was also applied to the geostationary satellite. With the rich spectral information of the SEVIRI instrument on the METEOSAT Second Generation (MSG) satellite, Lensky and Rosenfeld (2008) developed five RGB combinations to represent the additional information on mi-crophysics of clouds in relation to the environmental and me-teorological elements.
Furthermore, Rosenfeld and Lensky (1998) introduced a quantitative methodology for inferring precipitation-forming processes using vertical profiles of the effective radius of cloud particles, obtained by analyzing theT–re relations of convective clusters. Generally, the cloud drops nucleate near the convective cloud base, and gradually grow with height. Therefore, the cloudy pixels with the smallestreand highest
T define the cloud base. Because the coalescence rate is pro-portional tore5, the growth ofrewith decreasingT higher in the cloud above∼14 µm indicates initiation of rain (Freud and Rosenfeld, 2012). This methodology was also applied to other polar orbit satellite platforms. The underlying
assump-Fig. 4.An aerial view of two coal power plants at the location of the origin of the pollution track (33.38◦S, 150.05◦E) that is shown in Fig. 3. The power plants are 7 km apart from each other.
tion of the method is that time and space are exchangeable, so the composition of the tops of various clouds reaching dif-ferent heights in a convective cluster at a given time is sim-ilar to the time evolution of a cloud-top composition as it grows up with time. This assumption was validated by track-ing the tops of growtrack-ing clouds by rapid scans of a geostation-ary satellite (Lensky and Rosenfeld, 2006).
By virtue of the quantitative approaches from the satellite retrieval, a large number of applications can be gained by the retrieved microphysical properties, which are applied to
– detection of aircraft icing conditions (Schickel et al., 1994; Thompson et al., 1997);
– detection of fog or low clouds (d’Entremont and Thomason, 1987; Bendix et al., 2005);
– estimation of precipitation (Lensky and Rosenfeld, 1997; Rosenfeld and lensky, 1998);
– detection of severe convective storms (Rosenfeld et al., 2008; Lindsey et al., 2006), detection of the impacts of air heavy smoke (Rosenfeld et al., 2007), pollution (Rosenfeld et al., 2012a), dust (Rosenfeld et al., 2001), and salt (Rosenfeld et al., 2002; Rudich et al., 2002) on the precipitation-forming processes (Rosenfeld, 1999, 2000; Rosenfeld et al., 2012b);
– detection of glaciation temperature of clouds (Rosen-feld et al., 2011);
0 5 10 15 20 25 30 35 40 -10
-5
0
5
re50-1
re50-2
re50-3 re50-4
Effective Radius (m)
Glaciation Temperature (°C)
VIIRS
A
0 5 10 15 20 25 30 35 40 -10
-5
0
5
re50-1
re50-2
re50-3 re50-4
Effective Radius (m)
Glaciation Temperature (°C)
MODIS
B
Fig. 5.TheT–rerelations of the areas shown in Fig. 3 and denoted by white numbers, for VIIRS and MODIS. The medianrefor any givenT is shown. There values in the pollution tracks are much smaller than for the background clouds and are similar for both sen-sors. Note that VIIRS shows thatT for the clouds with retrieved
reranges between−1 and−5◦C, whereas MODIS misses some of the warmest and coldest cloudy points because they are averaged out by the lower resolution.
The higher resolution data from VIIRS can supply more information and depict more detailed structure of cloud and precipitation than the previous lower resolution. Thus, the purpose of this paper is to highlight the microphysical re-trievals obtained from VIIRS data and their application in the understanding of microphysical properties and cloud and precipitation formation processes while exploiting the unique capabilities the higher resolution offers. However, the stan-dard EDR cloud products are limited to the lower VIIRS resolution of 750 m. Therefore, the first part of this study is devoted to the retrieval of a cloud mask and re from the 375 m imagery channels. In the following section, the method of calibration and correction of the VIIRS imager with respect to the moderate-resolution channels will be briefly given. Examples of the VIIRS-added insights that can be gained with respect to cloud composition, precipitation-forming processes and their interaction with aerosols will be
1
2 VIIRS
MODIS A
B
Fig. 6. Same as Fig. 1, but showing the three pollution point sources over the three coal power plants in the La Trobe Val-ley, Australia, as seen by VIIRS (04:07 UT, panelA) and MODIS (04:40 UT, panel B) overpasses on 29 April 2012, in an area of 170 km×116 km centered at 38.04◦S, 146.69◦E. The red stars are positioned below the pollution point sources, which their aerial pho-tos are shown in Fig. 7. The pollution tracks spread northward with the southerly low-level wind and merge to the northeast and form a homogeneously polluted region that includes rectangle 1. The pol-luted clouds spread eastward with the westerly wind at the clouds altitude. The background clouds to the south include rectangle 2.
given and compared to MODIS are provided in Sect. 3. The summary and discussion will be given in the final section.
2 Using the imager for retrieving cloud drop effective
radius
The VIIRS spectral bands exist in two resolutions: moderate (750 m) and imagery (375 m) at nadir. The imagery channels are available in five bands centered at 0.64, 0.865, 1.61, 3.74 and 11.5 µm (I1 to I5 bands). The radiative accuracy of the imager is lower than the moderate resolution, but still suffi-cient for retrieving cloud properties. The temperature mea-suring accuracy (NE1T) at 210 K of the 11.5 µm imager band is 0.8 K. The NE1T at 270 K of the 3.74 µm imager band is 0.49 K. However, in order to realize the greater accu-racy of the moderate resolution, the brightness temperatures of imagery data are calibrated against the moderate resolu-tion for each analyzed scene. This process is described in Sect. 2.1.
Yallourn Loy Yang
Yallourn Hazelwood
SE Australia
Hazelwood Loy Yang
Fig. 7.The locations and aerial photos of the three coal power plants in the La Trobe Valley, Australia. The stars mark the base of the chimneys in the three zoomed-in photos. The power genera-tion capacity is 1450 MW for Yallourn, 1600 MW for Hazelwood, and 3250 MW for Loy Yang.
1
2 VIIRS
MODIS A
B
1
2
Fig. 8.VIIRS and MODIS retrieved effective radius for the clouds shown in Fig. 6. Only clouds with 0.6 µm solar reflectance > 0.4 are analyzed.
the 10.8 µm and 12.0 µm bands (M15 and M16). However, the retrieval ofT andrerequires the usage of the brightness temperature difference (BTD) between the bands of M11 and M12, which are not available separately for the imagery res-olution. These bands are used for detection of optically thin clouds and for correcting T for the water vapor. Instead, it is necessary to use the BTD of the moderate resolution (BTDm=Tm11−Tm12). In order to obtain the BTD in
im-0 5 10 15 20 25 30 35 40 -10
-5
0
5
re50-1 re50-2
Effective Radius (m)
Glaciation Temperature (°C)
VIIRS
A
0 5 10 15 20 25 30 35 40 -10
-5
0
5
re50-1 re50-2
Effective Radius (m)
Glaciation Temperature (°C)
MODIS
B
Fig. 9.Same as Fig. 5, but for the polluted area over the La Trobe Valley, Australia, on 29 April 2012. Line 1 (red) shows the polluted clouds with small drops that reside in rectangle 1 of Fig. 6; line 2 (blue) shows the background clouds with the larger drops that reside in rectangle 2 of Fig. 6.
agery resolution (BTDh), it is necessary to find out an ap-propriate method to get this quantity from the corresponding moderate resolution.
1 VIIRS
MODIS
A
B
20120605 18:10
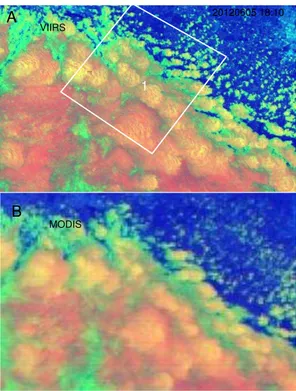
Fig. 10.Same as Fig. 1, but showing the regionally polluted clouds over the region of Buffalo, NY, USA, and to the south of Lake On-tario, as seen by VIIRS (18:10 UT, panelA) and MODIS (18:30 UT, panelB) overpasses on 5 June 2012, in an area of 160 km×113 km centered at 42.74◦N, 78.55◦W.
land, or 0.3 over ocean, and hence greatly simplify the re-trieval procedure for such clouds.
A complicating factor in retrievingrebased on the 3.7 µm solar reflectance is the need to separate the solar reflectance and thermal emission components at that wavelength. The solar reflectance has to be calculated from the total measured radiation after subtracting the thermal emission, which is a function of the temperature of the cloud top emitting the radi-ation,T. Therefore, determiningT at the imagery resolution is necessary. The procedures for obtaining this are described in Sect. 2.2.
2.1 Dynamic calibration of 3.74 and 11.45 µm imagery
resolution data
For all pixels within a selected analysis area of 512×512 window of the imagery bands, the overlapping 256×256 moderate-resolution pixels are expanded to the correspond-ing 512×512 pixels by the method of the nearest value sam-pling. The brightness temperature of cloudy pixels of the 3.74 µm imagery (T3.7h)bands are regressed linearly to that from fully cloudy pixels of the moderate resolution (T3.7m), and the regression parameters are applied to calibrateT3.7hto
T3.7m.
The available product of VIIRS Cloud Mask was insuffi-cient for the objectives of calculating valid effective radius
1 VIIRS
MODIS A
B
20120605 18:10
Fig. 11.VIIRS and MODIS retrievedre for the clouds shown in Fig. 10. Only clouds with 0.6 µm solar reflectance > 0.4 are ana-lyzed.
from the imager without significant surface contamination. Instead, a cloud mask for the moderate resolution is identi-fied as those pixels having a visible reflectance greater than a set threshold (usually 0.40) and the1T11h< 1. The1T11his the homogeneity parameter of 11.45 µm brightness tempera-ture (T11h). It can be written as
1T11h= 1 4
4 X
i=1
||T11hi−T11h||,
whereT11h is the brightness temperature of every four pix-els in the imagery that reside within one moderate-resolution pixel, and T11hi is their average, based on the average of absolute deviation from the meanT11h within four imagery resolution pixels that reside within one moderate-resolution pixel. If1T11h is greater than the given threshold, a cloud edge is determined.
The same recalibration processing is carried out for pixels between the 11.45 µm at the imagery resolution and the mod-erate resolution (M15) that they reside in. The regression pa-rameters are applied toT11h so that it is forced to equal on average toT11m.
2.2 Difference of brightness temperature of cloudy
pixels for imagery resolution
0 5 10 15 20 25 30 35 40 -10
-5
0
5
re15
re50
re85
Effective Radius (m)
Glaciation Temperature (°C)
VIIRS
A
0 5 10 15 20 25 30 35 40 -10
-5
0
5
re15
re50
re85
Effective Radius (m)
Glaciation Temperature (°C)
MODIS
B
Fig. 12. Same as Fig. 5, but for the regionally polluted area over Buffalo, NY, USA, and to the south of Lake Ontario, on 5 June 2012. TheT–re lines are plotted for the rectangles shown in Fig. 10. The red line shows the medianrefor any givenT, and the broken lines show the 15th and 85th percentiles, as indication for the spread ofrefor a givenT.
P of1T11h< 1 is considered as the cloud-base temperature (Tcb). The value ofP =30 % was experimentally found to match the cloud-base temperature best as inferred by ra-diosondes. An additional algorithm for finding a more exact cloud-base temperature is now under development, and the results will be reported separately.
The BTD of thick clouds should decrease monotonically for colder cloud tops, because the remaining vapor above the tops decreases. The value of BTD increases at colder cloud-top temperatures only if the clouds become thinner, so that more radiation is upwelling through the cloud atT11mthan at
T12m(Inoue, 1987). Therefore, in order to correct the cloud-top temperature for vapor, the following algorithm is applied: The imagery BTD is calculated as the recalibrated
T11h−T12m. The first quartile of the BTD for a givenT11h is calculated as BTD4. The BTD is used for water vapor tem-perature correction. However, the appearance of a thin layer cloud above the object, for which corrected temperature due to water vapor is sought, will add to the BTD and will there-fore cause an overestimated BTD vapor temperature
correc-tion. A preventive measure against this possibility is calcu-lating BTDmin, which is calculated by allowing BTD4to de-crease monotonically or remain unchanged with decreasing
T11h, or remain unchanged if BTD4increases for lowerT11h, starting fromTcb until the lowest T11h. The monotonic de-crease is enforced because any inde-crease in BTD4 with de-creasingT11hcan be caused only by overlying semitranspar-ent clouds. IfT11h>Tcb, the pixel is regarded as cloud-free, and its BTD is assigned to BTDm.
The surface temperature is calculated byT11m,T12mand the solar zenith angle using the formulation of Sullivan et al. (1993). For calculating cloud surface temperature, the
T11h and BTD4are used instead. Cloud surface temperature is considered invalid for calculatingreif BTDm> BTDminby more than a user-defined value (usually 1◦C), indicating that
the cloud is optically thin or under semitransparent clouds.
2.3 Retrieval of effective radius
Based on the radiation transfer model (Nakajima and King, 1990), a look-up table is established for effective radius of water cloud drop. By using the retrieved reflectance at 3.7 µm and geographical data supplied by the satellite,reis obtained via the method used by Rosenfeld and Lensky (1998). The
re is calculated based on the 3.7h recalibrated to the 3.7m channel, the calculated cloud surface temperature, the satel-lite, solar azimuth and zenith angles, and the seasonal depen-dence of the Sun–Earth distance.
After this processing of VIIRS data, the surface temper-ature, the BTD and re for the imagery resolution can be used in the microphysical retrieval of satellite data, and
T–re relations are constructed as done by Rosenfeld and Lensky (1998).
3 Contrast of cloud properties reflected by VIIRS and
MODIS
3 1
2
20130505 0509
22 VIIRS
Microphysical RGB
A
B
VIIRS Solar RGB
3 1
2
Fig. 13.Imagery of VIIRS overpass on 5 May 2013 05:09 UT over Manila, the Philippines. Panel(A)shows the microphysical RGB, and panel(B)shows the solar RGB, where the RGB components are modulated by the 0.8, 1.6, and 3.7 µm solar reflectance, respectively. Panel(B)is given for a better geographic orientation while keeping some of the microphysical sensitivity in the colors of the clouds. The bright blue is the urban area. The clouds are moving from east to west (right to left). Note that in panel(A)the contrast between the clouds with small drops over the city (area 1) and the background clouds with large drops, as indicated by their reddish color. The ar-eas of panels(A)and(B)are the same as 157 km×122 km centered at 14.43◦N, 121.13◦E.
the VIIRS imager also affords an ability to resolve the im-pacts of local aerosol emissions such as power plants, ship stacks, vegetation fires, urban areas, dust storms, and changes in land use.
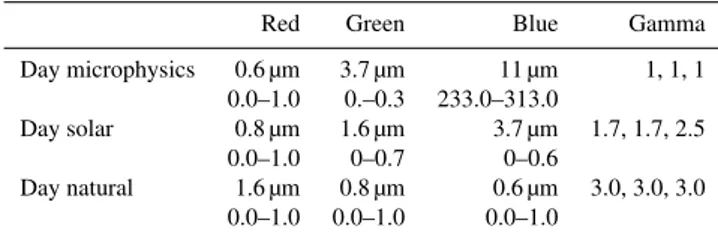
In accordance with this objective, several cases are pro-vided to give a vivid demonstration of the improvement in the detection capability of the impacts of aerosol on cloud properties that are observed by VIIRS and MODIS. The examples include ship tracks, pollution tracks in conti-nental stratocumulus, city or industrial pollution signatures, and tropical convection in pristine and polluted clouds and pyro-cumulonimbus (pyro-Cb). The cases were selected for the most similar satellite views (overpass time and satellite zenith angle) as possible. The images are presented with several red–green–blue (RGB) compositions, as defined in Rosenfeld and Lensky (1998). These compositions are de-fined in Table 1.
0 5 10 15 20 25 30 35 40 -5
0 5 10 15 20 25
re50-1
re50-2
re50-3
Effective Radius (m)
Glaciation Temperature (°C)
VIIRS
A
0 5 10 15 20 25 30 35 40 -5
0 5 10 15 20 25
re50-1
re50-2
re50-3
Effective Radius (m)
Glaciation Temperature (°C)
MODIS
B
Fig. 14.Same as Fig. 5, but for the contrasting conditions between the polluted clouds over Manila (line 1) and the pristine background clouds (lines 2 and 3), as shown for VIIRS in Fig. 13. The MODIS image is not shown. Note the less noisy and smootherT–rerelations for VIIRS as compared to MODIS.
Table 1.RGB compositions of microphysics, solar, and “natural color” schemes.
Red Green Blue Gamma
Day microphysics 0.6 µm 3.7 µm 11 µm 1, 1, 1 0.0–1.0 0.–0.3 233.0–313.0
Day solar 0.8 µm 1.6 µm 3.7 µm 1.7, 1.7, 2.5 0.0–1.0 0–0.7 0–0.6
Day natural 1.6 µm 0.8 µm 0.6 µm 3.0, 3.0, 3.0 0.0–1.0 0.0–1.0 0.0–1.0
20 4 5 1
2
3
4 5 1
2
3 VIIRS
Microphysical RGB
A
B
VIIRS Solar RGB
2012-07-19 19:22 UT
Fig. 15. Imagery of VIIRS overpass on 19 July 2012 19:22 UT over Houston, Texas. Panel(A)shows the microphysical RGB, and panel(B)shows the solar RGB. Note the much brighter (i.e., with smallerre)clouds over the urban area compared to its surround-ings. The urban area appears as the bright blue in both panels. The wind direction is from south to north (bottom to top of the image). The areas of panels(A)and(B)are the same as 198 km×135 km centered at 29.76◦N, 95.43◦W.
3.1 Ship tracks
Ship tracks represent the best natural laboratory for observ-ing the localized impacts of point source pollution aerosols. Figure 1 shows the microphysical RGB composite imagery of ship tracks in the northeastern Pacific Ocean. Panels a and b show the VIIRS and MODIS images for the same area within overpasses that are 20 min apart and differ in satel-lite zenith angle by 3◦. The MODIS image covers the same area as the NPP, and the higher resolution of VIIRS is evident (Hillger et al., 2013). Here attention is focused on the added information content for understanding cloud processes. This can be done best on ship tracks that occur in such marine stratocumulus, because the cloud-top temperatures were very near 12◦C for the clouds both in and out of the ship tracks. Therevalues of the track retrieved by VIIRS and MODIS are nearly the same, with lowest values of about 10 µm, as shown in Fig. 2. For the clouds near the track, thereis around 20 µm. The flat cloud tops allowed for the effect of the ship-emitted aerosols to be resolved without the need to useT–re rela-tions. There of the track is considerably different from the background clouds, in line with many previous observations (Radke et al., 1989; Coakley et al., 1987; Ferek et al., 2000).
2 1
3
2012-05-11 17:24 UT
VIIRS
Microphysical RGB
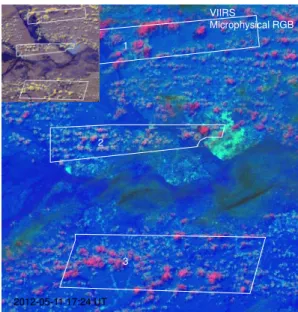
Fig. 16.Imagery of VIIRS overpass on 11 May 2012 17:24 UT over Manaus in the Amazon rainforest for an area of 146 km×133 km centered at 3.19◦S, 60.29◦W. The color scheme is microphysical RGB. The inset in the upper left is the same area in solar RGB that better shows the surface features and the Amazon River. The city of Manaus can be seen as the bright blue area at the right edge of area 2, which marks the plume of polluted clouds, which move from east to west (right to left). The pristine background clouds are shown in areas 1 and 3.
Comparing the MODIS and VIIRS images shows that all ship tracks are evident in both images. However, details of their internal structure are more resolved by the VIIRS im-ager, while not discerned well by the MODIS. The details that can be resolved by VIIRS but lost in MODIS in this im-age are as follows:
– The head of the ship tracks are formed by very small individual clouds with much-reducedre, as evident by the much brighter color, that grow both through the background clouds (point 1 in Fig. 1a) and in the gaps between the background clouds (point 2). MODIS only shows a faint line as the head of the ship track.
– The young, thin ship tracks in this case fill the gaps between the background clouds (point 3), but because the gaps between the clouds are barely resolved by MODIS, this filling is not so evident by MODIS ob-served ship track.
– An older and wider ship track (point 4) appears as a divergent pattern of the cloud tops in VIIRS that ap-pears to be involved in the mechanism of widening of the ship track. The microphysical texture of the ship track is, however, not resolved by MODIS.
microphysical relations between the two. The younger ship track can be discerned superimposed on the dis-turbance that the old ship track has caused to the lo-cal flow and cloud microstructure as a wavy path of reducedre, as discerned by its brighter color. This re-lation is much less evident in the MODIS image.
– Thereis retrieved for smaller clouds in VIIRS than for MODIS, because these smaller clouds fill the footprint of the VIIRS imager, but not of MODIS. This is ev-ident in the background broken clouds, especially on the right side of Fig. 2.
3.2 Pollution track
The closest phenomenon to ship tracks over land is tion tracks from stacks of coal power plants and other pollu-tion point sources. The ability of the VIIRS imager to detect such a pollution track is shown in this case. A pollution track caused by a coal power plant in Australia was clearly de-tected by both VIIRS and MODIS (see Fig. 3). In fact, look-ing at origination coordinates of the head of the pollution track (shown in Fig. 3 with a red star) with Google Earth re-vealed the coal power plant shown in Fig. 4. Similar pollution tracks over Australia were previously documented by Rosen-feld (2000). The tracks are evident in the microphysical RGB composite imagery (represented by areas 1 and 2 in Fig. 3) by the yellow color of the clouds, which reflects their small
re∼10 µm. The background clouds (represented by areas 3 and 4 in Fig. 3) are shown as red, which reflects their large
re> 20 µm. These clouds are deeper than the marine stratocu-mulus in the case of the ship tracks. This allows constructing
T–rerelations for these clouds (Fig. 5). According to the VI-IRST–re in Fig. 5 the clouds extend vertically between 0 and−5◦C isotherms. VIIRS and MODIS retrieved similar microphysical properties in and out of the pollution track. Thereof clouds in the pollution track all ranges from 5 to 10 µm from NPP and MODIS, while thereof clouds out of the pollution track are 20–30 µm and 17–27 µm for NPP and MODIS, respectively.
Comparing the MODIS and VIIRS images shows that, as with the ship tracks, the pollution track was evident in both images, but the fine structure that is seen in VIIRS (Fig. 3b) gets lost in the MODIS image (Fig. 3e). This is most evident by a tiny pollution track that seems to have originated from a fire that appears as the hot spot marked by point 5 in the magnified inset shown as Fig. 3c. The MODIS view of the same area is shown in Fig. 3f. The hot spot is not resolved there, and the individual yellow small clouds that are evident in the VIIRS imager are blurred into a faintly brighter area in the MODIS image. The finer detail of VIIRS is also evident in Fig. 5, as MODIS missed some of the warmest and cold-est cloudy points because they are averaged out by its lower resolution.
0 5 10 15 20 25 30 35 40 -40
-30
-20
-10
0
10
20
re50-1
re50-2
re50-3
re50-4 re50-5
Effective Radius (m)
Temperature (°C)
VIIRS
Houston 2012 07 19 19:22 UT
A
0 5 10 15 20 25 30 35 40 -40
-30
-20
-10
0
10
20
re50-1
re50-2
re50-3
Effective Radius (m)
Temperature (°C)
VIIRS
Manaus 2012 05 11 17:24 UT
B
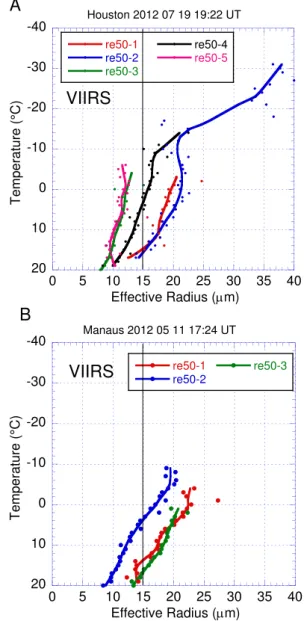
Fig. 17.Same as Fig. 5, but for the contrasting conditions between the polluted clouds. Panel(A): urban polluted clouds with reduced
reover Houston, Texas (lines 3 and 5), compared with background clouds to the west and NW of the city (lines 1 and 2), represent the areas shown in Fig. 15. Panel(B): theT–reof the clouds pollution plume of Manaus in the Amazon is shown by line 2, whereas lines 1 and 3 show the background pristine clouds that represent the areas shown in Fig. 16.
3.3 Merging of pollution tracks into regional pollution
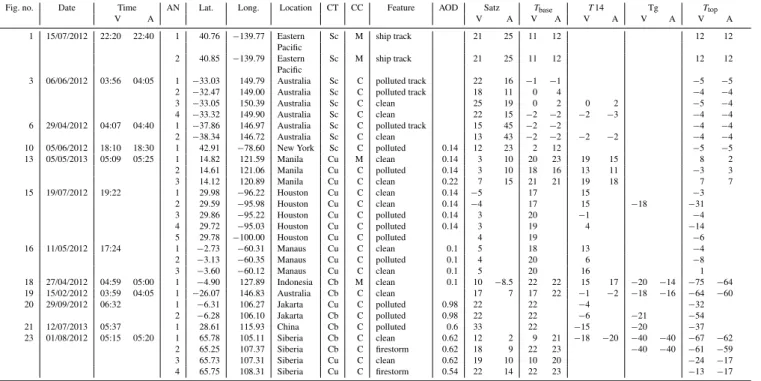
Table 2.Cloud samples in this study.
Fig. no. Date Time AN Lat. Long. Location CT CC Feature AOD Satz Tbase T14 Tg Ttop
V A V A V A V A V A V A
1 15/07/2012 22:20 22:40 1 40.76 −139.77 Eastern Sc M ship track 21 25 11 12 12 12 Pacific
2 40.85 −139.79 Eastern Sc M ship track 21 25 11 12 12 12 Pacific
3 06/06/2012 03:56 04:05 1 −33.03 149.79 Australia Sc C polluted track 22 16 −1 −1 −5 −5 2 −32.47 149.00 Australia Sc C polluted track 18 11 0 4 −4 −4 3 −33.05 150.39 Australia Sc C clean 25 19 0 2 0 2 −5 −4 4 −33.32 149.90 Australia Sc C clean 22 15 −2 −2 −2 −3 −4 −4 6 29/04/2012 04:07 04:40 1 −37.86 146.97 Australia Sc C polluted track 15 45 −2 −2 −4 −4 2 −38.34 146.72 Australia Sc C clean 13 43 −2 −2 −2 −2 −4 −4 10 05/06/2012 18:10 18:30 1 42.91 −78.60 New York Sc C polluted 0.14 12 23 2 12 −5 −5 13 05/05/2013 05:09 05:25 1 14.82 121.59 Manila Cu M clean 0.14 3 10 20 23 19 15 8 2 2 14.61 121.06 Manila Cu C polluted 0.14 3 10 18 16 13 11 −3 3 3 14.12 120.89 Manila Cu C clean 0.22 7 15 21 21 19 18 7 7 15 19/07/2012 19:22 1 29.98 −96.22 Houston Cu C clean 0.14 −5 17 15 −3
2 29.59 −95.98 Houston Cu C clean 0.14 −4 17 15 −18 −31 3 29.86 −95.22 Houston Cu C polluted 0.14 3 20 −1 −4 4 29.72 −95.03 Houston Cu C polluted 0.14 3 19 4 −14 5 29.78 −100.00 Houston Cu C polluted 4 19 −6 16 11/05/2012 17:24 1 −2.73 −60.31 Manaus Cu C clean 0.1 5 18 13 −4 2 −3.13 −60.35 Manaus Cu C polluted 0.1 4 20 6 −8 3 −3.60 −60.12 Manaus Cu C clean 0.1 5 20 16 1 18 27/04/2012 04:59 05:00 1 −4.90 127.89 Indonesia Cb M clean 0.1 10 −8.5 22 22 15 17 −20 −14 −75 −64 19 15/02/2012 03:59 04:05 1 −26.07 146.83 Australia Cb C clean 17 7 17 22 −1 −2 −18 −16 −64 −60 20 29/09/2012 06:32 1 −6.31 106.27 Jakarta Cu C polluted 0.98 22 22 −4 −32
2 −6.28 106.10 Jakarta Cb C polluted 0.98 22 22 −6 −21 −54 21 12/07/2013 05:37 1 28.61 115.93 China Cb C polluted 0.6 33 22 −15 −20 −37 23 01/08/2012 05:15 05:20 1 65.78 105.11 Siberia Cb C clean 0.62 12 2 9 21 −18 −20 −40 −40 −67 −62
2 65.25 107.37 Siberia Cb C firestorm 0.62 18 9 22 23 −40 −40 −61 −59 3 65.73 107.31 Siberia Cu C clean 0.62 19 10 10 20 −24 −17 4 65.75 108.31 Siberia Cu C firestorm 0.54 22 14 22 23 −13 −17
Fig. no.: figure number in the context; Time: satellite overpass time, in which V and A stand for imagers of VIIRS and AQUA, and same hereinafter; AN: number of area selected in the figure; Lat. and Long.: central latitude and longitude of selected area; Location: country or city where clouds are located; CT: type of cloud classification; Sc: stratocumulus; Cu: cumulus; Cb: cumulonimbus; CC: general cloud properties in which M and C stands for maritime or continental cloud, respectively; Feature: cloud feature or impact by pollution or clean cloud for comparing with the polluted cloud; AOD: aerosol optical depth from MODIS product; Satz: satellite zenith angle; Tbase: temperature of cloud base;T14: temperature ofrereaching 14 µm, initiation of precipitation;Ttop: temperature of cloud top; Tg is the glaciation temperature.
A VIIRS
2012 04 27 04:59
B MODIS
2012 04 27 05:00
Fig. 18.Pristine oceanic deep convection, as seen by the VIIRS(A) and MODIS(B)overpass on 27 April 2012 over the Banda Sea near Indonesia for an area of 140 km×101 km centered at 4.90◦S, 127.72◦E. The color scheme is microphysical RGB. Note the bright rim of the gust front, caused by the shallowness of the clouds there, which in turn causes the cloud drops to be smaller.
meticulously analyzed the cloud motions and composition with respect to the location of the emission sources. The
ad-vent of VIIRS readily resolves this argument by showing the individual plumes of polluted clouds that originate from each of the stacks of the power plant, shown here in Figs. 6 and 7. Figure 6 shows the three distinct bubbling cloud tops with very small re immediately above the stacks of three major coal power plants in the La Trobe Valley, shown in Fig. 7. The conspicuous reduction inrefrom a background of∼15 µm to about 7 µm just over the smoke stacks is shown quantitatively in Fig. 8. TheT–revalues of the polluted and background clouds are captured similarly by both MODIS and VIIRS, as shown in Fig. 9; this is likely owing to the large horizontal dimensions of these stratocumulus clouds, as evident in Fig. 6, and is in contrast to the highly localized pollution signatures within the clouds over the stacks of the power plants. These small, bubbling, polluted clouds are not sufficiently resolved by MODIS.
The pollution tracks are blowing northward with the 10 kn southerly winds at the stack height according to the Mel-bourne sounding. The surface wind was WSW, along the La Trobe valley, probably due to the channeling effect of the 1000 m high Baw Baw Plateau to its north. The low-level winds likely carried part of the pollution eastward, extending the area of polluted clouds to that direction.
3.4 Regionally polluted clouds
the ocean and the sparsely populated continent of Australia, where the pollution is a perturbation with respect to the back-ground. However, in the middle of densely populated areas such as western Europe and North America, the composi-tion of most clouds is in effect similar to those in the pol-lution tracks. An example is given here from the region of Buffalo, NY, USA, and to the south of Lake Ontario, shown as Fig. 10. On 5 June 2012 the region was partly covered by stratocumulus clouds that had large areas ofre< 10 µm, as evident in Fig. 11. In these nearly homogeneous condi-tions and widespread stratocumulus clouds, MODIS and VI-IRS provide similar information about the clouds, although finer details are visible with the VIIRS imager.
3.5 Urban air pollution in tropical cumulus clouds
Rosenfeld and Lensky (1998) showed a case of urban air pol-lution suppressing warm rain in Manila using AVHRR data. Here we revisit this location with VIIRS, shown in Fig. 13. The background clouds in areas 1 and 3 of Fig. 13 have large drops that exceed the 14 µm rain threshold well below their tops, thus appearing to be producing warm rain show-ers (Fig. 14). However,rein the clouds over the urban area remains well below 10 µm, thus precluding the possibility of rain showers from these clouds. Because some of the clouds are small, theT–rerelations as retrieved by MODIS are nois-ier than that of VIIRS, as evident in Fig. 14.
Similar effects were observed in deeper convective clouds in southerly flow over Houston, Texas, USA, and in the near vicinity (Fig. 15). The Houston pollution produced a plume of polluted clouds with a decreasedre over and downwind of the urban area, shown in area 3 of Fig. 15. Clouds were affected similarly by the pollution plume of Manaus in the Amazon, as shown in area 2 of Fig. 16. TheT–replots are shown in Fig. 17. The pollution in Houston, at least in part, appears to originate from a large refinery at area 3 of Fig. 15, which is associated with a sharp decrease of re there, as shown by contrasting the lines 5 and 6 in Fig. 17a. The pol-lution plume of Manaus produced a conspicuous decrease of > 5 µm inrefrom similar values to the north and south of the plume, as shown in Fig. 17b.
3.6 Deep tropical convection – from pristine marine to
highly polluted
Deep tropical convection is characterized by a very warm cloud base (> 20◦C) and very cold cloud tops, well below
the homogeneous ice nucleation temperature of−38◦C. The
large vertical distance from cloud base to the 0◦C isotherm as well as the large amount of condensed cloud water typ-ically cause these clouds to precipitate much of their water as warm rain, despite having a considerable part of their vol-ume well above the freezing level. Here we present the way in which VIIRS observes the vertical microphysical profiles of pristine clouds over ocean (Fig. 18), pristine clouds over
A
VIIRS
Microphysical RGB
B
MODIS
VIIRS Solar RGB
C
2012 02 15 03:59 UT
2012 02 15 04:05 UT
2012 02 15 03:59 UT
Fig. 19. Pristine deep convection, as seen by VIIRS (A) and MODIS(B)overpasses on 15 February 2012 over eastern Australia for an area of 155 km×109 km centered at 26.13◦S, 147.02◦E. Panels(A) and (B)are shown with the microphysical RGB and panel(C)again shows VIIRS image with the solar RGB.
land (Fig. 19), polluted clouds by diluted smoke from forest fires over Indonesia (Fig. 20), and heavily polluted clouds by the thick haze over southern China (Fig. 21). Some of the cases are compared with MODIS. TheT–rerelations of all these cases are shown in Fig. 22. This series of cases shows a systematic decrease ofreand an increase of height wherere exceeds 14 µm from the pristine marine clouds to the conti-nental pristine clouds, and to smoky and industrially polluted clouds.
1 2
A VIIRS
Microphysical RGB
VIIRS Solar RGB 2012 09 29 06:32 UT
VIIRS Nat. color RGB C
B
Fig. 20.Deep convection in smoky air over west Java, as seen by the VIIRS overpass on 29 September 2012, 06:32 UT, in an area of 178 km×78 km centered at 6.29◦S, 106.55◦E. The clouds de-veloped in diluted smoke that was transported from forest fires in Sumatra. Note that area 1 includes a growing cloud with top tem-peratures reaching−32◦C and yet is not glaciated. Area 2 includes an older cloud top that is glaciating between−10 and−20◦C (see Fig. 22e).
In general, it appears that the T–re vary much less be-low the height of initiation of precipitation or glaciation than above it, which is because the T–re relations below that height are dominated by the aerosols, whereas the rate of velopment of rain and ice hydrometeors above that height de-pends mainly on the updraft speed (Rosenfeld et al., 2008). This principle is evident in the case of clouds that grow in smoky atmosphere in western Java (Fig. 20). The clouds re-main composed of small drops up toT = −5◦C, where re reaches 14 µm (Fig. 22e). The cloud top in area 1 appears to be growing vigorously based on its bubbly texture, which is seen best in panel b for Fig. 20. It remains withre≤16 µm down toT = −32◦C, indicating a composition of mainly su-percooled water cloud. The adjacent higher and seemingly older cloud tower in area 2 appears already glaciated by its smoother texture and much larger indicatedrefor the same
T, as well as its blue coloration in panel c of Fig. 20, because the 1.6 µm channel is absorbed much more strongly by ice than by water.
Figure 21 shows deep tropical convective clouds develop-ing within an area of visible pollution haze, which was de-tected by MODIS Aqua as aerosol optical depth of∼0.75. The clouds that developed in this haze keptre< 14 µm well above the 0◦C isotherm level, until an abrupt increase indi-cated the onset of glaciation (Fig. 22f). Although only one
A VIIRS
Microphysical RGB 2013 07 12 05:37 UT
VIIRS Nat. color RGB B
C
Fig. 21.Deep convection in haze of air pollution over southeast China, as seen by the VIIRS overpasses on 12 July 2013 05:37 UT in an area of 200 km×106 km centered at 28.74◦N, 115.32◦E. The pollution haze is shown in panel(C)as the MODIS retrieved map of aerosol optical depth (AOD). The red star shows the location of the cloud marked by the rectangle in panel(A); it is located at an area with AOD=0.75.
cloud is shown here, this feature was repeatedly observed in all the hazy cases that were examined over China. This in-terpretation is in line with the results of the MODIS-based study showing that the heavy air pollution in China keeps the
resmall, but glaciates the clouds at∼ −20◦C (Rosenfeld et al., 2011).
3.7 Pyro-Cb
0 5 10 15 20 25 30 35 40 -40
-32
-24
-16
-8
0
8
16
24
re15 re50 re85
Effective Radius (m)
Temperature (°C)
VIIRS
201204270459-npp A
0 5 10 15 20 25 30 35 40
-40
-32
-24
-16
-8
0
8
16
24
re15 re50 re85
Effective Radius (m)
Temperature (°C)
MODIS
201204270500-modis B
0 5 10 15 20 25 30 35 40
-40
-32
-24
-16
-8
0
8
16
24
re15 re50 re85
Effective Radius (m)
Temperature (°C)
VIIRS
201202150359-npp C
0 5 10 15 20 25 30 35 40
-40
-32
-24
-16
-8
0
8
16
24
re15 re50 re85
Effective Radius (m)
Temperature (°C)
MODIS
201202150405-modis D
0 5 10 15 20 25 30 35 40
-40
-32
-24
-16
-8
0
8
16
24
re15-2 r50-2 re85-2
r50-1
Effective Radius (m)
Temperature (°C)
VIIRS 201209290632 E
0 5 10 15 20 25 30 35 40
-40
-32
-24
-16
-8
0
8
16
24
re15 re50 re85
Effective Radius (m)
Temperature (°C)
VIIRS
201307120537_pollute F
Fig. 22.TheT–rerelations for deep tropical convective clouds under various aerosol conditions. Shown are the 15th percentile, the median, and 85th percentiles of therefor any givenT. Panels(A)and(B): for marine pristine marine clouds as measured by VIIRS and MODIS, respectively, shown in Fig. 18. Note the flattening ofreat∼22 µm between 8 and−7◦C, which is indicative of the rainout zone;(B)and (C): pristine continental clouds over SE Australia for VIIRS and MODIS, respectively, shown in Fig. 19;(E): growing (line 1) and maturing (line 2) convective elements in smoky air in west Java, shown in Fig. 20;(F): growing convective clouds in haze of industrial pollution in SE China, shown in Fig. 21.
the cloud in panel c. These features are lost in the lower mi-crophysical resolution of MODIS, as evident in panel f.
The VIIRS-retrievedT–rerelation of the lower part of the pyro-Cb (line 2 in Fig. 24a) coincided with that of the smoky clouds shown as line 4. This means that the reduced re of the pyro-Cb was contributed mainly from the added smoke aerosols, and not to a significant extent from enhanced
1
2 3
4 2012 08 01 05:15 UT
A VIIRS B
C
D MODIS E
F 2012 08 01 05:20 UT
1
2 3
4
Fig. 23. Comparison between continental deep convection and pyro-Cb, as seen by VIIRS and MODIS. The data are from 1 Au-gust 2012 over eastern Siberia in an area of 306 km×289 km cen-tered at 66.19◦N, 107.05◦E. VIIRS is shown in panels (A–C), and the analysis is repeated for MODIS in panels(D–F). Areas 1 and 3 contain Cb clouds, which are magnified to full-resolution VI-IRS in panel(B)in an area of 61 km×62 km centered at 65.69◦N, 105.29◦E and panel(C)in an area of 58 km×56 km centered at 65.30◦N, 107.37◦E. The cloud in panel 3 is a pyro-Cb, which in-gests the smoke and heat from the fire that appears as a light-blue area just upstream of the pointed edge of the cloud. Cumulus con-vection is also compared in areas 2 and 4, with area 4 being affected by the smoke from the nearby fires. The smoky clouds are visibly brighter in this microphysical RGB because of the much smaller cloud drops. The color becomes completely red when the clouds glaciate. This is quantified in theT–rerelations shown in Fig. 24.
probably because the cloud elements at these heights were sufficiently large to match the lower resolution of MODIS.
Finally, theT–re relations from all the cases of the deep convective clouds are shown together in Fig. 25. The succes-sive decrease inre for the sameT for situations with more aerosols is clearly evident. This is coupled with the greater height and lowerT to which the cloud has to grow in order to havingre> 14 µm with the added aerosols.
4 Discussion and summary
The 375 m resolution of the NPP/VIIRS was applied to appli-cations of cloud microstructure. It was compared to MODIS and shown to have very similar retrieved cloud properties
0 5 10 15 20 25 30 35 40 -60
-50 -40 -30 -20 -10 0 10
re50-1 re50-2
re50-3 re50-4
Effective Radius (m)
Temperature (°C)
VIIRS
201208010515-npp
A
0 5 10 15 20 25 30 35 40 -60
-50 -40 -30 -20 -10 0 10
r30-1 r30-2
r30-3 r30-4
Effective Radius (m)
Temperature (°C)
MODIS
201208010520-modis
B
Fig. 24.Comparison between theT–rerelations of continental deep convection and pyro-Cb, as seen by VIIRS and MODIS, for the case shown in Fig. 23. The red line is from a pyro-Cb; the black line is from Cu clouds that develop in smoke from adjacent fire; the blue and green lines are from Cb and Cu clouds that are not affected by the smoke. The lower parts of the MODIS retrievedre increased anomalously in most of the clouds, probably due to contamination from the smoke and partial pixel filling. This was not a problem in VIIRS.
0 5 10 15 20 25 30 35 40 -40
-32 -24 -16 -8 0 8 16 24
re50-Marine re50-Cont-pristine
r50-Smoky
re50 Indust haze
re50-Pyro
Effective Radius (m)
Temperature (°C)
VIIRS
Fig. 25.TheT–rerelations of all the types of deep convective cloud in this study.
The application of the high resolution was applied here to elucidate cloud–aerosol interactions in various cloud types and environments. A systematic VIIRS high-resolution anal-ysis of shallow to deep clouds in the most pristine to the most polluted environments was performed and compared when possible with MODIS.
The examples include the following:
– Ship tracks in pristine broken marine stratocumulus. Features that were previously unresolved are seen in the individual rising plume of the smoky air and clouds that form the head of the ship track, as well as the ex-pansion streaks of the track after it is formed.
– Pollution track in pristine continental stratocumulus. Three examples are provided; these demonstrated the fine detail that can be resolved by VIIRS, as in the case of the ship tracks.
– Urban pollution signatures in cumulus convective clouds. Three examples are shown with clouds in the urban plume from Houston, Manila, and Manaus, composed of significantly reduced cloud drops that suppress warm rain, as indicated by reducing tore be-low the rain initiation threshold of 14 µm.
– Deep tropical Cb clouds in pristine air mass. Two ex-amples are shown, one over ocean and one over land. VIIRS can resolve the fine details better than MODIS. This is manifested in the fidelity of the microphysical retrievals and is evident in the spread of theT–re re-lations being smaller for VIIRS than MODIS, in this
as well as in all the other examples. A manifestation of that is a clearer identification of the warm rain or rainout signature, where theresaturates with increas-ing cloud to height until ice starts developincreas-ing. VIIRS also identifies the fine detail of the gust front that the tropical shower produced, including the reduction of the cloud drops near the leading edge, where the cloud depth is thinning.
– Deep tropical convective clouds in polluted atmo-spheres. Two examples are given. The first one is from a developing Cb in western Java in smoke that came from forest fires in Sumatra. The growing convective element could be identified to remain composed of supercooled drops down to a temperature of−32◦C.
An adjacent older cloud tower was already glaciated. Similar growing towers of deep tropical convection in the heavy pollution haze over southeast China showed that the haze kept the cloud drops very small (< 13 µm) down to the−20◦C isotherm level, where it glaciated, probably due to the ice nuclei content of the Chinese urban and industrial air pollution (Rosenfeld et al., 2011).
– Pyro-Cb, i.e., a cloud that feeds directly from the heat and smoke of an intense fire. An example of unper-turbed and nearby pyro-Cb over eastern Siberia is pre-sented. The pyro-Cb had much smallerrefor the same
T of the unperturbed continental clouds, which already had a rather smallre, which reached 14 µm only at the
−20◦C isotherm. VIIRS shows the fine detail of the
billowing clouds that occur directly over the fire, de-livering the impression of their intense bubbling vigor, whereas the MODIS 1 km microphysical resolution misses this kind of detail.
Acknowledgements. This research was supported by the China Special Fund for Meteorological Research in the Public Interest (GYHY201306005) and the National Basic Program of China (973 Program, 2013CB955800). We are grateful to the supports from Shaanxi Administration of Foreign Expert Affairs. The authors thank J. Mecikalski for helpful comments.
Edited by: Y. Cheng
References
Ayers, G. P: Air pollution and climate change: has air pollution sup-pressed rainfall over Australia?, Clean Air and Environmental Quality, 39, 51–57, 2005.
Bendix, J., Thies, B., Cermak, J., and Nauß, T.: Ground Fog Detec-tion from Space Based on MODIS Daytime Data – A Feasibility Study, Weather Forecast., 20, 989–1005, 2005.
Brunner, J. C., Ackerman, S. A., Bachmeier, A. S., and Rabin, R. M.: A Quantitative Analysis of the Enhanced-V Feature in Rela-tion to Severe Weather, Weather Forecast., 22, 853–872, 2007. Coakley, J. A., Bernstein, R. L., and Durkee, P. R.: Effects of
ship-stack effluents on cloud reflectivity, Science, 237, 1020–1022, 1987.
d’Entremont, R. P., and Larry, W.: Thomason: Interpreting Meteo-rological Satellite Images Using a Color-Composite Technique, B. Am. Meteorol. Soc., 68, 762–768, 1987.
Ferek, R. J., Garrett, T., Hobbs, P. V., Strader, S., Johnson, D., Tay-lor, J. P., Nielsen, K., Ackerman, A. S., Kogan, Y., Liu, Q., Al-brecht, B. A., and Babb, D.: Drizzle Suppression in Ship Tracks, J. Atmos. Sci., 57, 2707–2728, 2000.
Goren, T., and Rosenfeld, D.: Decomposing aerosol cloud radia-tive effects into cover, liquid water path and Twomey com-ponents in Marine Stratocumulus, Atmos. Res., 113, 378–393, doi:10.1016/j.atmosres.2013.12.008, 2013.
Freud, E. and Rosenfeld, D.: Linear relation between convective cloud drop number concentration and depth for rain initiation, J. Geophys. Res., 117, D02207, doi:10.1029/2011JD016457, 2012. Freud, E., Rosenfeld, D., and Kulkarni, J. R.: Resolving both entrainment-mixing and number of activated CCN in deep convective clouds, Atmos. Chem. Phys., 11, 12887–12900, doi:10.5194/acp-11-12887-2011, 2011.
Hillger, D. T., Kopp, T., Lee, D., Lindsey, C., Seaman, S., Miller, J., Solbrig, S., Kidder, S., Bachmeier, T., Jasmin, T., and Rink, T.: First-Light Imagery from Suomi NPP VIIRS, B. Am. Meteorol. Soc., 94, 1019–1029, doi:10.1175/BAMS-D-12-00097.1, 2013. Inoue, T.: An instantaneous delineation of convective rainfall areas
using split window data of NOAA-7 AVHRR, J. Meteor. Soc. Japan, 65, 469–481, 1987.
Lensky, I. M. and Rosenfeld, D.: Estimation of precipitation area and rain intensity based on the microphisical properties retrieved from NOAA AVHRR data, J. Appl. Meteorol., 36, 234–242, 1997.
Lensky, I. M. and Rosenfeld, D.: Satellite-based insights into pre-cipitation formation processes in continental and maritime con-vective clouds at nighttime, J. Appl. Meteorol., 42, 1227–1233, 2003a.
Lensky, I. M. and Rosenfeld, D.: A night rain delineation algorithm for infrared satellite data, J. Appl. Meteorol., 42, 1218–1226, 2003b.
Lensky, I. M. and Rosenfeld, D.: The time-space exchangeability of satellite retrieved relations between cloud top temperature and particle effective radius, Atmos. Chem. Phys., 6, 2887–2894, doi:10.5194/acp-6-2887-2006, 2006.
Lensky, I. M. and Rosenfeld, D.: Clouds-Aerosols-Precipitation Satellite Analysis Tool (CAPSAT), Atmos. Chem. Phys., 8, 6739–6753, doi:10.5194/acp-8-6739-2008, 2008.
Lindsey, D. T., Hillger, D. W., Grasso, L., Knaff, J. A., and Dostalek, J. F.: GOES Climatology and Analysis of Thunderstorms with Enhanced 3.9-µm Reflectivity, Mon. Weather Rev., 134, 2342– 2353, 2006.
Nakajima, T., and King, M. D.: Determination of the op-tical thickness and effective particle radius of clouds from reflected solar radiation measurements. Part I: The-ory, J. Atmos. Sci., 47, 1878–1893, doi:10.1175/1520-0469(1990)047<1878%3ADOTOTA>2.0.CO%3B2, 1990. Painemal, D., and Zuidema, P.: Assessment of MODIS cloud
ef-fective radius and optical thickness retrievals over the Southeast Pacific with VOCALS-REx in situ measurements, J. Geophys. Res., 116, D24206, doi:10.1029/2011JD016155, 2011.
Platnick, S., King, M. D., Ackerman, S. A., Menzel, W. P., Baum, B. A., Riédi, J. C., and Frey, R. A.: The MODIS cloud products: Algorithms and examples from Terra, IEEE T. Geosci. Remote, 41, 459–473, 2003.
Radke, L. F., Coakley, J. A., and King, M. D.: Direct and remote sensing observations of the effects of ships on clouds, Science, 246, 1146–1149, 1989.
Rosenfeld, D.: TRMM Observed First Direct Evidence of Smoke from Forest Fires Inhibiting Rainfall, Geophys. Res. Lett., 26, 3105–3108, 1999.
Rosenfeld, D.: Suppression of Rain and Snow by Urban and Indus-trial Air Pollution, Science, 287, 1793–1796, 2000.
Rosenfeld, D. and Lensky, I. M.: Satellite-based insights into pre-cipitation formation processes in continental and maritime con-vective clouds, B. Am. Meteorol. Soc., 79, 2457–2476, 1998. Rosenfeld, D. and Woodley, W. L.: Closing the 50-year circle: From
cloud seeding to space and back to climate change through pre-cipitation physics. Chapter 6 of “Cloud Systems, Hurricanes, and the Tropical Rainfall Measuring Mission (TRMM)”, edited by: Tao, W.-K. and Adler, R., 234 pp., 59–80, Meteorological Mono-graphs 51, AMS, 2003.
Rosenfeld D., Rudich, Y. and Lahav, R.: Desert dust suppressing precipitation- a possible desertification feedback loop, P. Natl. Acad. Sci. USA, 98, 5975–5980, 2001.
Rosenfeld, D., Lahav, R., Khain, A. P., and Pinsky, M.: The role of sea-spray in cleansing air pollution over ocean via cloud pro-cesses, Science, 297, 1667–1670, 2002.
Rosenfeld, D., Cattani, E., Melani, S., and Levizzani, V.: Consid-erations on daylight operation of 1.6-versus 3.7-µm channel on NOAA and METOP satellites, B. Am. Meteorol. Soc., 85, 873– 881, 2004.
Rosenfeld, D., Yu, X., and Dai, J.: Satellite retrieved microstruc-ture of AgI seeding tracks in supercooled layer clouds, J. Appl. Meteorol., 44, 760–767, 2005.
Rosenfeld, D., Lensky, I. M., Peterson, J., and Gingis, A.: Potential impacts of air pollution aerosols on precipitation in Australia, Clean Air and Environmental Quality, 40, 2, 43–49, 2006. Rosenfeld, D., Fromm, M., Trentmann, J., Luderer, G.,
observed microstructure, precipitation and lightning activity of a pyro-cumulonimbus, Atmos. Chem. Phys., 7, 645–659, doi:10.5194/acp-7-645-2007, 2007.
Rosenfeld, D., Woodley, W. L., Lerner, A., Kelman, G., and Lind-sey, D. T.: Satellite detection of severe convective storms by their retrieved vertical profiles of cloud particle effective ra-dius and thermodynamic phase, J. Geophys. Res., 113, D04208, doi:10.1029/2007JD008600, 2008.
Rosenfeld, D., Yu, X., Liu, G., Xu, X., Zhu, Y., Yue, Z., Dai, J., Dong, Z., Dong, Y., and Peng, Y.: Glaciation tempera-tures of convective clouds ingesting desert dust, air pollution and smoke from forest fires, Geophys. Res. Lett., 38, L21804, doi:10.1029/2011GL049423, 2011.
Rosenfeld, D., Woodley, W. L., Khain, A., Cotton, W.R., Carrió, G., Ginis, I., and Golden, J. H.: Aerosol effects on Microstructure and Intensity of Tropical Cyclones, B. Ame. Meteorol. Soc., 93, 987–1001, 2012a.
Rosenfeld, D., Williams, E., Andreae, M. O., Freud, E., Pöschl, U., and Rennó, N. O.: The scientific basis for a satellite mission to retrieve CCN concentrations and their impacts on convective clouds, Atmos. Meas. Tech., 5, 2039–2055, doi:10.5194/amt-5-2039-2012, 2012b.
Rudich, Y., Rosenfeld, D., and Khersonsky, O.: Treating clouds with a grain of salt, Geophys. Res. Lett., 29, 2060, doi:10.1029/2002GL016055, 2002.
Schickel, K. P, Hoffmann, H. E., and Kriebel, K. T.: Identification of icing water clouds by NOAA AVHRR satellite data, Atmos. Res., 34, 177–183, 1994.
Sullivan, J., Walton, C., Brown, J., and Evans, R.: Nonlinearity cor-rections for the thermal infrared channels of the Advanced Very High Resolution Radiometer: Assessment and recommendations, NOAA Tech. Rep. NESDIS 69, 31 pp., 1993.
Thompson, G, Bullock, R., and Lee, T. F.: Using Satellite Data to Reduce Spatial Extent of Diagnosed Icing, Weather Forecast., 12, 185–190, 1997.