www.geosci-model-dev.net/9/3589/2016/ doi:10.5194/gmd-9-3589-2016
© Author(s) 2016. CC Attribution 3.0 License.
GMMIP (v1.0) contribution to CMIP6: Global Monsoons Model
Inter-comparison Project
Tianjun Zhou1, Andrew G. Turner2, James L. Kinter3, Bin Wang4, Yun Qian5, Xiaolong Chen1, Bo Wu1, Bin Wang1, Bo Liu1,6, Liwei Zou1, and Bian He1
1LASG, Institute of Atmospheric Physics, Chinese Academy of Sciences, Beijing 100029, China 2NCAS-Climate and Department of Meteorology, University of Reading, Reading, UK
3Center for Ocean-Land-Atmosphere Studies & Dept. of Atmospheric, Oceanic & Earth Sciences, George Mason University, Fairfax, Virginia, USA
4Department of Meteorology, School of Ocean and Earth Science and Technology, University of Hawaii at Manoa, Honolulu, Hawaii, USA
5Atmospheric Sciences & Global Change Division, Pacific Northwest National Laboratory, Richland, Washington, USA 6College of Earth Science, Graduate University of the Chinese Academy of Sciences, Beijing 100049, China
Correspondence to:Tianjun Zhou ([email protected])
Received: 30 March 2016 – Published in Geosci. Model Dev. Discuss.: 11 April 2016 Revised: 3 September 2016 – Accepted: 14 September 2016 – Published: 10 October 2016
Abstract. The Global Monsoons Model Inter-comparison Project (GMMIP) has been endorsed by the panel of Cou-pled Model Inter-comparison Project (CMIP) as one of the participating model inter-comparison projects (MIPs) in the sixth phase of CMIP (CMIP6). The focus of GMMIP is on monsoon climatology, variability, prediction and projec-tion, which is relevant to four of the “Grand Challenges” proposed by the World Climate Research Programme. At present, 21 international modeling groups are committed to joining GMMIP. This overview paper introduces the motiva-tion behind GMMIP and the scientific quesmotiva-tions it intends to answer. Three tiers of experiments, of decreasing priority, are designed to examine (a) model skill in simulating the clima-tology and interannual-to-multidecadal variability of global monsoons forced by the sea surface temperature during his-torical climate period; (b) the roles of the Interdecadal Pacific Oscillation and Atlantic Multidecadal Oscillation in driving variations of the global and regional monsoons; and (c) the effects of large orographic terrain on the establishment of the monsoons. The outputs of the CMIP6 Diagnostic, Eval-uation and Characterization of Klima experiments (DECK), “historical” simulation and endorsed MIPs will also be used in the diagnostic analysis of GMMIP to give a comprehen-sive understanding of the roles played by different external forcings, potential improvements in the simulation of
mon-soon rainfall at high resolution and reproducibility at decadal timescales. The implementation of GMMIP will improve our understanding of the fundamental physics of changes in the global and regional monsoons over the past 140 years and ultimately benefit monsoons prediction and projection in the current century.
1 Introduction
Changes in the precipitation and atmospheric circulation of the regional monsoons are of great scientific and societal im-portance owing to their impacts on more than two-thirds of the world’s population. Prediction of changes to monsoon rainfall in the coming decades is of great societal concern and vital for infrastructure planning, water resource management, and sustainable agricultural and economic development, of-ten in less developed regions.
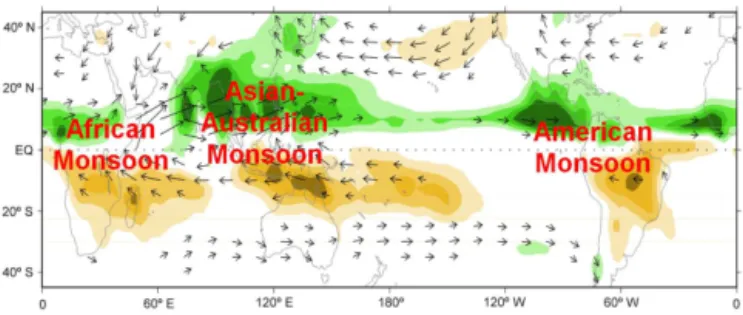
particu-Figure 1. Global monsoon domain and its local components, in-dicating by the differences of 850 hPa wind and precipitation between the June–July–August and December–January–February mean, modified from Wang and Ding (2008).
lar atmosphere–ocean–land interaction involved. At the same time, the regional monsoons have the fundamental driving factors of temperature and pressure gradients in common, and they are bounded by the global divergent circulation ne-cessitated by mass conservation as they evolve through the season (Trenberth et al., 2000). The global monsoon repre-sents the dominant mode of the annual variation of precip-itation and circulation in the global tropics and subtropics (Wang and Ding, 2008) and as such, the global monsoon is a defining feature of Earth’s climate. On the annual timescale, the global monsoon is a planetary scale circulation system with a seasonal reversal of the three-dimensional monsoon circulation that is accompanied by the migration of the mon-soon rainfall zones. However, it remains debatable to what extent and at which timescales the global monsoon – defined as the regional monsoons acting together – can be viewed as a major mode of climate variability (Wang et al., 2014). To fa-cilitate the discussion, we use “global monsoon” to regard all the monsoon domains as a whole and a single phenomenon to highlight the integrated role of monsoons in global hydrolog-ical cycle, whereas we use “global monsoons” to highlight the regional features of different monsoon domains around the globe.
To what extent can internal feedback processes in the cli-mate system drive the interannual variations of global mon-soon precipitation? Wang et al. (2012) showed that from one monsoon year (defined as May to the next April) to the next, most continental monsoon regions, separated by vast areas of arid trade winds and deserts, vary in a cohesive man-ner driven by the El Niño–Southern Oscillation (ENSO). On decadal timescales, numerous studies have investigated the linkage between regional monsoons and other major modes of climate variability. For instance, the Australian summer monsoon was linked to the Interdecadal Pacific Oscillation (IPO; Power et al., 1999); the Indian summer monsoon pre-cipitation has a correlation with the North Atlantic Oscil-lation (NAO) (Goswami et al., 2006) and the IPO (Meehl and Hu, 2006); the East Asian summer monsoon is related to the Atlantic Multidecadal Oscillation (AMO; Enfield et al., 2001; Lu et al., 2006) and the Pacific Decadal
Oscilla-tion (PDO; Mantua and Hare, 2002; Li et al., 2010; Qian and Zhou, 2014; Zhou et al., 2013); the variability of the west African and North American monsoons is related to the AMO (Sutton and Hodson, 2005; Zhang and Delworth, 2006; Gaetani and Mohino, 2013); and the African monsoon sys-tem is sensitive to inter-hemispheric sea surface sys-temperature (SST) variability in the Atlantic (Folland et al., 1986; Hoer-ling et al., 2006). Many decadal and interdecadal variations of regional monsoons have been identified, with differing pe-riodicity and phase change points (Yim et al., 2014; Chen and Zhou, 2014; Lin et al., 2014). While these concepts can be collated and simplified by considering processes controlling the position of the zonal mean intertropical convergence zone (ITCZ) (Schneider et al., 2014), a coherent global structure and the underlying causes of global monsoon interdecadal variability have yet to be widely studied.
The combination of changes in monsoon area and rainfall intensity has led to an overall weakening trend of global land monsoon rainfall since the 1950s (Wang and Ding, 2006; Zhou et al., 2008a). This decreasing tendency is dominated by the African and South Asian monsoons, as shown by the significant decreasing tendencies of both rainfall inten-sity and monsoon coverage area (Zhou et al., 2008b). Begin-ning in the 1980s, however, the Northern Hemisphere global monsoon precipitation has had an upward trend (Wang et al., 2012). These studies of the trends in relatively short precip-itation records have not been able to confirm whether these trends are part of longer-period fluctuations. Recently, Wang et al. (2013) studied coherent interdecadal variations of the Northern Hemisphere summer monsoon (NHSM) by using the NHSM circulation index (defined by the vertical shear of zonal winds between 850 and 200 hPa averaged in 0–20◦N,
120◦
W–120◦
E). The NHSM circulation index is highly cor-related with the NHSM rainfall intensity over the modern record (r=0.85 for 1979–2011). They demonstrated that the NHSM circulation has experienced large-amplitude mul-tidecadal fluctuations since 1871, primarily attributed to a mega-ENSO (a leading mode of interannual-to-interdecadal variation of global sea surface temperature) and the AMO. Only about one-third of the recent increasing trend in the NHSM rainfall since 1979, when measured across the whole northern hemisphere, has been attributed to anthropogenic warming.
climate (Lau et al., 2008). Aerosols may reduce surface solar insolation, thus weakening the land–ocean thermal contrast and modifying the formation and development of monsoons. Many mechanisms have been proposed in the past 2 decades regarding the impact of aerosols on monsoon circulation and precipitation. These mechanisms are complicated by the feedbacks with large-scale moist environmental dynamics, so large uncertainties still remain (Qian and Giorgi, 1999; Menon et al., 2002; Qian et al., 2006, 2009, 2011, 2015). The aerosol–monsoon interaction has attracted rapidly increasing interest in the global climate modeling community. The rela-tive importance of aerosol forcing and global warming to ob-served trends of monsoon rainfall, for example the decreas-ing of Indian rainfall in the recent decades, also needs to be clarified (Bollassina et al., 2011; Annamalai et al., 2013; He et al., 2016). Understanding the mechanisms of precipitation changes in the global monsoon system and identifying the roles of natural and anthropogenic forcing agents have been central topics of the monsoon research community (Cook and Seager, 2013; Liu et al., 2013; Song et al., 2014; Polson et al., 2014; Guo et al., 2015).
While all monsoons are associated with large-scale cross equatorial overturning circulations, major differences in the characteristics of the regional monsoons arise because of the different orography and underlying surface as well as the ex-ternal forcing. This is most apparent for the Asian region, due to the Tibetan–Iranian Plateau, Himalayan mountains and strong anthropogenic forcing from aerosol emissions and land-use change. The highlands may act as a physical barrier that isolates the heat and moisture south of the Himalaya and a high-level heat source (pump) that directly drives the mon-soon circulation through meridional thermal contrast (Yeh et al., 1957; Flohn, 1957; Yeh and Wu, 1998; Yanai and Wu, 2006). However, the relative role of the two effects deserve more discussion (Boos and Kuang, 2010, 2013; Wu et al., 2012; Qiu, 2013).
Climate models are useful tools in climate variability and climate change studies. However, the performance of cur-rent state-of-the-art climate models is very poor and needs to be greatly improved over the monsoon domains (Cook et al., 2012; Kitoh et al., 2013; Wang et al., 2005; Zhou et al., 2009a; Sperber et al., 2013; Song and Zhou, 2014a, b). As one of the endorsed model inter-comparison projects (MIPs) in the sixth phase of the Coupled Model Inter-comparison Project (CMIP6) (Eyring et al., 2016), the Global Mon-soons Model Inter-comparison Project (hereafter GMMIP) aims to improve our understanding of physical processes in global monsoon systems by performing multi-model inter-comparisons, ultimately to work towards better simulations of the mean state, interannual variability and long-term changes of the global monsoons. The contributions of inter-nal variability (IPO and AMO) and exterinter-nal anthropogenic forcing to the historical evolution of global monsoons in the 20th and 21st century will also be addressed.
GMMIP aims to answer four primary scientific questions:
1. What are the relative contributions of internal processes and external forcing that are driving the historical evo-lution of monsoons over the late 19th through early 21st centuries?
2. To what extent and how does atmosphere–ocean inter-action contribute to the interannual variability and re-producibility of monsoons?
3. How can high-resolution and associated improved model dynamics and physics help to reliably simulate monsoon precipitation and its variability and change? 4. What is the effect of the orography of the Himalaya–
Tibetan Plateau on the development and maintenance of the Asian monsoon? Similarly, what is the impact of orography elsewhere on other regional monsoons? By focusing on addressing these four questions, we expect to deepen our understanding of the capability of models to reproduce the monsoon mean state and its natural variability as well as the forced response to natural and anthropogenic forcing, which ultimately will help to reduce model uncer-tainty and improve the credibility of models in projecting fu-ture changes in the monsoon. The coordinated experiments will also help advance our physical understanding and pre-diction of monsoon changes.
Due to the uncertainties in physical parameterizations in current models, particularly in convection schemes (Chen et al., 2010), the best way to address the above questions is through a multi-model framework in order capture the range of possible responses to forcing. The multi-model database to be produced for CMIP6 (Eyring et al., 2016), in conjunction with the GMMIP experiments will provide an opportunity for advancement of monsoon modeling and understanding. GMMIP will also contribute to the Grand Challenges of the World Climate Research Programme (WCRP) and address them in the following way:
1. Water availability: the water resources in global mon-soon domains are greatly affected by the anomalous ac-tivities of monsoons. The summer monsoons produce more than 80 % of the annual rainfall in some areas, e.g., in India, Africa and Australia, and the percentage is more than 60 % averaged across all global monsoon re-gions (Fig. 2). Understanding the mechanisms of mon-soon variability on interannual and longer timescales as posed by GMMIP will lead to improvement of mon-soon prediction and projection and provide useful in-formation for policymakers in water availability-related decision-making.
Figure 2. Climatological percentage of summertime rainfall amount (JJAS in the Northern Hemisphere and DJFM in the South-ern Hemisphere) in annual accumulation. Monsoon region is circled by red curves. GPCP data are used and the time covers 1979–2014.
3. Clouds, circulation and climate sensitivity: a reasonable simulation of monsoon circulation is a prerequisite for a successful simulation of monsoon precipitation (e.g., Sperber et al., 2013). At the same time, tropical precipi-tation is strongly dependent on convection, with mon-soon precipitation biases very sensitive to convective parameterizations and therefore clouds. These param-eterizations also lead to large uncertainties in climate sensitivity (e.g., Stainforth et al., 2005). By comparing the performance of climate models with relatively high and low resolutions, and model simulations with and without air–sea interaction processes, GMMIP will at-tempt to link monsoon precipitation simulation with the fidelity of the large-scale circulation and the latest re-mote sensing estimates of clouds.
2 Participating models
So far 21 international modeling groups have committed to contributing to GMMIP (as shown in Table 1). The diversity of the groups from different countries and regions demon-strates that the global monsoons topic appeals to a wide range of modeling and research communities. The models with var-ious structures, physical parameterizations, resolutions, etc., will provide a large sample size to help reveal the causes of monsoon variability on interannual and longer timescales in the climate system. Based on the experimental protocol (see Sect. 3), both atmosphere-only and fully coupled ocean– atmosphere versions of these models will be used.
3 Experimental protocol
Based on the priority level of proposed scientific questions, the main experiments of GMMIP, which are summarized in Table 2, are divided into tier-1, tier-2, and tier-3 of decreas-ing priority (Fig. 3). In order to diagnose internal variability, at least three members integrated from different initial condi-tions are required for tier-1 and tier-2 experiments. Pending the availability of computer resources at GMMIP-committed
Table 1.Description of models participating GMMIP.
Model Institute/Country
ACCESS CSIRO-BOM/Australia
BCC-CSM2-MR BCC/China
BNU-ESM BNU/China
CAMS-CSM CAMS/China
CanESM CCCma/Canada
CAS-ESM CAS-IAP/China
CESM NCAR-COLA/USA
CESS-THU THU/China
CMCC CMCC/Italy
CNRM-CM CNRM-CERFACS/France
FGOALS IAP-LASG/China
FIO FIO/China
GFDL NOAA-GFDL/USA
GISS NASA-GISS/USA
HadGEM3 MOHC-NCAS/UK
IITM IITM/India
IPSL-CM6 IPSL/France
MIROC6-CGCM AORI-UT-JAMSTEC-NIES/Japan
MPI-ESM MPI-M/Germany
MRI-ESM1.x MRI/Japan
NUIST-CSM NUIST/China
Tier-1
Tier-3
Tier-2
amip-hist
amip-hld 1870–2014 1870–2014 1979–2014 DECK
HigResMIP
DCPP
Historical
DAMIP
VolMIP
GMMIP
CORDEX
Figure 3.Three-tier experiments of GMMIP and its connections with DECK, historical simulation and endorsed MIPs.
climate-modeling centers, realizations with more than three members are encouraged.
3.1 Tier-1: extended AMIP experiment
Table 2.Experiment list of GMMIP.
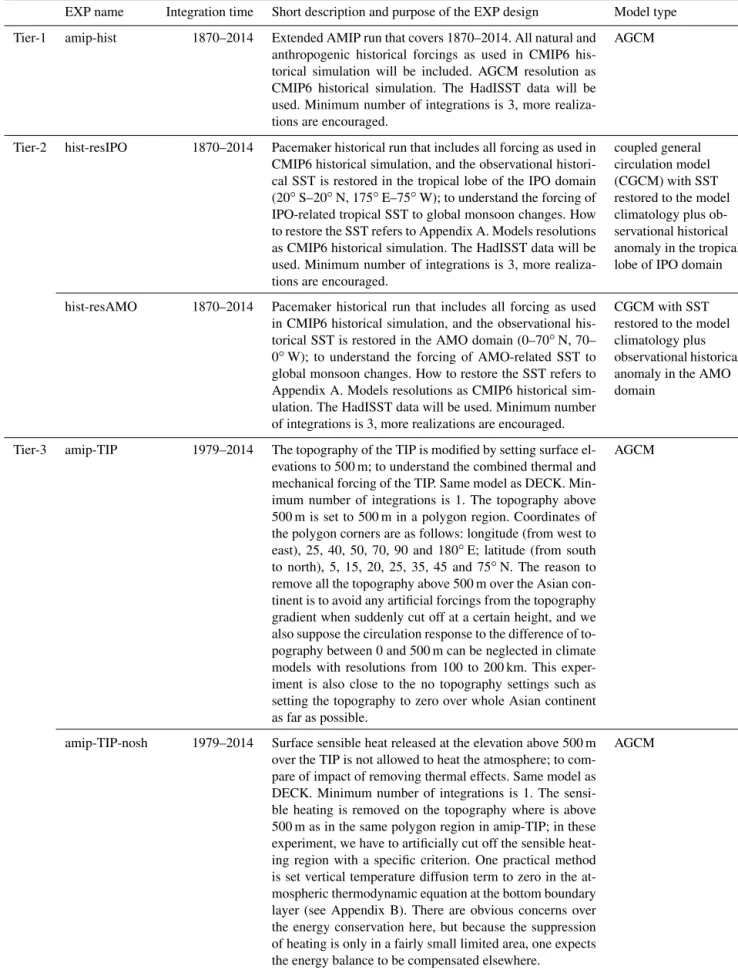
EXP name Integration time Short description and purpose of the EXP design Model type
Tier-1 amip-hist 1870–2014 Extended AMIP run that covers 1870–2014. All natural and anthropogenic historical forcings as used in CMIP6 his-torical simulation will be included. AGCM resolution as CMIP6 historical simulation. The HadISST data will be used. Minimum number of integrations is 3, more realiza-tions are encouraged.
AGCM
Tier-2 hist-resIPO 1870–2014 Pacemaker historical run that includes all forcing as used in CMIP6 historical simulation, and the observational histori-cal SST is restored in the tropihistori-cal lobe of the IPO domain (20◦S–20◦N, 175◦E–75◦W); to understand the forcing of IPO-related tropical SST to global monsoon changes. How to restore the SST refers to Appendix A. Models resolutions as CMIP6 historical simulation. The HadISST data will be used. Minimum number of integrations is 3, more realiza-tions are encouraged.
coupled general circulation model (CGCM) with SST restored to the model climatology plus ob-servational historical anomaly in the tropical lobe of IPO domain
hist-resAMO 1870–2014 Pacemaker historical run that includes all forcing as used in CMIP6 historical simulation, and the observational his-torical SST is restored in the AMO domain (0–70◦
N, 70– 0◦W); to understand the forcing of AMO-related SST to global monsoon changes. How to restore the SST refers to Appendix A. Models resolutions as CMIP6 historical sim-ulation. The HadISST data will be used. Minimum number of integrations is 3, more realizations are encouraged.
CGCM with SST restored to the model climatology plus observational historical anomaly in the AMO domain
Tier-3 amip-TIP 1979–2014 The topography of the TIP is modified by setting surface el-evations to 500 m; to understand the combined thermal and mechanical forcing of the TIP. Same model as DECK. Min-imum number of integrations is 1. The topography above 500 m is set to 500 m in a polygon region. Coordinates of the polygon corners are as follows: longitude (from west to east), 25, 40, 50, 70, 90 and 180◦E; latitude (from south to north), 5, 15, 20, 25, 35, 45 and 75◦
N. The reason to remove all the topography above 500 m over the Asian con-tinent is to avoid any artificial forcings from the topography gradient when suddenly cut off at a certain height, and we also suppose the circulation response to the difference of to-pography between 0 and 500 m can be neglected in climate models with resolutions from 100 to 200 km. This exper-iment is also close to the no topography settings such as setting the topography to zero over whole Asian continent as far as possible.
AGCM
amip-TIP-nosh 1979–2014 Surface sensible heat released at the elevation above 500 m over the TIP is not allowed to heat the atmosphere; to com-pare of impact of removing thermal effects. Same model as DECK. Minimum number of integrations is 1. The sensi-ble heating is removed on the topography where is above 500 m as in the same polygon region in amip-TIP; in these experiment, we have to artificially cut off the sensible heat-ing region with a specific criterion. One practical method is set vertical temperature diffusion term to zero in the at-mospheric thermodynamic equation at the bottom boundary layer (see Appendix B). There are obvious concerns over the energy conservation here, but because the suppression of heating is only in a fairly small limited area, one expects the energy balance to be compensated elsewhere.
Table 2.Continued.
EXP name Integration time Short description and purpose of the EXP design Model type
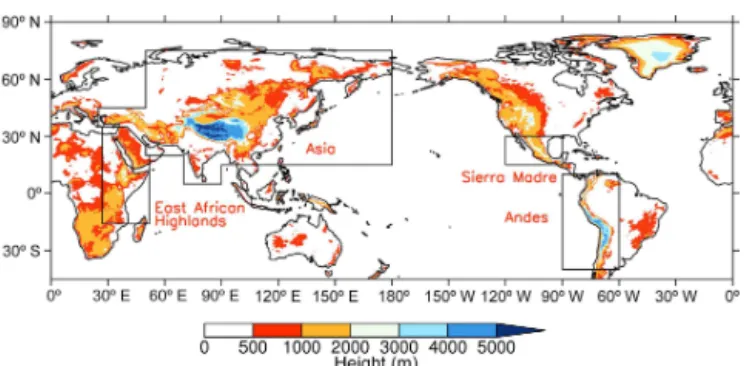
Tier-3 amip-hld 1979–2014 The topography of the East African Highlands in Africa and Arabian Peninsula, Sierra Madre in N. America and Andes in S. America is modified by setting surface elevations to a certain height (500 m) in separate experiments. Same model as DECK. Minimum number of integrations is 1. See descriptions of amip-TIP for technical details and regions as outlined in Fig. 5. The East African Highlands is in a polygon region. Coordinates of the polygon is as follows: longitude (from west to east), 27 and 52◦E; latitude (from south to north), 17◦S, 20 and 25, 35◦N. Sierra Madre domain is 120–90◦W, 15–30◦N. Andes domain is 90–60◦W, 40◦S–10◦N.
AGCM
and extended AMIP run, to determine the importance of SST variability to long- and short-term trends in the monsoon cir-culations and the associated precipitation. The boundary con-ditions for sea-surface temperature and sea ice are derived from a merged version of the Hadley Centre Sea Ice and Sea Surface Temperature (HadISST) and Optimum Interpolation Sea Surface Temperature (OISST) data sets (Hurrell et al., 2008), which can be downloaded from the PCMDI website1. 3.2 Tier-2: decadal mode relaxation experiments The tier-2 experiments are initialized from the “historical” run year 1870 and integrated up to year 2014 with histori-cal forcings. Additionally, the variation in the tropihistori-cal Pacific and North Atlantic SST are restored to the observation in the “hist-resIPO” and “hist-resAMO” runs, respectively. The tier-2 “hist-resIPO” (historical anthropogenic forcing plus restoring IPO SST) run is a pacemaker-coupled historical cli-mate simulation that includes all forcings as in the CMIP6 historical experiment, but with SST restored to the model climatology plus observed historical anomaly in the tropi-cal lobe of the IPO (Power et al., 1999; Folland et al., 2002) domain (20◦S–20◦N, 175◦E–75◦W). This relaxation is
ap-plied with weight=1 in the inner box (15◦S–15◦N, 180–
80◦
W) and linearly reduced to zero in the buffer zone (zonal and meridional ranges are both 5◦) from the inner to outer
box (Fig. 4a). There are several restoring methods to realize such “pacemaker” simulations (see the Appendix A). To en-sure stability during integration, we recommend nudging to the specified SST described above with a 10-day timescale (see the Appendix A for technical details).
Similarly, the tier-2 “hist-resAMO” (historical anthro-pogenic forcing plus restoring AMO SST) run is a pacemaker-coupled historical climate simulation that in-cludes all forcings but with the SST restored to the model cli-matology plus observational historical anomaly in the AMO (Enfield et al., 2001; Trenberth and Shea, 2006) domain (0–
1http://www-pcmdi.llnl.gov/projects/amip/AMIP2EXPDSN/
BCS/amipbc_dwnld.php
Figure 4. The restoring regions for tier-2 experiments (a) hist-resIPO and(b)hist-resAMO.
70◦N, 70–0◦W). The restoration is fully applied in the inner
box (5–65◦N, 65–5◦W), and linearly reduced to zero in the
buffer zone (zonal and meridional ranges are both 5◦) from
the inner to outer box (Fig. 4b).
understand quantitatively the regional response to the oro-graphic perturbation from both the thermal and dynamical aspects. The results will be very helpful to understand the topography effect on the atmosphere and associated physi-cal processes lophysi-cally and quantitatively, such as the distri-bution, intensity and frequency changes in the precipitation over wide monsoon regions. In the tier-3 “amip-TIP” run (viz. no Tibetan–Iranian Plateau) run, following Boos and Kuang (2010, 2013) and Wu et al. (2007, 2012), the topog-raphy of the Tibetan–Iranian Plateau (hereafter TIP; see Ta-ble 2 for detailed descriptions) in the model is modified by leveling off the TIP to 500 m, with other surface properties unchanged (Asia region in Fig. 5 and details seen in Ap-pendix B). Other settings of the integration are the same as the standard DECK AMIP run. This experiment represents perturbations to both thermal and mechanical forcing of the TIP with respect to the standard DECK AMIP run. In an ensemble of experiments comprising the tier-3 “amip-hld” run (viz. no HighLanDs) group, the topography of the East African Highlands in Africa (after Slingo et al., 2005), Sierra Madre in North America and the Andes in South America is modified by setting surface elevations to 500 m in those respective regions (Fig. 5).
The sensible heat over the elevated topography is regarded as the main driver of the behavior of the low level atmo-sphere and possibly also the upper tropoatmo-sphere and lower stratosphere (Wu et al., 2016). To examine the importance of elevated heating in monsoon from perspective of multi-model comparison, in the tier-3 “amip-TIP-nosh”run (viz. Tibetan–Iranian Plateau – no sensible heating), the surface sensible heat flux at elevations above 500 m over the TIP is not allowed to heat the atmosphere; i.e., the vertical tempera-ture diffusion term in the atmospheric thermodynamic equa-tion at the bottom boundary layer is set to zero (Wu et al., 2012; details seen in Appendix B). The atmospheric compo-nent will not see the surface upward sensible heat flux (zero), whereas the land component is as usual. Other settings of the integration are the same as the standard DECK AMIP run. The differences between the standard DECK AMIP run and the amip-TIP-nosh are considered to represent the removal of TIP thermal forcing only and thus the circulation pattern of amip-TIP-nosh reflects the impacts of mechanical forcing. 3.4 Experiment outputs
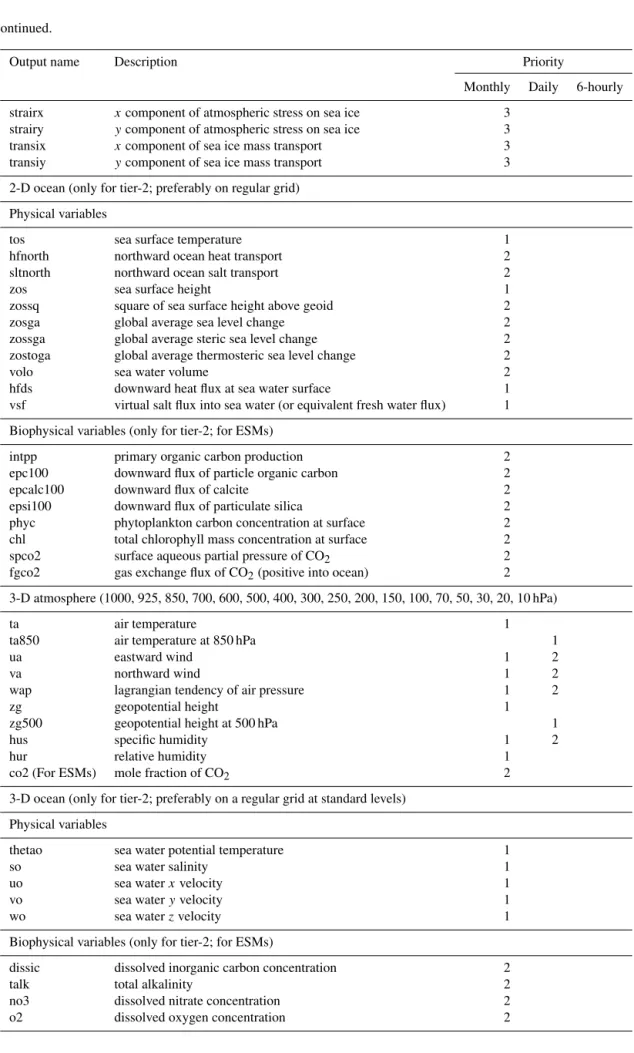
The recommended output variables are listed in Appendix C.
4 Connection with DECK, historical simulation and endorsed MIPs
The tier-1 experiment of GMMIP, i.e., the extended AMIP, uses the same resolution as in the DECK (Eyring et al., 2016). The amip-hist specifies external forcings that are con-sistent with those from the same model’s CMIP6 historical
Figure 5.The orography regions specified for the tier-3 experiments for the Asia region (comprising the Tibetan–Iranian Plateau and Hi-malayas), the East African Highlands (adapted from Slingo et al., 2005), the Andes and Sierra Madre. Within each marked region, orography would be capped at 500 m height. Orographic data de-rived from a∼30 km resolution (N512) boundary field of the Met Office HadGEM3 model.
simulation over the 1870–2014 period. To comprehensively investigate the proposed GMMIP scientific questions, such as the impact of high resolution and roles of different forcing agents, the output from other related MIPs will be used in the diagnostic analysis of GMMIP as described below.
4.1 DECK and historical simulation
The pre-industrial control simulations from each modeling group’s DECK experiments will be used to study the re-lation between global monsoon and IPO/AMO at decadal timescale. Comparing the control simulation (constant forc-ing) with the GMMIP tier-2 decadal mode relaxation exper-iments in which all historical forcings are added will then allow us to find which parts of apparent decadal variations in the monsoons are caused by underlying SST, and which are more forced by externally driven sources, such as vol-canic emissions. The CMIP6 historical simulations will also be used to examine the response of the global monsoon to external forcings such as anthropogenic GHG and aerosol emissions. The results of CMIP6 historical simulation will be compared with those of hist-resIPO and hist-resAMO in tier-2 to identify the relative contributions of external forcing and apparently internal modes of variability (IPO/AMO). 4.2 DAMIP (Detection and Attribution MIP)
Several DAMIP experiments are useful to GMMIP. The histALL (enlarged ensemble size of historical all-forcing runs in DECK), histNAT (historical natural forcings-only run), histGHG (historical well-mixed GHG-only run), and histAER (historical anthropogenic-aerosols-only run) exper-iments of DAMIP will be used in the analysis of changes in global monsoons dating back to 1870.
changes since 1870 in the context of contributions from GHG, the other anthropogenic factors and natural forcings. The contributions of these external forcings to global mon-soon changes will be compared to those from modes of inter-nal variability such as the IPO and AMO.
4.3 HighResMIP (High-Resolution MIP)
The tier-1 experiments of HighResMIP, which consist of AMIP runs with a minimum horizontal resolution of 25– 50 km, will be used to compare with standard resolution con-trol configurations and examine the added benefit, if any, of high-resolution models in reproducing both the mean state and year-to-year variability of global monsoons. It should be noted that the boundary conditions (both of SST and sea ice) used to build the AMIP experiments of HighResMIP is a new data set with daily time frequency (Haarsma et al., 2016), which may make a differences when compared with standard AMIP forced by monthly data sets.
The tier-2 experiments of HighResMIP, which are cou-pled runs consisting of pairs of both historic runs and con-trol runs using fixed 1950s forcing including anthropogenic GHG concentrations and aerosol forcing, will be used in the analysis of climatology and variability of global monsoons, which aims to understand the role of air–sea interaction in modulating the simulation skill of the monsoon mean state and year-to-year variability. The anthropogenic aerosols are required to be prescribed in HighResMIP experiments fol-lowing a standard method in CMIP6 DECK (Haarsma et al., 2016), rather than interactive aerosol processes embedded in atmosphere general circulation models (AGCMs). Different ways to deal with aerosols could lead to different aerosol dis-tributions as well as aerosol forcings, which should be taken in consideration when comparing with GMMIP experiments. 4.4 VolMIP (Volcanic forcing MIP)
The tier-1 experiment of the short set of VolMIP simulations is designed to create a large ensemble of short-term simula-tions of the 1991 Pinatubo eruption, using the same volcanic forcing recommended for the CMIP6 historical simulation. It will be used in comparison with observations to understand the global monsoon response to injection of stratospheric aerosols over the tropics and to study impact mechanisms on global monsoon precipitation and circulation changes. Via its ensemble design, VolMIP can address the substantial un-certainty associated with the effects of volcanism during the historical period.
4.5 DCPP (Decadal Climate Prediction Project) The outputs of DCPP near-term climate prediction experi-ments will be used to assess the skill of global monsoons in initialized decadal climate prediction. The C-component of DCPP is similar to the tier-2 experiment of GMMIP but fo-cuses on a shorter time period starting from 1950 (Boer et
al., 2016). The outputs will be used to add to the ensemble size of pacemaker experiments from GMMIP tier-2 during the 1950–2014 period.
4.6 CORDEX (international Coordinated Regional Downscaling Experiment)
In the core framework of CORDEX phase 2 (CORDEX2 hereafter), a core set of regional climate models (RCMs) downscales a core set of global climate models (GCMs) over all or most CORDEX domains at 10–20 km resolutions (Gutowski et al., 2016). The comparisons of CORDEX2 his-torical climate downscaling with the driving GCMs hishis-torical simulations, will give insight into the importance of model resolution and the added value of RCMs in the simulation of climatology and variability of global monsoon, especially the global land monsoon. A comparison of CORDEX2 eval-uation framework experiments forced with daily mean SST to HighResMIP tier-1 runs over global monsoon domains will provide information on the similarities and differences of the added values derived respectively from high-resolution global models and regional climate models.
5 Analysis plan
The analysis plan will focus on the scientific objectives of GMMIP. We list the key scientific questions that we hope that the community will be able to answer following the im-plementation of GMMIP below.
5.1 Understanding the changes of global monsoons since the 1870s
We will examine whether decadal and multi-decadal vari-ability of local monsoon systems and coherent changes of the global monsoon can be reproduced in the amip-hist ex-periment. First, the skill of reproducing interannual and in-terdecadal changes in the regional monsoons will be com-pared with long-term observed records in local monsoon re-gions, such as using the All-India Rainfall index from 1870 (Parthasarathy et al., 1994) and the global land precipitation from 1901 from Climatic Research Units (CRU; Harris et al., 2014; Zhang and Zhou, 2011). The simulated monsoon cir-culation can be compared with two twentieth-century reanal-yses from the National Oceanic and Atmospheric Admin-istration (20CR) and European Centre for Medium-Range Weather Forecasts (ERA20C), which are also derived from AGCM simulations driven by observational SST, where sur-face pressure (marine wind additionally used in ERA20C) records are assimilated (Compo et al., 2011; Poli et al., 2016).
ex-plore whether similar modulations occurred during the past 150 years, and what mechanisms are responsible for them.
Third, the contributions of apparently internal variability modes (IPO and AMO) to global monsoon variability and the role of air–sea interaction will be evaluated based on the hist-resIPO and hist-resAMO experiments of tier-2. Com-bined with CMIP6 DECK and DAMIP experiments, the roles of external forcing (GHG, aerosol, solar, etc.) and internal variability can be quantified. The impact of tropical volcanic eruptions on the global monsoons can be explored specifi-cally by analyzing VolMIP. Current state-of-the-art climate models still show bias in the simulation of monsoons (Sper-ber et al., 2013). We acknowledge that attention should be paid to the model bias in the analysis of model outputs, al-though multi-model ensemble/intercomparison approach is a useful way to reduce the uncertainty related to model bias. 5.2 Effect of air–sea interaction on interannual
variability of precipitation in the global monsoons Previous studies have noted that AGCM simulations with specified SST generally have low skill in simulating the in-terannual variation of the summer precipitation over global monsoon domains, especially the East Asian–western North Pacific summer monsoon domain (Wang et al., 2005). It is noted that in the real world the precipitation is negatively correlated with underlying SST in the western North Pacific monsoon domain, which is not reproduced by the AMIP runs (Wang et al., 2005). The deficiency of the AMIP simulations can be partially attributed to the exclusion of air–sea interac-tions (Song and Zhou, 2014b). Comparison between the tier-1 and tier-2 experiments of GMMIP can provide information about how the air–sea interactions influence the monsoon simulations on the interannual and interdecadal timescales in different monsoon domains. However, mean state tropical SST biases prevalent in coupled models are also known to affect the accurate connection of monsoon interannual vari-ability with teleconnected drivers such as ENSO (Turner et al., 2005).
5.3 Measuring improvement in the global monsoons with high-resolution modeling
Monsoon rainbands such as the Mei-yu–Baiu–Changma front usually have a maximum width of about 200 km (Zhou et al., 2009b). Climate models with low or moderate resolu-tion are generally unable to realistically reproduce mesoscale cloud clusters embedded in the rainbands, thus partly leading to biases in the mean state, variability of monsoon precipita-tion and the northward propagaprecipita-tion of these rainbands. We will examine the performance of high-resolution models in reproducing both the mean state and year-to-year variabil-ity of global monsoons. High-resolution rain-gauge observa-tions and satellite precipitation products will be used to eval-uate model performance.
5.4 Effects of large orographic terrain on the regional/global monsoons
The influence of the large-scale orography on the Asian sum-mer monsoon includes both mechanical and thermal forcing. Various mechanisms have been suggested concerning the to-pographic effects; however, an overarching paradigm delin-eating the dominant factors determining these effects and the strength of impacts needs further study. We will analyze the tier-3 experiments to provide a benchmark of current model behavior in simulating the impact on the monsoon of the TIP (as well as surrounding regions of significant orography; see Table 2 for detailed descriptions) so as to stimulate further re-search on the thermodynamic and dynamic influence of the TIP on the monsoon. In particular the relative contributions of thermal and orographic mechanical forcing by the TIP on the Asian monsoon will be addressed. We will extend the studies from the TIP to other highlands including highlands in Africa, North America and South America.
5.5 Aerosol–monsoon interaction
While aerosol–cloud interaction (ACI) effects are partially incorporated in GCMs with various levels of complexity, the aerosol–radiation interaction (ARI) effect, which is believed to have more explicit impact on land–sea thermal contrast by reducing the surface solar insolation, is fully incorporated in most of the CMIP6 models. To investigate the aerosol impacts on monsoon climate including both local forcing and remote forcing effects, we will examine the responses of climate models to natural (solar variability and volcanic aerosols) and anthropogenic (GHGs and aerosols) forcings based on DECK and DAMIP experiments. In particular, we will quantify and compare the separate climatic response of natural vs. anthropogenic forcing, as well as aerosol vs. GHG forcing, over the global monsoon area (e.g., Song et al., 2014). We will analyze how different forcings influence the general circulation and precipitation characteristics, such as extreme events, shift of precipitation spectrum, and diur-nal cycle.
6 Concluding remarks
HighResMIP, VolMIP, DCPP, and CORDEX, will help an-swer some fundamental scientific questions about the global monsoon and will help provide guidance about the future of monsoons as the planet’s climate changes. It is also hoped that the GMMIP will provide a good platform for the inter-national climate modeling community in the collaboration of monsoon studies.
7 Data availability
The model output from the GMMIP simulations described in this paper will be distributed through the Earth System Grid Federation (ESGF, http://esgf.llnl.gov) with digital ob-ject identifiers (DOIs) assigned. As in CMIP5, the model out-put will be freely accessible through data portals after reg-istration. In order to document CMIP6’s scientific impact and enable ongoing support of CMIP, users are obligated to acknowledge CMIP6, the participating modeling groups, and the ESGF centers (see details on the CMIP Panel
Appendix A: Restoring methods used in the “pacemaker” experiment
Owing to the difference in model formulation and the dif-ficulty that some users may face in operating pacemaker experiments in coupled models, we offer a choice of three recommended methods for restoring the SST in the hist-resIPO experiments. The first method is recommended for hist-resAMO experiments.
a. Restoring model SST in every model time step to the corresponding constructed daily SST with a timescale
τ: to reduce model drift, the constructed SST is the sum of the model daily climatological SST with seasonal cy-cle for the period of 1950–2014 from the corresponding coupled historical simulation and the daily SST anoma-lies in the observation, which are interpolated from the raw observed monthly SST anomalies with the seasonal cycle for the same period removed. We suggest one uses the AMIP SST to calculate the observational anomalies, consistent with tier-1 experiment.
dT
dt =Original trend terms +
T∗+T′
−T
τ (A1)
Here T denotes the SST and the asterisk represents model-diagnosed values. The prime (bar) refers to the anomaly (climatology). Here the anomaly is based on AMIP SST, while the model’s climatology refers to the seasonally evolved daily mean during 1950–2014 based on historical simulation. For the hist-resIPO (hist-resAMO) experiments, the restoring timescale is τ=
10 days (τ =60 days). The reason for a short timescale (10 days) used in hist-resIPO is that we also aim to study the decadal difference of interannual variability; too weak restoring may reduce the observed interannual signal.
b. Prescribing the SST directly in the first layer of ocean component: in the restoring regions, the SST is equal to the model climatology plus the observational anomaly using formula (A2).
T =(1−α) T∗+α T∗+T′
(A2) In the inner box (Fig. 4), the weighting termα=1, the
αis linearly reduced to zero in the buffer zone between inner and outer boxes.
c. Prescribing the surface net heat flux to restore the SST indirectly. This method has been used in Kosaka and Xie (2013) for hist-resIPO like experiment. In the restoring regions, the heat flux is restored using for-mula (A3). Here α has the same meaning as that de-scribed in Eq. (A2).
F=F∗+α
cpρD
τ
T′−T∗′
(A3)
Here F denotes the heat flux; cp denotes
constant-pressure-specific heat of sea water;ρ is the density of the sea water. For the hist-resIPO (hist-resAMO) ex-periments, the typical depth of the ocean mixed layer is D=10 m (D=50 m) and the restoring timescale
isτ=10 days (τ =60 days).T′ andT
∗′ are the SST
anomalies of AMIP and model SST, respectively, rela-tive to the climatology during 1950–2014. The model’s climatology is calculated from the historical simula-tion. The anomalies instead of full SST used here are to reduce possible drift. A similar restoring method is recommended in the DCPP Component C experiments (C1.9 and C1.10) except that full SST is used (Boer et al., 2016).
Appendix B: Orography and sensible heating modification methods used in the tier-3 experiment “Orographic perturbation”: the orography heightH is mod-ified in the model with the criterion of H=500 m when
H> 500 m. The modified Asian region is a polygon region. Coordinates of the polygon corners are as follows: longitude (from west to east), 25, 40, 50, 70, 90 and 180◦E; latitude
(from south to north), 5, 15, 20, 25, 35, 45 and 75◦N. The
East African Highlands is in a polygon region. Coordinates of the polygon are as follows: longitude (from west to east), 27 and 52◦E; latitude (from south to north), 17◦S, 20 and
25, 35◦N. Sierra Madre domain is 120–90◦W, 15–30◦N.
The Andes domain is 90–60◦W, 40◦S–10◦N. The regions
are depicted as the black contour in Fig. 5. The domain de-tails of orography to be modified are also seen in Table 2.
“Remove sensible heating”: the vertical diffusion heating at the atmospheric model bottom in the planet boundary layer scheme is set to zero (∂T /∂z=0)in each step of the model’s integration. Here theT denotes the temperature tendency due to heating, and∂/∂zdenotes the vertical diffusion at the low-est level of the atmospheric model.
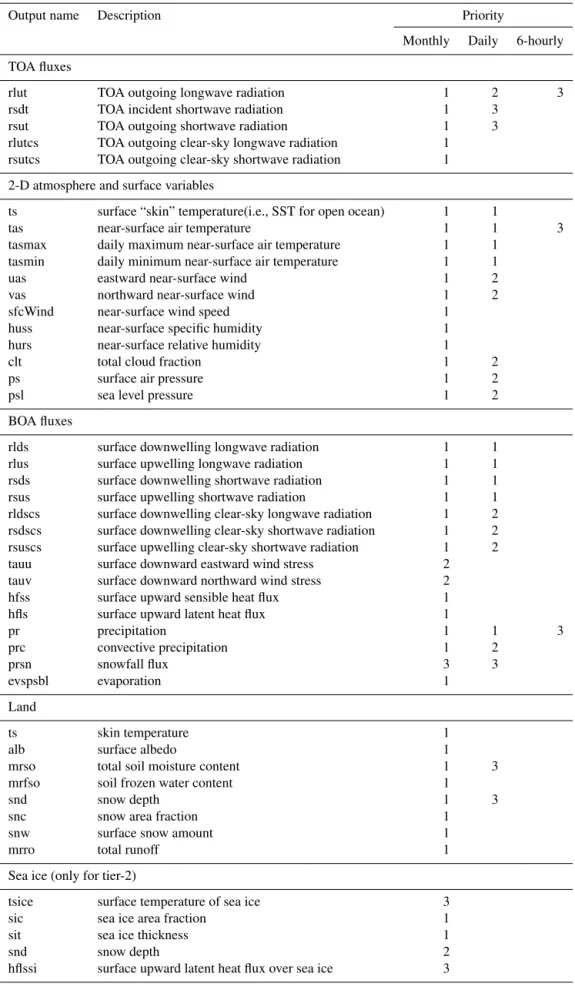
Table C1.Recommended GMMIP output. The variables in ocean and sea ice realms are only for tier-2 experiments.
Output name Description Priority
Monthly Daily 6-hourly
TOA fluxes
rlut TOA outgoing longwave radiation 1 2 3
rsdt TOA incident shortwave radiation 1 3
rsut TOA outgoing shortwave radiation 1 3
rlutcs TOA outgoing clear-sky longwave radiation 1 rsutcs TOA outgoing clear-sky shortwave radiation 1
2-D atmosphere and surface variables
ts surface “skin” temperature(i.e., SST for open ocean) 1 1
tas near-surface air temperature 1 1 3
tasmax daily maximum near-surface air temperature 1 1
tasmin daily minimum near-surface air temperature 1 1
uas eastward near-surface wind 1 2
vas northward near-surface wind 1 2
sfcWind near-surface wind speed 1
huss near-surface specific humidity 1
hurs near-surface relative humidity 1
clt total cloud fraction 1 2
ps surface air pressure 1 2
psl sea level pressure 1 2
BOA fluxes
rlds surface downwelling longwave radiation 1 1
rlus surface upwelling longwave radiation 1 1
rsds surface downwelling shortwave radiation 1 1
rsus surface upwelling shortwave radiation 1 1
rldscs surface downwelling clear-sky longwave radiation 1 2 rsdscs surface downwelling clear-sky shortwave radiation 1 2 rsuscs surface upwelling clear-sky shortwave radiation 1 2
tauu surface downward eastward wind stress 2
tauv surface downward northward wind stress 2
hfss surface upward sensible heat flux 1
hfls surface upward latent heat flux 1
pr precipitation 1 1 3
prc convective precipitation 1 2
prsn snowfall flux 3 3
evspsbl evaporation 1
Land
ts skin temperature 1
alb surface albedo 1
mrso total soil moisture content 1 3
mrfso soil frozen water content 1
snd snow depth 1 3
snc snow area fraction 1
snw surface snow amount 1
mrro total runoff 1
Sea ice (only for tier-2)
tsice surface temperature of sea ice 3
sic sea ice area fraction 1
sit sea ice thickness 1
snd snow depth 2
Table C1.Continued.
Output name Description Priority
Monthly Daily 6-hourly
strairx xcomponent of atmospheric stress on sea ice 3
strairy ycomponent of atmospheric stress on sea ice 3
transix xcomponent of sea ice mass transport 3
transiy ycomponent of sea ice mass transport 3
2-D ocean (only for tier-2; preferably on regular grid)
Physical variables
tos sea surface temperature 1
hfnorth northward ocean heat transport 2
sltnorth northward ocean salt transport 2
zos sea surface height 1
zossq square of sea surface height above geoid 2
zosga global average sea level change 2
zossga global average steric sea level change 2
zostoga global average thermosteric sea level change 2
volo sea water volume 2
hfds downward heat flux at sea water surface 1
vsf virtual salt flux into sea water (or equivalent fresh water flux) 1
Biophysical variables (only for tier-2; for ESMs)
intpp primary organic carbon production 2
epc100 downward flux of particle organic carbon 2
epcalc100 downward flux of calcite 2
epsi100 downward flux of particulate silica 2
phyc phytoplankton carbon concentration at surface 2
chl total chlorophyll mass concentration at surface 2
spco2 surface aqueous partial pressure of CO2 2
fgco2 gas exchange flux of CO2(positive into ocean) 2
3-D atmosphere (1000, 925, 850, 700, 600, 500, 400, 300, 250, 200, 150, 100, 70, 50, 30, 20, 10 hPa)
ta air temperature 1
ta850 air temperature at 850 hPa 1
ua eastward wind 1 2
va northward wind 1 2
wap lagrangian tendency of air pressure 1 2
zg geopotential height 1
zg500 geopotential height at 500 hPa 1
hus specific humidity 1 2
hur relative humidity 1
co2 (For ESMs) mole fraction of CO2 2
3-D ocean (only for tier-2; preferably on a regular grid at standard levels)
Physical variables
thetao sea water potential temperature 1
so sea water salinity 1
uo sea waterxvelocity 1
vo sea wateryvelocity 1
wo sea waterzvelocity 1
Biophysical variables (only for tier-2; for ESMs)
dissic dissolved inorganic carbon concentration 2
talk total alkalinity 2
no3 dissolved nitrate concentration 2
Acknowledgements. Tianjun Zhou acknowledges the support of International Big Science Project funded by Chinese Academy of Sciences (no. 134111KYSB20160031), and National Natural Science Foundation of China under grant nos. 41330423 and 41125017. Bo Wu acknowledges the support of R&D Special Fund for Public Welfare Industry (meteorology) (GYHY201506012). Andrew G. Turner acknowledges the support of the National Centre for Atmospheric Sciences, Climate Directorate. Bin Wang from IAP acknowledges the support of National Basic Research Program of China under grant no. 2014CB441302. Yun Qian’s contribution is supported by the U.S. Department of Energy’s Office of Science as part of the Earth System Modeling Program. The Pacific Northwest National Laboratory is operated for DOE by Battelle Memorial Institute under contract DE-AC05-76RL01830. Xiaolong Chen acknowledges the support of China Postdoctoral Science Foundation under grant no. 2015M581152.
Edited by: R. Neale
Reviewed by: W. R. Boos and one anonymous referee
References
Annamalai, H., Hafner, J., Sooraj, K. P., and Pillai, P.: Global warm-ing shifts the monsoon circulation, drywarm-ing South Asia, J. Climate, 26, 2701–2718, 2013.
Bollassina, M. A., Ming, Y., and Ramaswamy,V.: Anthropogenic aerosols and the weakening of the South Asian summer mon-soon, Science, 224, 502–505, 2011.
Boer, G. J., Smith, D. M., Cassou, C., Doblas-Reyes, F., Danaba-soglu, G., Kirtman, B., Kushnir, Y., Kimoto, M., Meehl, G. A., Msadek, R., Mueller, W. A., Taylor, K., and Zwiers, F.: The Decadal Climate Prediction Project, Geosci. Model Dev. Dis-cuss., doi:10.5194/gmd-2016-78, in review, 2016.
Boos, W. R. and Kuang, Z. M.: Dominant control of the South Asian monsoon by orographic insulation vs. plateau heating, Nature, 463, 218–223, 2010.
Boos, W. R. and Kuang, Z. M.: Sensitivity of the South Asian mon-soon to elevated and non-elevated heating, Sci. Rep., 3, 1192, doi:10.1038/srep01192, 2013.
Chen, H., Zhou T., Neale, R. B., Wu, X., and Zhang, G. J.: Perfor-mance of the new NCAR CAM3.5 in East Asian summer mon-soon simulations: Sensitivity to modifications of the convection scheme, J. Climate, 23, 3657–3675, 2010.
Chen, X. and Zhou, T.: Relative role of tropical SST forcing in the 1990s periodicity change of the Pacific-Japan pattern interannual variability, J. Geophys. Res., 119, 13043–13066, 2014.
Chen, X. and Zhou, T.: Distinct effects of global mean warming and regional seasurface warming pattern on projected uncertain-tyin the South Asian summer monsoon, Geophys. Res. Lett., 42, 9433–9439, 2015.
Cherchi, A., Alessandri, A., Masina, S., and Navarra A,: Effects of increased CO2levels on monsoons, Clim. Dynam., 37, 83–101, 2011.
Compo, G. P., Whitaker, J. S., Sardeshmukh, P. D., Matsui, N., Al-lan, R. J., Yin, X., Gleason, B. E., Vose, R. S., Rutledge, G., Bessemoulin, P., Brönnimann, S., Brunet, M., Crouthamel, R. I., Grant, A. N., Groisman, P. Y., Jones, P. D., Kruk, M., Kruger, A. C., Marshall, G. J., Maugeri, M., Mok, H. Y., Nordli, Ø., Ross,
T. F., Trigo, R. M., Wang, X. L., Woodruff, S. D., and Worley S. J.: The Twentieth Century Reanalysis Project, Q. J. Roy. Meteor. Soc., 137, 1–28, 2011.
Cook, B. I. and Seager, R.: The response of the North American Monsoon to increased greenhouse gas forcing, J. Geophys. Res., 118, 1690–1699, 2013.
Cook, K. H., Meehl, G. A., and Arblaster, J. M.: Monsoon regimes and processes in CCSM4. Part II: African and American mon-soon systems, J. Climate, 25, 2609–2621, 2012.
Endo, H. and Kitoh, A.: Thermodynamic and dynamic effects on re-gional monsoon rainfall changes in a warmer climate, Geophys. Res. Lett., 41, 1704–1710, 2014.
Enfield, D., Mestas-Nuñez, A., and Trimble, P.: The Atlantic Mul-tidecadal Oscillation and its relation to rainfall and river flows in the continental U.S., Geophys. Res. Lett., 28, 2077–2080, doi:10.1029/2000GL012745, 2001.
Eyring, V., Bony, S., Meehl, G. A., Senior, C. A., Stevens, B., Stouffer, R. J., and Taylor, K. E.: Overview of the Coupled Model Intercomparison Project Phase 6 (CMIP6) experimen-tal design and organization, Geosci. Model Dev., 9, 1937–1958, doi:10.5194/gmd-9-1937-2016, 2016.
Flohn, H.: Large-scale aspects of the “summer monsoon” in South and East Asia, J. Meteorol. Soc. Jpn., 11, 180–186, 1957. Folland, C. K., Palmer, T. N., and Parker, D. E.: Sahelian rainfall
and worldwide sea temperatures 1901–1985, Nature, 320, 602– 607, 1986.
Folland, C. K., Renwick, J. A., and Salinger, M. J., Mullan A. B.: Relative influences of the Interdecadal Pacific Oscillation and ENSO on the South Pacific Convergence Zone, Geophys. Res. Lett., 29, 1643, doi:10.1029/2001GL014201, 2002.
Gaetani, M. and Mohino, E.: Decadal prediction of the Sahelian precipitation in CMIP5 simulations, J. Climate, 26, 7708–7719, 2013.
Goswami, B. N., Madhusoodanan, M. S., Neema, C. P., and Sen-gupta, D.: A physical mechanism for North Atlantic SST influ-ence on the Indian summer monsoon, Geophys. Res. Lett., 33, L02706, doi:10.1029/2005GL024803, 2006.
Guo, Z., Zhou, T., Wang, M., and Qian, Y.: Impact of cloud radiative heating on East Asian summer monsoon circulation, Environ. Res. Lett., 10, 074014, doi:10.1088/1748-9326/10/7/074014, 2015.
Gutowski Jr., W. J., Giorgi, F., Timbal, B., Frigon, A., Jacob, D., Kang, H.-S., Krishnan, R., Lee, B., Lennard, C., Nikulin, G., O’Rourke, E., Rixen, M., Solman, S., Stephenson, T., and Tan-gang, F.: WCRP COordinated Regional Downscaling EXperi-ment (CORDEX): A diagnostic MIP for CMIP6, Geosci. Model Dev. Discuss., doi:10.5194/gmd-2016-120, in review, 2016. Haarsma, R. J., Roberts, M., Vidale, P. L., Senior, C. A., Bellucci,
A., Bao, Q., Chang, P., Corti, S., Fuckar, N. S., Guemas, V., von Hardenberg, J., Hazeleger, W., Kodama, C., Koenigk, T., Leung, L. R., Lu, J., Luo, J.-J., Mao, J., Mizielinski, M. S., Mizuta, R., Nobre, P., Satoh, M., Scoccimarro, E., Semmler, T., Small, J., and von Storch, J.-S.: High Resolution Model In-tercomparison Project (HighResMIP), Geosci. Model Dev. Dis-cuss., doi:10.5194/gmd-2016-66, in review, 2016.
He, B., Yang, S., and Li Z.: Role of atmospheric heating over the South China Sea and western Pacific regions in modulating Asian summer climate under the global warming background, Clim. Dynam., 46, 2897–2908, 2016.
Hoerling, M., Hurrell, J., Eischeid, J., and Phillips, A.: Detection and Attribution of Twentieth-Century Northern and Southern African Rainfall Change, J. Climate, 19, 3989–4008, 2006. Hurrell, J., Hack, J., Shea, D., Caron, J., and Rosinski J.: A new sea
surface temperature and sea ice boundary data set for the Com-munity Atmosphere Model, J. Climate, 21, 5145–5153, 2008. Kitoh, A., Endo, H., Krishna Kumar, K., Cavalcanti, I. F., Goswami,
P., and Zhou, T.: Monsoons in a changing world, a regional per-spective in a global context, J. Geophys. Res., 118, 3053–3065, doi:10.1002/jgrd.50258, 2013.
Kosaka, K. and Xie, S.-P.: Recent global-warming hiatus tied to equatorial Pacific surface cooling, Nature, 501, 403–407, 2013. Lau, K. M., Tsay, S. C., Hsu, C., Chin, M., Ramanathan, V., Wu,
G. X., Li, Z., Sikka, R., Holben, B., Lu, D., Chen, H., Tartari, G., Koudelova, P., Ma, Y., Huang, J., Taniguchi, K., and Zhang, R.: The joint aerosol–monsoon experiment: A new challenge for monsoon climate research, B. Am. Meteorol. Soc., 89, 369–383, 2008.
Li, H., Dai, A., Zhou, T., and Lu, J.: Responses of East Asian sum-mer monsoon to historical SST and atmospheric forcing during 1950–2000, Clim. Dynam., 34, 501–514, doi:10.1007/s00382-008-0482-7, 2010.
Lin, R., Zhou, T., and Qian, Y.: Evaluation of Global Monsoon pre-cipitation changes based on five reanalysis datasets, J. Climate, 27, 1271–1289, 2014.
Liu, J., Wang, B., Cane, M. A., Yim, S. Y., and Lee, J. Y.: Diver-gent global precipitation changes induced by natural vs. anthro-pogenic forcing, Nature, 493, 656–659, 2013.
Lu, R., Dong, B., and Ding, H.: Impact of the Atlantic Multidecadal Oscillation on the Asian summer monsoon, Geophys. Res. Lett. 33, L24701, doi:10.1029/2006GL027655, 2006.
Mantua, N. J. and Hare, S. R.: The Pacific Decadal Oscillation, J. Oceanogr., 58, 35–44, 2002.
Meehl, G. A. and Hu, A.: Megadroughts in the Indian Monsoon region and Southwest North America and a mechanism for asso-ciated multidecadal Pacific sea surface temperature anomalies, J. Climate, 19, 1605–1623, 2006.
Menon, S., Hansen, J., Nazarenko, L., and Luo, Y.: Climate effects of black carbon aerosols in China and India, Science, 297, 2250– 2253, 2002.
Parthasarathy, B., Munot, A. A., and Kothawale, D. R.: All India monthly and seasonal rainfall series: 1871–1993, Theor. Appl. Climatol., 49, 217–224, 1994.
Poli, P., Hersbach, H., Dee, D. P., Berrisford, P., Simmons, A. J., Vitart, F., Laloyaux, P., Tan, D. G. H., Peubey, C., Thépaut, J.-N., Trémolet, Y., Hólm, E. V., Bonavita, M., Isaksen, L., and Fisher, M.: ERA-20C: An Atmospheric Reanalysis of the Twen-tieth Century, J. Climate, 29, 4083–4097, 2016.
Polson, D., Bollasina, M., Hegerl, G. C., and Wilcox, L. J.: De-creased monsoon precipitation in the Northern Hemisphere due to anthropogenic aerosols, Geophys. Res. Lett., 41, 6023–6029, 2014.
Power, S., Casey, T., Folland, C., Colman, A., and Mehta V.: Inter-decadal modulation of the impact of ENSO on Australia, Clim. Dynam., 15, 319–324, 1999.
Qian, C. and Zhou, T.: Multidecadal variability of North China arid-ity and its relationship to PDO during 1900–2010, J. Climate, 27, 1210–1222, 2014.
Qian, Y. and Giorgi, F.: Interactive coupling of regional climate and sulfate aerosol models over East Asia, J. Geophys. Res., 104, 6477–6499, 1999.
Qian, Y., Kaiser, D. P., Leung, L. R., and Xu, M.: More frequent cloud-free sky and less surface solar radiation in China from 1955 to 2000, Geophys. Res. Lett., 33, L01812, doi:10.1029/2005GL024586, 2006.
Qian Y., Gong, D., Fan, J., Leung, L. R., Bennartz, R., Chen, D., and Wang, W.: Heavy pollution suppresses light rain in China: observations and modeling, J. Geophys. Res., 114, D00K02, doi:10.1029/2008JD011575, 2009.
Qian, Y., Flanner, M. G., Leung, L. R., and Wang, W.: Sensitiv-ity studies on the impacts of Tibetan Plateau snowpack pollu-tion on the Asian hydrological cycle and monsoon climate, At-mos. Chem. Phys., 11, 1929–1948, doi:10.5194/acp-11-1929-2011, 2011.
Qian, Y., Yasunari, T. J., Doherty, S. J., Flanner, M. G., Lau, W. K., Ming, J., Wang, H., Wang, M., Warren, S. G., and Zhang, R.: Light-absorbing particles in snow and ice: Measurement and modeling of climatic and hydrological impact, Adv. Atmos. Sci., 32, 64–91, doi:10.1007/s00376-014-0010-0, 2015.
Qiu, J.: Monsoon melee, Science, 340, 1400–1401, 2013.
Schneider, T., Bischoff, T., and Haug, G. H.: Migrations and dy-namics of the intertropical convergence zone, Nature, 513, 45– 53, 2014.
Slingo, J., Spencer, H., Hoskins, B., Berrisford, P., and Black, E.: The meteorology of the Western Indian Ocean, and the influence of the East African Highlands, Philos. T. Roy. Soc. A, 363, 25– 42, doi:10.1098/rsta.2004.1473, 2005.
Song, F. and Zhou, T.: Interannual variability of East Asian sum-mer monsoon simulated by CMIP3 and CMIP5 AGCMs: Skill dependence on Indian Ocean–western Pacific anticyclone tele-connection, J. Climate, 27, 1679–1697, 2014a.
Song F. and Zhou, T.: The climatology and inter-annual variability of East Asian summer monsoon in CMIP5 coupled models: Does air-sea coupling improve the simulations?, J. Climate, 27, 8761– 8777, 2014b.
Song, F., Zhou, T., and Qian Y.: Responses of East Asian sum-mer monsoon to natural and anthropogenic forcings in the 17 latest CMIP5 models, Geophys. Res. Lett., 41, 596–603, doi:10.1002/2013GL058705, 2014.
Sperber, K. R., Annamalai, H., Kang, I. S., Kitoh, A., Moise, A., Turner, A., Wang B., and Zhou, T.: The Asian summer monsoon: an intercomparison of CMIP5 vs. CMIP3 simula-tions of the late 20th century, Clim. Dynam., 41, 2771–2744, doi:10.1007/s00382-012-1607-6, 2013.
Stainforth, D. A., Aina, T., Christensen, C., Collins, M., Faull, N., Frame, D. J., Kettleborough, J. A., Knight, S., Martin, A., Mur-phy, J. M., Piani, C., Sexton, D., Smith, L. A., Spicer, R. A., Thorpe A. J., and Allen, M. R.: Uncertainty in predictions of the climate response to rising levels of greenhouse gases, Nature, 433, 403–406, 2005.
Trenberth, K., Stepaniak, D., and Caron, J.: The global monsoon as seen through the divergent atmospheric circulation, J. Climate, 13, 3969–3993, 2000.
Trenberth, K. E. and Shea, D. J.: Atlantic hurricanes and nat-ural variability in 2005, Geophys. Res. Lett., 33, L12704, doi:10.1029/2006GL026894, 2006.
Turner, A. G., Inness, P. M., and Slingo, J. M.: The role of the ba-sic state in the ENSO-monsoon relationship and implications for predictability, Q. J. Roy. Meteor. Soc., 131, 781–804, 2005. Wang, B.: Climatic regimes of tropical convection and rainfall, J.
Climate, 7, 1109–1118, 1994.
Wang, B. and Ding, Q.: Changes in global monsoon precipita-tion over the past 56 years, Geophys. Res. Lett., 33, L06711, doi:10.1029/2005GL025347, 2006.
Wang, B. and Ding, Q.: Global monsoon: Dominant mode of annual variation in the tropics, Dynam. Atmos. Oceans, 44, 165–183, 2008.
Wang, B., Ding, Q. H., Fu, X. H., Kang, I. S., Jin, K., Shukla, J., and Doblas-Reyes, F.: Fundamental challenge in simulation and prediction of summer monsoon rainfall, Geophys. Res. Lett., 32, L15711, doi:10.1029/2005GL022734, 2005.
Wang, B., Liu, J., Kim, H. J., Webster, P. J., and Yim, S. Y.: Recent Change of the Global Monsoon Precipitation (1979–2008), Clim. Dynam., 39, 1123–1135, 2012.
Wang, B., Liu, J., Kim, H. J., Webster, P. J., Yim, S. Y., and Xiang, B.: Northern Hemisphere summer monsoon intensi-fied by mega-El Niño/southern oscillation and Atlantic mul-tidecadal oscillation, P. Natl. Acad. Sci., 110, 5347–5352, doi:10.1073/pnas.1219405110, 2013.
Wang, P. X., Wang, B., Cheng, H., Fasullo, J., Guo, Z. T., Kiefer, T., and Liu, Z. Y.: The global monsoon across timescales: coher-ent variability of regional monsoons, Clim. Past, 10, 2007–2052, doi:10.5194/cp-10-2007-2014, 2014.
Wu, G., Liu, Y., Zhang, Q., Duan, A., Wang, T., Wan, R., Liu, X., Li, W., Wang, Z., and Liang X.: The influence of the mechanical and thermal forcing of the Tibetan Plateau on the Asian climate, J. Hydrometeorol., 8, 770–789, 2007.
Wu, G., Liu, Y., He, B., Bao, Q., Duan A., and Jin, F. F.: Ther-mal controls on the Asian summer monsoon, Sci. Rep. 2, 404, doi:10.1038/srep00404, 2012.
Wu, G., Zhuo, H., Wang, Z., and Liu Y.: Two types of summer-time heating over the Asian large-scale orography and excita-tion of potential-vorticity forcing I. Over Tibetan Plateau, Sci. China Earth Sci., 59, 1996–2008, doi:10.1007/s11430-016-5328-2, 2016.
Yanai, M. and Wu, G. X.: Effects of the Tibetan plateau, in: The Asian Monsoon, edited by: Wang, B., Springer, New York, USA, 513–549, 2006.
Yeh, T. C. and Wu, G.: The role of the heat source of the Ti-betan Plateau in the general circulation, Meteor. Atmos. Phys., 67, 181–198, 1998.
Yeh, T. C., Lo, S., and Chu, P.: The wind structure and heat balance in the lower troposphere over Tibetan Plateau and its surround-ing, Acta Meteorol. Sin., 28, 108–121, 1957.
Yim, S. Y., Wang. B., and Kwon M.: Interdecadal change of the con-trolling mechanisms for East Asian early summer rainfall varia-tion around the mid-1990s, Clim. Dynam., 42, 1325–1333, 2014. Zhang, L. and Zhou, T.: An assessment of monsoon precipita-tion changes during 1901–2001, Clim. Dynam., 37, 279–296, doi:10.1007/s00382-011-0993-5, 2011.
Zhang, R. and Delworth, T. L.: Impact of Atlantic multidecadal os-cillations on India/Sahel rainfall and Atlantic hurricanes, Geo-phys. Res. Lett., 33, L17712, doi:10.1029/2006GL026267, 2006. Zhou, T., Yu, R., Li, H., and Wang, B.: Ocean forcing to changes in global monsoon precipitation over the recent half-century, J. Climate, 21, 3833–3852, 2008a.
Zhou, T., Zhang, L., and Li, H.: Changes in global land monsoon area and total rainfall accumulation over the last half century, Geophys. Res. Lett., 35, L16707, doi:10.1029/2008GL034881, 2008b.
Zhou T., Wu, B., and Wang, B.: How well do atmospheric gen-eral circulation models capture the leading modes of the inter-annual variability of the Asian-Australian Monsoon?, J. Climate, 22, 1159–1173, 2009a.
Zhou, T., Gong, D., Li, J., and Li, B.: Detecting and understanding the multi-decadal variability of the East Asian Summer Monsoon – Recent progress and state of affairs, Meteorol. Z., 18, 455–467, 2009b.