www.the-cryosphere.net/9/957/2015/ doi:10.5194/tc-9-957-2015
© Author(s) 2015. CC Attribution 3.0 License.
Evolution of surface velocities and ice discharge of Larsen B outlet
glaciers from 1995 to 2013
J. Wuite1, H. Rott1,2, M. Hetzenecker1, D. Floricioiu3, J. De Rydt4, G. H. Gudmundsson4, T. Nagler1, and M. Kern5 1ENVEO IT GmbH, Innsbruck, Austria
2Institute for Meteorology and Geophysics, University of Innsbruck, Austria
3Institute for Remote Sensing Technology, German Aerospace Center, Oberpfaffenhofen, Germany 4British Antarctic Survey, Cambridge, UK
5ESA-ESTEC, Noordwijk, the Netherlands
Correspondence to: J. Wuite ([email protected])
Received: 2 December 2014 – Published in The Cryosphere Discuss.: 23 December 2014 Revised: 10 April 2015 – Accepted: 17 April 2015 – Published: 9 May 2015
Abstract. We use repeat-pass SAR data to produce detailed maps of surface motion covering the glaciers draining into the former Larsen B Ice Shelf, Antarctic Peninsula, for dif-ferent epochs between 1995 and 2013. We combine the ve-locity maps with estimates of ice thickness to analyze fluctu-ations of ice discharge. The collapse of the central and north-ern sections of the ice shelf in 2002 led to a near-immediate acceleration of tributary glaciers as well as of the remnant ice shelf in Scar Inlet. Velocities of most of the glaciers dis-charging directly into the ocean remain to date well above the velocities of the pre-collapse period. The response of in-dividual glaciers differs and velocities show significant tem-poral fluctuations, implying major variations in ice discharge as well. Due to reduced velocity and ice thickness the ice dis-charge of Crane Glacier decreased from 5.02 Gt a−1in 2007 to 1.72 Gt a−1in 2013, whereas Hektoria and Green glaciers continue to show large temporal fluctuations in response to successive stages of frontal retreat. The velocity on Scar In-let ice shelf increased 2–3-fold since 1995, with the largest increase in the first years after the break-up of the main sec-tion of Larsen B. Flask and Leppard glaciers, the largest trib-utaries to Scar Inlet ice shelf, accelerated. In 2013 their dis-charge was 38 % and 46 % higher than in 1995.
1 Introduction
Atmospheric warming and changes in ocean conditions dur-ing the past decades led to wide-spread retreat of ice shelves around the Antarctic Peninsula (API) (Cook and Vaughan, 2010). Progressive retreat culminated in the final disintegra-tion of the Larsen A Ice Shelf in January 1995 and of the northern and central sections of the Larsen B Ice Shelf in March 2002 (Rott et al., 1996; Rack and Rott, 2004; Glasser and Scambos, 2008). The glaciers flowing from the Antarctic Peninsula plateau, previously feeding the ice shelves, became tidewater glaciers. Most of these glaciers accelerated signifi-cantly, resulting in increased ice discharge (Rott et al., 2002; De Angelis and Skvarca, 2003; Rignot et al., 2004; Scambos et al., 2004). The response of these glaciers to ice-shelf dis-integration is of particular interest not only for quantifying the contributions of API outlet glaciers to sea level rise, but also for studying processes of ice shelf retreat and its inter-actions with grounded ice (Vieli and Payne, 2005; Hulbe et al., 2008).
B glaciers in recent years have been derived from changes in surface topography. Shuman et al. (2011) and Scambos et al. (2011) tracked elevation changes over the period 2001 to 2009 using optical stereo imagery and laser altimetry of ICE-Sat (Ice, Cloud and Land Elevation ICE-Satellite) and of the ATM (airborne thematic mapper) sensor. Shuman et al. (2011) re-ported a combined mass loss of 8.4 Gt a−1for these glaciers for the period 2001 to 2006, excluding ice lost by frontal re-treat. Berthier et al. (2012) explained that the mass loss of former Larsen B tributary glaciers continued at almost the same rate over the period 2002 to 2011, reporting a mass loss rate of 9.04 Gt a−1 for the period 2006 to 2010/2011. Scambos et al. (2014) used satellite laser altimetry and satel-lite stereo-imagery to map ice elevation change and inferred mass changes for 33 glacier basins of the northern API over the time span 2001–2010. They report a mass balance of
−7.9 Gt a−1 for the tributaries to the Larsen B embayment and−1.4 Gt a−1for the tributaries to the remnant ice shelf in Scar Inlet.
These reports provide estimates of mass depletion for the Larsen B tributaries integrated over multi-year periods. Here we present a new analysis of satellite data showing the spatial and temporal variability in velocities over the whole Larsen B area dating back to 1995. We have included new satellite data not used in any previous studies so far, and have also re-processed satellite radar images to generate fully consistent and comparable data sets on surface velocities. Our work in-cludes both recent acquisitions by high resolution radar sen-sors as well as archived data, some of which have not been exploited until now. Velocity data and estimates of ice thick-ness are used to derive ice discharge at different epochs, showing significant temporal variability as well. The data sets provide a comprehensive basis for studying the dynamic response of the ice masses to the disintegration of Larsen B, including the glaciers that are draining now directly into the ocean as well as the remnant ice shelf in Scar Inlet and its tributary glaciers.
2 Data and methods
We derived maps of ice flow velocities from repeat-pass Syn-thetic Aperture Radar (SAR) data of the satellite missions ERS-1, ERS-2, Envisat, TerraSAR-X (TSX), and ALOS, ap-plying either offset tracking or SAR interferometry (InSAR). The source data were obtained from the archives at the Euro-pean Space Agency (ESA) and the German Aerospace Cen-ter (DLR). We retrieved two-dimensional surface displace-ment in radar geometry which we projected onto the surface, defined by the ASTER-based Antarctic Peninsula digital el-evation model (API-DEM) of Cook et al. (2012), in order to produce maps of surface velocities. The maps of the surface velocity vector are provided in Antarctic polar stereographic projection resampled to a 50 m grid. The DEM is compiled from ASTER scenes from a range of dates between 2000 and
2009 which are unspecified in the final product (Cook et al., 2012). During this period various glaciers have been subject to major drawdown. The sensitivity analysis on the impact of possible DEM errors shows that even in extreme cases of surface lowering the induced error in geocoded velocity is below 1 %.
The spatial resolution of the SAR images along the flight track and in radar line of sight (LOS) ranges from 3.3 m×1.2 m for TSX to 5.6 m×9.6 m for the Advanced Synthetic Aperture Radar (ASAR) of Envisat. The time span of the repeat pass image pairs ranges from one day for ERS-1/ERS-2 tandem images to 46 days for ALOS Phased Ar-ray L-band SAR (PALSAR) images. Because of temporal decorrelation of the phase of the backscatter signal the inter-ferometric (InSAR) method could only be applied for ERS-1/ERS-2 tandem images, available on several dates of the years 1995 to 1999. InSAR data of a single swath provide the surface displacement in LOS. We combined image pairs of ascending and descending orbits to derive 2-D velocity fields for the period late 1995 to early 1996. Being well be-fore the collapse of the Larsen B Ice Shelf, this period is of particular importance as reference for studying the impact of ice shelf disintegration on tributary glaciers. For 1999, ERS SAR data were available only from single view direction. As-suming unaltered flow direction since 1995/1996, we derived velocity maps in November 1999, using the argument from the velocity vectors of crossing orbits.
For retrieving maps of ice motion from the TSX SAR, En-visat ASAR and ALOS PALSAR we apply the offset track-ing technique which is based on cross-correlation of tem-plates in SAR amplitude images. Offset tracking delivers along track and LOS velocity components from a single im-age pair. It is less sensitive to displacement than InSAR, but this drawback is (at least partly) compensated by the longer time span between the repeat pass images (Rott, 2009). We used templates of 64×64 and 96×96 pixels size and ap-plied sampling steps of 10 pixels for generating velocity maps. TSX images are our main data sources for velocity maps between 2007 and 2013, complemented by occasion-ally available ALOS PALSAR data. Envisat ASAR data are the basis for velocity maps for 2003 to 2006 on large glaciers and on the Scar Inlet ice shelf.
uncertainty of 0.2 fringes for the moving ice shelf and of 0.5 fringes for the reference points, the uncertainty in horizontal velocity of floating ice is±0.04 m d−1.
For offset tracking, the accuracy depends on the pixel size, the time interval, and the quality of features in order to obtain good correlation peaks. We excluded areas of low correla-tion, so that the uncertainty for the retrieval of displacement is in the order of 0.2 to 0.3 pixels. The resulting uncertainties in the magnitude of surface motion are±0.05 m d−1for TSX SAR,±0.08 m d−1for ALOS PALSAR and±0.15 m d−1for Envisat ASAR.
The mass flux across a gate of widthY [m] near the calving front or grounding line is computed according to
FY =ρice y=Y Z
y=0
um(y)sinθ H (y )
dy, (1)
whereρiceis the density of ice,umis the vertically averaged horizontal velocity,θis the angle between the velocity vec-tor and the gate, H is the ice thickness. We use a column-averaged ice density of 900 kg m−3 to convert ice volume into mass. For calving glaciers, full sliding is assumed across calving fronts, so thatumcorresponds to the surface velocity,
us, obtained from satellite data. For glaciers discharging into the ice shelf, we estimate the ice deformation at the flux gates applying the laminar flow approximation (Paterson, 1994) using a rate factor as derived by Hulbe et al. (2008) for out-let glaciers to Larsen B. The results show moderate values of deformation velocities. For Crane Glacier, the resulting ver-tically averaged velocity (pre-collapse) is um=0.96us; for other glaciers, um=0.95us. Ice thickness at the flux gates is obtained from various sources. For Flask and Starbuck glaciers, radar sounding data are available (Farinotti et al., 2013, 2014). For Crane Glacier, the cross section of the calv-ing gate is deduced from bathymetric data (Zgur et al., 2007; Rott et al., 2011). For Leppard Glacier, ice thickness data of Huss and Farinotti (2014) are used. For calving fluxes of Crane, Hektoria and Green glaciers, the ice thickness in the center of the flux gate is estimated from surface height above sea level assuming flotation. The central sections of these glacier fronts have been floating at least since 2007. The surface elevation near the calving front is obtained from laser ranging data of ICESat and the ATM (Shuman et al., 2011; Krabill and Thomas, 2013, 2014) and in 2011 and 2013 also from digital elevation data of TanDEM-X (Krieger et al., 2013). For uncertainty estimates of mass fluxes through the gates, we assume±10 % error of the cross section area for Starbuck, Flask and Crane glaciers, and±20 % for Hektoria, Green, Jorum and Leppard glaciers. For velocity across the gate, we assume±5 % uncertainty.
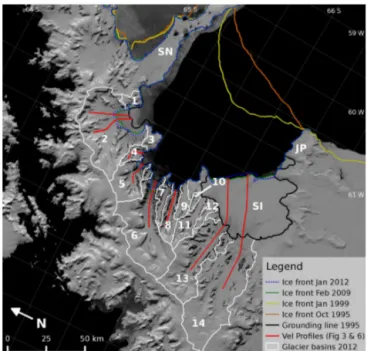
Figure 1. Overview map of glacier basins in the Larsen B region. Background: 2009 MODIS mosaic (Haran et al., 2014). Names and size of basins in Table 1. Glacier boundaries inland are based on the ASTER DEM (courtesy A. Cook). Coastlines and grounding line derived from ERS and Landsat images (ERS-1 and -2 were used). SN – Seal Nunataks, SI – Scar Inlet, JP – Jason Peninsula. Red lines show location of velocity profiles in Figs. 3 and 6.
3 Evolution of glacier velocities
3.1 Velocities and frontal retreat of glaciers draining into Larsen B embayment
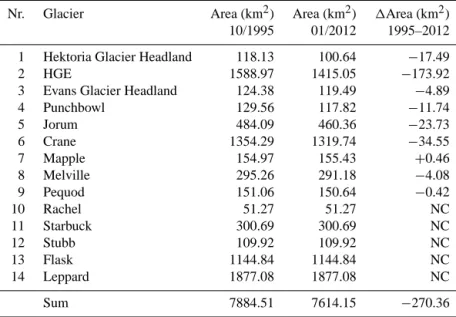
Table 1. Area of glacier basins (in km2)shown in Fig. 1 above the October 1995 grounding line and updated for glacier fronts on 12 January 2012, and change of glacier area 1995 to 2012. NC – no significant change of front position or grounding line. The areas of glacier basins include rock outcrops and mountain slopes.
Nr. Glacier Area (km2) Area (km2) 1Area (km2) 10/1995 01/2012 1995–2012
1 Hektoria Glacier Headland 118.13 100.64 −17.49
2 HGE 1588.97 1415.05 −173.92
3 Evans Glacier Headland 124.38 119.49 −4.89
4 Punchbowl 129.56 117.82 −11.74
5 Jorum 484.09 460.36 −23.73
6 Crane 1354.29 1319.74 −34.55
7 Mapple 154.97 155.43 +0.46
8 Melville 295.26 291.18 −4.08
9 Pequod 151.06 150.64 −0.42
10 Rachel 51.27 51.27 NC
11 Starbuck 300.69 300.69 NC
12 Stubb 109.92 109.92 NC
13 Flask 1144.84 1144.84 NC
14 Leppard 1877.08 1877.08 NC
Sum 7884.51 7614.15 −270.36
shelf collapse the frontal regions of HGE retreated quickly (Rack and Rott, 2004; Scambos et al., 2004), suggesting that they were lightly grounded and sensitive to changes in ice-shelf buttressing. The ice ice-shelf collapse resulted in the pro-gressive breakup of increasingly large areas of grounded ice concomitant with acceleration of ice flow and dynamic thin-ning, amounting to a total retreat of 174 km2 by January 2012. On Crane Glacier, the loss of grounded ice has been smaller (35 km2)because the terminus is confined in a nar-row fjord. Jorum Glacier lost 24 km2in grounded ice; Punch-bowl Glacier lost 12 km2, and Melville Glacier lost 4.1 km2. The frontal positions of Mapple and Pequod glaciers have been stationary.
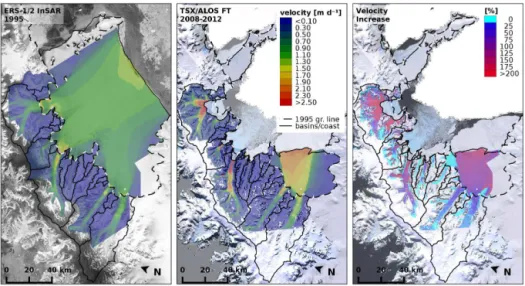
An overview map of surface velocities for the Larsen B region is shown in Fig. 2a for the year 1995 based on ERS InSAR data. As already reported by Rott et al. (2011), the 1995 velocities of outlet glaciers to Larsen-B agree within a few percent with the velocities retrieved from 1999 InSAR data. There is no indication for a significant temporal trend in velocity on any of the glaciers. The velocities, derived from InSAR data on various dates in 1995 and 1999 differ by less than 5 % at any of the flux gates. Varying tidal deformation along the ice shelf margins, observed in the different inter-ferograms, did not affect the ice motion at these flux gates which are located several kilometers inland of the 1995–1999 grounding zone.
Figure 2b is a composite of several velocity maps from TSX and ALOS PALSAR offset tracking analysis of the years 2008 to 2012. As the figures show, a major flow ac-celeration is observed for HGE, Jorum, and Crane glaciers. Flask and Leppard glaciers in Scar Inlet also accelerated, but at a lower rate. In order to investigate the temporal evolution
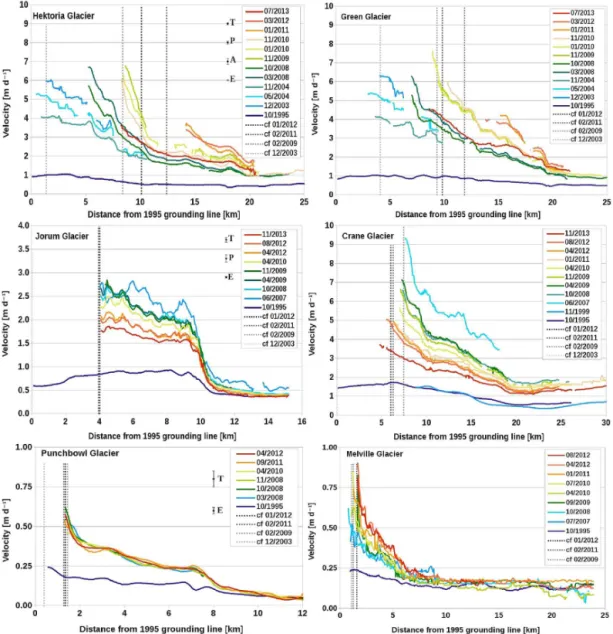
of velocities we extracted profiles along the central flow line of the main glaciers: Hektoria, Green, Jorum, Crane, Punch-bowl and Melville glaciers, now terminating with calving fronts (Fig. 3), and Flask and Leppard which are still con-fined by the remnant part of Larsen B Ice Shelf. The loca-tion of the profiles is charted in Fig. 1. The map of velocity changes (Fig. 2c) and the longitudinal profiles show that the flow acceleration extends far upstream on the large glaciers, whereas on the smaller glaciers the acceleration has been modest and confined to the lower part of the tongues.
The velocity of Hektoria and Green glaciers is presently still much higher than in 1995, but has been subject to strong variations since 2002 associated with glacier thinning and frontal retreat. The velocity profiles (Fig. 3) show periods of acceleration followed by gradual deceleration. In 2008 Hek-toria and Green glaciers still had a common terminal section, but the lower terminus was already heavily fractured (Fig. 4). In 2009 a major section along the front broke away leading to another rise in velocities. In November 2009 the frontal velocity of Hektoria and Green glaciers was about twice the velocity at the same point in October 2008. The high veloci-ties persisted until March 2012, after which significant slow-down and an interim advance of the floating tongues was ob-served in 2013.
Figure 2. Maps of glacier surface velocity in the Larsen B region. Left: based on ERS InSAR data of October/November 1995 (background RAMP mosaic; Jezek et al., 2013). Center: based on TSX and PALSAR offset tracking 2008–2012. Right: Velocity increase 2008–2012 vs. 1995. Background LIMA mosaic (Bindschadler et al., 2008). The dashed line shows the position of the 1995 grounding line. Front positions are from October 1995 (left) and January 2012 (center and right).
2008 glacier front decreased from 6.8 m d−1 in June 2007 to 5.2 m d−1 in November 2008 and October 2009, and to 2.9 m d−1in November 2013. Between 2003 and 2007 the strong acceleration of Crane Glacier caused dynamic thin-ning and subsidence on the order of 150 m on the lower ter-minus (Scambos et al., 2011). In spite of continued thinning, although with reduced rate, the position of the glacier front has been rather stable since 2006. The shape of the glacier bedrock in form of a deep canyon, inferred from bathymetric data, indicates that the central part of the lower terminus has been ungrounded for several years (Rott et al., 2011). This suggests that lateral drag plays a key role in maintaining the frontal position since 2006. Also the velocity of the Jorum Glacier terminus is still higher than before ice shelf collapse. As on Crane Glacier, the velocity decreased since 2007, but at smaller percentage.
The velocities of the glaciers that are originating east of the main ice divide are small, and the flow acceleration has been modest. On Punchbowl Glacier, the velocity at the central flow line near the calving gate increased from 0.20 m d−1in 1995 to 0.50 m d−1in 2008 to 2012, on Melville Glacier from 0.25 m d−1 in 1995 to 0.40 m d−1 in 2008 and 0.70 m d−1 in 2012 (Fig. 3). Whereas Punchbowl and Melville Glaciers have been subject to frontal retreat, the frontal positions of Mapple and Pequod glaciers have been stable. This is re-flected in the observed velocities near the front. On both glaciers, a temporary acceleration is observed in 2007: on Pe-quod Glacier from 0.29 m d−1in 1995 to 0.40 m d−1in 2007; on Mapple Glacier from 0.16 m d−1in 1995 to 0.21 m d−1in 2007. During the period 2008 to 2012 the velocities returned to the pre-collapse values.
The velocity variations of the outlet glaciers are clearly dominated by multi-annual trends triggered by ice shelf
dis-integration. On some of the glaciers, seasonal variations in velocity by a few per cent are observed, but not in every year. Compared to the long term trend this signal is not significant.
3.2 Velocities of Scar Inlet ice shelf and tributary glaciers
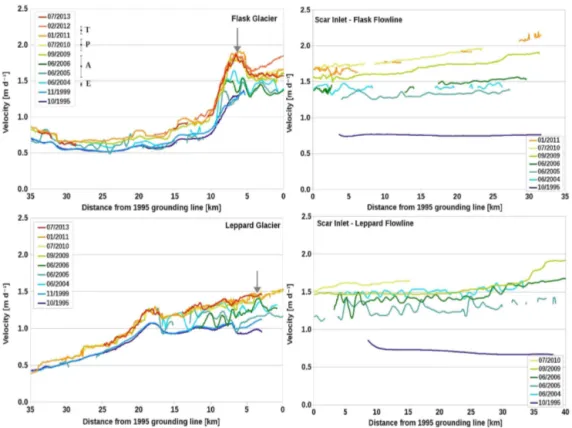
The area of the ice shelf in Scar Inlet decreased from 3463 km2 on 18 March 2002 (Rack and Rott, 2004) to 1870 km2in January 2012. The velocities on the ice shelf sec-tion which is nourished by Flask and Leppard glaciers in-creased 2–3-fold since 1995/1999. This section is separated by distinct shear zones from the ice shelf sections along Ja-son Peninsula and the section downstream of Starbuck and Stubb glaciers (Fig. 5). Major rifts are apparent on the ice shelf in the ASAR image of 28 January 2004, indicating that the disintegration of the main section of Larsen B Ice Shelf affected the stability of the remnant ice shelf in Scar Inlet rather soon. In June 2004 the velocities along the central flow lines downstream of Flask and Leppard glaciers had already doubled compared to the pre-collapse values (Fig. 6), another indication that the Larsen B disintegration event had a rather immediate impact on the stress field of Scar Inlet ice shelf. In the profiles of 1995 and 1999, based on one-day InSAR repeat pass data, we exclude the tidal deformation zone be-cause of ambiguity between horizontal motion and vertical displacement.
Figure 3. Surface velocities along the central flow line of Hektoria, Green, Jorum, Crane, Punchbowl and Melville glaciers and their frontal positions at different dates (month/year). Thexandyscales are different for individual glaciers. Vertical lines show positions of calving front. The vertical bars show uncertainties in velocity for TerraSAR-X (T) 2007 to 2013; PALSAR (P), November 2009; ASAR (A) 2003, 2004; ERS (E) 1995, 1999.
the velocity at the flux gate, 4 km above the grounding line, increased by 45 %. The signal of acceleration between the two periods extends more than 30 km up-glacier, with the velocity change decreasing with distance from the ground-ing zone. The acceleration of the glaciers is in line with sub-stantial acceleration of Scar Inlet ice shelf since 2002. The main speed-up happened before 2009. Between September 2009 and July 2013 the velocities have been rather stable. The smaller Rachel, Starbuck and Stubb glaciers do not show any significant change in velocities since 1995.
4 Temporal variations of ice discharge
Figure 4. Section of TerraSAR-X amplitude images. Left and cen-ter: HGE glaciers on 23 March 2008 and 25 March 2012, with flux gates on Hektoria (H) and Green (G) glaciers and location of the glacier front on 24 December 2004 (dotted blue line) and 25 March 2012 (dotted green line). Right: TSX image of Crane (C) and Jorum (J) glaciers on 22 April 2012 with flux gates.
time the two glaciers still formed a single calving front. The maximum velocity at the front was 4.23 m d−1(1545 m a−1)
and the maximum ice thickness at the (floating) calving gate, inferred from an ICESat profile, is estimated at 268 m. Be-cause of the retreat of the terminus by 4 km between 2008 and 2011, the gates for the 2010 and 2013 fluxes are shifted inland (Fig. 4). A transect of surface elevation on Hektoria Glacier was measured in 2011 by the ATM during the Ice-Bridge campaign. The freeboard at the gate is 55 m, resulting in a maximum ice thickness of 450 m assuming freely float-ing ice. The correspondfloat-ing numbers for the calvfloat-ing fluxes, with November 2010 velocities, are 1.67 Gt a−1for Hekto-ria Glacier and 1.99 Gt a−1for Green Glacier, adding up to 3.66 Gt a−1which is 27 % higher than the flux in 2008. By July 2013 the combined flux decreased to 3.05 Gt a−1. This illustrates the impact of velocity variations on calving fluxes, resulting in major fluctuations of glacier net mass balance within a few years.
For computing the ice flux for Crane Glacier, the same flux gate 1 km inland of the ice front in 2008 and 2009 is used as by Rott et al. (2011) (Fig. 4). Because of slow down of ice flow (Fig. 3) and reduction in ice thickness, the calving flux of Crane Glacier decreased significantly during recent years. Based on the June 2007 analysis, the flux across the gate is estimated at 5.02 Gt a−1, 4.4 times higher than the pre collapse calving flux of 1.15 Gt a−1. Until November 2013 it decreases to 1.72 Gt a−1, one third of the 2007 flux.
In 1995 the combined mass flux of Jorum Glacier across the 2008 calving gates of the two glacier branches amounted to 0.35 Gt a−1 (Rott et al., 2011). For 2008, the elevation data from an ICESat transect close to the gates were used to estimate the maximum ice thickness. For estimating the ice thickness in 2012, we use surface elevation data of the TanDEM-X satellite mission, which show surface low-ering by a few meters since 2008. The estimated calving
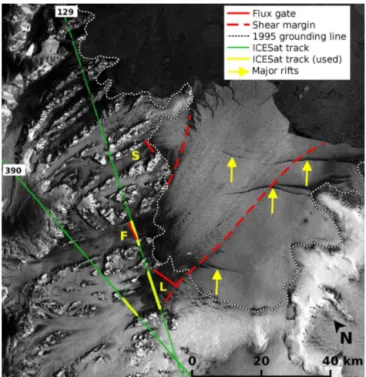
Figure 5. Envisat ASAR image of Scar Inlet ice shelf and tributary glaciers, 28 January 2004. Red lines show the flux gates for Flask (F), Leppard (L) and Starbuck (S) glaciers. The broken red lines delimit the outflow downstream of Flask and Leppard glaciers. The yellow sections of the ICESat tracks are used for deriving surface elevation change on Leppard and Flask glaciers. The arrows point to major rifts.
flux for the two branches of Jorum Glacier decreased from 0.61 Gt a−1in 2008 to 0.45 Gt a−1in 2013.
Figure 6. Surface velocities along the central flow line of Flask (top left) and Leppard (bottom left) glaciers and downstream of these glaciers on Scar Inlet ice shelf (right, top and bottom). Differentyscale for the Leppard flow line. The arrow shows the location of the flux gate. Position of flow-line profiles shown in Fig.1 and of flux gates in Fig. 5. The vertical bars show uncertainties in velocity for TerraSAR-X (T) 2009–2013; PALSAR (P) November 2009; ASAR (A) 2004–2006; ERS (E) 1995, 1999.
trend. The discharge increased between 37 and 56 % com-pared to 1995 and 1999. On Leppard Glacier, the center line velocity at the gate near the grounding line has increased from 1.00 (365 m a−1)in 1995 to 1.44 m d−1(526 m a−1)in 2009 and 1.48 m d−1(541 m a−1)in 2013. The flux increased from 1.22 in 1995 to 1.74 Gt a−1in 2011 and 1.78 Gt a−1in 2013, an increase of 43 and 46 %, respectively. As for Flask Glacier, there is no significant difference between 2009 and 2013.
The flow acceleration and increased ice discharge results in dynamic thinning which is confirmed by ICESat laser al-timeter measurements. For analysis of elevation change, we selected dates with closely spaced ICESat repeat tracks: track 129 of 1 June 2004 and 27 November 2008 shifted by 31 m on Leppard Glacier and 28 m on Flask Glacier; track 390 of 18 June 2004 and 19 March 2008 shifted by 71 m on Lep-pard Glacier. We corrected for the shift by taking into ac-count the surface slope derived from the API-DEM. For track no. 129, crossing Flask Glacier 0.5 km downstream and Lep-pard Glacier 5 km upstream of the flux gate, we obtain a mean annual rate of surface elevation change of−1.93 m a−1 on Leppard Glacier and of−2.22 m a−1on Flask Glacier. For track no. 390, we obtain for a profile across Leppard Glacier 13 km upstream of the flux gate a mean annual rate of eleva-tion change of−1.71 m a−1.
5 Discussion
In line with previous studies, our data shows a drastic in-crease in flow velocities of major tributary glaciers follow-ing the collapse of Larsen B Ice Shelf in early 2002. Re-duced back stress and frontal retreat caused flow acceleration that propagated up-glacier. Beyond that, our analysis of new velocity data shows that some of the glaciers slowed down significantly during recent years. Strong acceleration and in-crease of calving flux is observed for HGE glaciers and Crane Glacier, downstream of which the seafloor map shows deep troughs (Lavoie et al., 2015).
Table 2. Drainage area above the flux gate, velocities at the center of the flux gate (Vc), discharge across the flux gates, and difference of discharge vs. 1995; for glaciers draining into Larsen B embayment.
Glacier Gate Area Date Vc Discharge 11995−Date 2 km2 YYYY-MM (m a−1) (Gt a−1) (Gt a−1)
Crane C1 1235 1995/99* 548 1.15±0.13
2007-06 2464 5.02±0.56 −3.87 2008/09* 1882 2.92±0.33 −1.77 2010-04 1650 2.44±0.27 −1.29 2011-01 1329 2.21±0.25 −1.06 2012-08 1292 2.15±0.24 −1.00 2013-11 1059 1.72±0.19 −0.57
Jorum J1 382 1995/99* 475 0.35±0.07
2008/09* 865 0.53±0.11 −0.18 2012-04 759 0.39±0.08 −0.04
J2 52 1995/99* 68 0.04±0.02
2008/09* 146 0.08±0.02 −0.04 2012-04 153 0.06±0.01 −0.02
Hektoria-Green H1 & G1 1188 1995/99* 387 1.19±0.25
2004-03 1862 4.74±0.98 −3.55 2008/09* 1545 2.88±0.59 −1.69
Hektoria H2 341 2010-11 822 1.67±0.34 2013-07 741 1.49±0.31
Green G2 618 2010-11 1278 1.99±0.41
2013-07 1095 1.56±0.31
* From Rott et al. (2011). In this table, the format YYYY/YY represents a range of years.
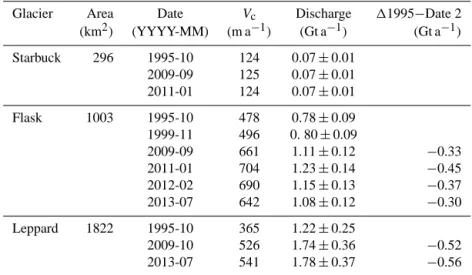
Table 3. Drainage area above the flux gate, velocities at the center of the flux gate (Vc), discharge across the flux gates, and difference of discharge vs. 1995; for glaciers draining into Scar Inlet ice shelf.
Glacier Area Date Vc Discharge 11995−Date 2 (km2) (YYYY-MM) (m a−1) (Gt a−1) (Gt a−1) Starbuck 296 1995-10 124 0.07±0.01
2009-09 125 0.07±0.01 2011-01 124 0.07±0.01
Flask 1003 1995-10 478 0.78±0.09 1999-11 496 0. 80±0.09
2009-09 661 1.11±0.12 −0.33 2011-01 704 1.23±0.14 −0.45 2012-02 690 1.15±0.13 −0.37 2013-07 642 1.08±0.12 −0.30
Leppard 1822 1995-10 365 1.22±0.25
2009-10 526 1.74±0.36 −0.52 2013-07 541 1.78±0.37 −0.56
5.3 m d−1in January 2006, similar to the value of 5.5 m d−1 we derived for this point from TSX data of June 2007.
Subsequently, our analysis shows significant deceleration for Crane Glacier since mid-2007, yet over this time period the position of the ice front has remained comparatively sta-ble. Possibly this is due to a reduction in the ratio between
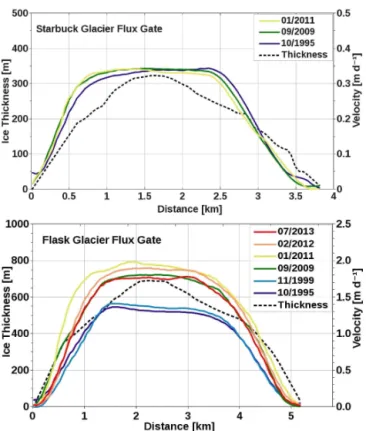
bal-Figure 7. Ice thickness and surface velocity across the flux gate of Starbuck Glacier (top) and Flask Glacier (bottom). Ice thickness from Farinotti et al. (2013, 2014).
ance flux (Rott et al., 2011), the resulting rate of mass loss decreased from 3.87 to 0.57 Gt a−1. Based on differencing of DEMs from optical stereo imagery in combination with ICESat data, Scambos et al. (2014) report a mean loss rate of 2.24 Gt a−1 for the period March 2003–November 2008. This is 42 % lower than our estimate for June 2007 and 27 % higher that our estimate for 2008/09. These large tempo-ral variations emphasize the importance of using common epochs when comparing glacier contributions to sea level rise obtained by different methods.
Whereas on Crane Glacier a period of major flow acceler-ation during the first 5 years after ice shelf disintegracceler-ation was followed by a steady gradual decrease in velocity, the flow behavior of Hektoria and Green glaciers has been more vari-able. Periods with increased flow velocities and frontal re-treat alternated with periods of comparatively stable front po-sitions or short-term advance. ASTER and ICESat data show substantial elevation losses on lower Green Glacier amount-ing to about 100 m duramount-ing the time span November 2001–late 2008 (Shuman et al., 2011). Scambos et al. (2014) report for the HG glaciers a mean loss rate of 3.84 Gt a−1for the period March 2003–November 2008 out of which 0.53 km3a−1are attributed to the loss of ice volume above floating for the re-treating glacier area. Our estimate of the calving flux across the 2008/09 gate, located about 4 km inland of the 2004 ice front, yields 4.74 Gt a−1for March 2004 and 2.88 Gt a−1for
2008/09. With the estimated balance flux of 1.19 Gt a−1(Rott et al., 2011), the resulting net balance for the glacier area above the 2008/09 gate amounts to−3.55 Gt a−1 based on velocities of March 2004. For 2008, the estimated net bal-ance is−1.69 Gt a−1. The loss rate increased in 2010/2011, and decreased in 2013, with the discharge in Table 3 referring to gates shifted inland because of frontal retreat.
Hektoria, Green and Evans glaciers, forming a joined ter-minus in a wide bay in 2002, have been particularly vul-nerable to stress perturbation after ice shelf collapse as ev-ident from the frontal retreat. Successive phases of transi-tion from weakly grounded to floating ice due to flow accel-eration and thinning, associated with major calving events, have been maintaining high rates of mass depletion for the HGE glaciers to date. Crane and Jorum glaciers, terminating in deep and narrow fjords, have been subject to acceleration and major mass depletion during the first 5 years after ice shelf collapse, but slowed down afterwards. Similar behavior after retreat into narrow fjords is observed for Sjögren and Boydell glaciers in the Prince Gustav Channel and for the Dinsmoor, Bombardier and Edgeworth glaciers in the Larsen A embayment (Rott et al., 2014). The ratio of longitudinal stress to lateral shear stress is critical for glacier motion in narrow valleys (Hulbe et al., 2008). Decreasing ice thickness and surface slope affect driving stresses and cause deceler-ation in flow. However, considering the ongoing thinning of the terminus and the resulting decrease of lateral shear stress, it can be concluded that Crane and Jorum glaciers will still be subject to major retreat before reaching a new equilibrium state further inland.
imme-diately downstream of the grounding zone. Numerical mod-els of Larsen B Ice Shelf in pre-collapse state show a band of weak ice along the shear zone that separates the outflow of Leppard Glacier from the slowly moving ice along Jason Peninsula (Rack et al., 2000; Vieli et al., 2006). The differen-tial acceleration of flow and the formation of additional rifts, which are evident in ASAR and TSX images since 2004, in-dicate that ice in this zone is further weakening.
Whereas the ice at the flux gates of Leppard and Flask glaciers accelerated from 1995 to 2009 by 44 and 38 %, re-spectively, the velocity of Starbuck Glacier has been stable. This can on one hand be attributed to the bedrock topography, on the other hand to the rather modest mass turnover. The lower terminus of Starbuck Glacier is firmly grounded, with a broad sub-glacial ridge in the area of the grounding zone (Farinotti et al., 2014). Under the assumption of mass balance equilibrium, supported by the observed steady ice motion since 1995, a specific surface mass balancebn=230 kg m−2 is inferred from the ice flux across the grounding line.
The stable velocity in 1995 and 1999 suggests that Flask Glacier has been close to equilibrium state in those years. Thus, assuming equilibrium condition, the 1995 mass flux of 0.78 Gt a−1across the flux gate results inbn=779 kg m−2, 3.4 times higher than the specific mass balance on Starbuck Glacier. The large difference in bn can be explained by the strong west–east decrease of accumulation (Turner et al., 2002). Flask Glacier flows down from the main ice divide of the peninsula, whereas Starbuck Glacier originates on a small ice plateau 25 km to the east, separated from the main divide by the deep trough of Crane Glacier.
Flask and Leppard glaciers have responded to the chang-ing stress conditions on the ice shelf in front by acceleration. The bedrock of Flask and Leppard glaciers ascends towards the grounding zone from depressions several kilometers up-stream (Farinotti et al., 2013; Huss and Farinotti, 2014). The height of the glacier surface above the bedrock suggests that the glaciers are still firmly grounded above at the flux gates. Consequently, changes in the force balance of the grounding zone probably played a main role for initializing flow accel-eration.
Scambos et al. (2014) report rates of mass change of
+0.12 Gt a−1 for Flask Glacier and −1.31 Gt a−1 for Lep-pard Glacier, based on differencing of optical stereo DEMs from November 2001 to November 2006 and ICESat data from 2003 to 2008. Our analysis over recent years does not show a contrasting behavior for the two glaciers. Under assumption that the 1995 fluxes correspond to the balance fluxes, we obtain for different dates between 2009 and 2013 mass change rates of−0.30 to−0.44 Gt a−1for Flask Glacier and−0.52 to−0.56 Gt a−1for Leppard Glacier.
6 Conclusions
The collapse of the main section of Larsen B Ice Shelf in March 2002 triggered a near immediate response of most tributary glaciers with increased velocities maintained to date. Acceleration of ice flow is also observed on the rem-nant part of the ice shelf in Scar Inlet and its main tributaries. The behavior of the individual glaciers varies, and veloci-ties show significant fluctuations over time. Whereas, after an initial speed up, Crane and Jorum glaciers slowed down sig-nificantly since mid-2007, the Hektoria and Green glaciers continue to show widespread fluctuations in velocity and pe-riods of major frontal retreat alternating with more station-ary positions or short term frontal advance. These differences in the response are related to glacier geometry and bedrock features. Crane and Jorum glaciers retreated into deep and narrow fjords while Hektoria and Green glaciers still calve into a wide bay. Temporal fluctuations of flow velocity are a main factor for fluctuations in ice discharge, emphasizing the importance of common epochs for reconciling glacier mass balance estimates derived by different methods (Shepherd et al., 2012).
Because of the combined effect of slow down and decrease in ice thickness, the ice discharge of Crane Glacier decreased by 66 % between 2007 and 2013 and of Jorum Glacier by 26 %. Both glaciers are expected to retreat further inland be-fore reaching a new equilibrium in spite of slow-down, con-cluding from ongoing thinning and the increase of floating ice area. Hektoria and Green glaciers maintained variable but consistently high rates of mass depletion in recent years, as the calving front alternated between floating and weakly grounded phases.
Acknowledgements. The authors would like to thank A. Cook (Univ. Swansea, UK) for providing outlines of glacier basins. The TerraSAR-X data and TanDEM-X data were made available by DLR through project HYD1864 and XTI_GLAC0457, respectively. The ERS SAR and Envisat ASAR data were made available by ESA trough Envisat AO project ID-308. The ICESat laser altimeter data were downloaded from the NASA Distributed Active Archive Center, US National Snow and Ice Data Center (NSIDC), Boulder, Colorado. The work was supported by the European Space Agency, ESA Contract No.4000105776/12/NL/CBi.
Edited by: C. Haas
References
Berthier, E., Scambos, T. A., and Shuman, C. A.: Mass loss of Larsen B tributary glaciers (Antarctic Peninsula) unabated since 2002, Geophys. Res. Lett., 39, L13501, doi:10.1029/2012GL051755, 2012.
Bindschadler, R., Vornberger, P., Fleming, A., Fox, A., Mullins, J., Binnie, D., Paulsen, S. J., Granneman, B., and Gorodetzky, D.: The Landsat Image Mosaic of Antarctica, Remote Sens. Envi-ron., 112, 4214–4226, doi:10.1016/j.rse.2008.07.006, 2008. Cook, A. J. and Vaughan, D. G.: Overview of areal changes of the
ice shelves on the Antarctic Peninsula over the past 50 years, The Cryosphere, 4, 77–98, doi:10.5194/tc-4-77-2010, 2010. Cook, A. J., Murray, T., Luckman, A., Vaughan, D. G., and
Bar-rand, N. E.: A new 100-m Digital Elevation Model of the Antarctic Peninsula derived from ASTER Global DEM: meth-ods and accuracy assessment, Earth Syst. Sci. Data, 4, 129–142, doi:10.5194/essd-4-129-2012, 2012.
De Angelis, H. and Skvarca, P.: Glacier surge after ice shelf col-lapse, Science, 299, 1560–1562, doi:10.1126/science.1077987, 2003.
Farinotti, D., Corr, H. F. J., and Gudmundsson, G. H.: The ice thickness distribution of Flask Glacier, Antarctic Penin-sula, determined by combining radio-echo soundings, surface velocity data and flow modelling, Ann. Glaciol., 54, 18–24, doi:10.3189/2013AoG63A603, 2013.
Farinotti, D., King, E. C., Albrecht, A., Huss, M., and Gudmunds-son, G. H.: The bedrock topography of Starbuck Glacier, Antarc-tic Peninsula, as measured by ground based radio-echo sound-ings, Ann. Glaciol., 55, 22–28, 2014.
Fricker, H. A. and Padman, L.: Thirty years of elevation change on Antarctic Peninsula ice shelves from multimis-sion satellite radar altimetry, J. Geophys. Res., 117, C02026, doi:10.1029/2011JC007126, 2012.
Glasser, N. F. and Scambos, T. A.: A structural glaciological analy-sis of the 2002 Larsen B ice-shelf collapse, J. Glaciol., 54, 3–16, 2008.
Haran, T., Bohlander, J., Scambos, T. A., Painter, T., and Fahne-stock, M.: MODIS Mosaic of Antarctica 2008–2009 (MOA2009) Image Map 2009, Boulder, Colorado USA: National Snow and Ice Data Center, doi:10.7265/N5KP8037, 2014.
Hulbe, C. L., Scambos, T. A., Youngberg, T., and Lamb A. K.: Pat-terns of glacier response to disintegration of the Larsen B Ice Shelf, Antarctic Peninsula, Global Planet. Chang., 63, 1–8, 2008.
Huss, M. and Farinotti, D.: A high-resolution bedrock map for the Antarctic Peninsula, The Cryosphere, 8, 1261–1273, doi:10.5194/tc-8-1261-2014, 2014.
Jezek, K. C., Curlander, J. C., Carsey, F., Wales, C., and Barry, R. G.: RAMP AMM-1 SAR Image Mosaic of Antarctica. Version 2. Boulder, Colorado, USA, National Snow and Ice Data Center, 2013.
Krabill, W. B. and Thomas, R: Pre-IceBridge ATM L2 Icessn Ele-vation, Slope, and Roughness. Boulder, Colorado, USA, NASA DAAC at the National Snow and Ice Data Center, 2013. Krabill, W. B. and Thomas, R: IceBridge ATM L2 Icessn
Eleva-tion, Slope, and Roughness. Version 2. Boulder, Colorado, USA, NASA DAAC at the National Snow and Ice Data Center, 2014. Krieger, G., Zink, M., Bachmann, M., Bräutigam, B., Schulze, D.,
Martone, M., Rizzoli, P., Steinbrecher, U., Anthony, J. W., De Zan, F., Hajnsek, I., Papathanassiou, K., Kugler, F., Rodriguez Cassola, M., Younis, M., Baumgartner, S., Lopez Dekker, P., Prats, P., and Moreira, A.: TanDEM-X: a radar interferometer with two formation flying satellites, Acta Astronaut., 89, 83–98, doi:10.1016/j.actaastro.2013.03.008, 2013.
Lavoie, C., Domack, E. W., Pettit, E. C., Scambos, T. A., Larter, R. D., Schenke, H.-W., Yoo, K. C., Gutt, J., Wellner, J., Canals, M., Anderson, J. B., and Amblas, D.: Configuration of the Northern Antarctic Peninsula Ice Sheet at LGM based on a new synthesis of seabed imagery, The Cryosphere, 9, 613–629, doi:10.5194/tc-9-613-2015, 2015.
Paterson, W. S. B.: The physics of glaciers, Third Edition, Oxford, etc., Elsevier, 1994.
Rack, W.: Dynamic behaviour and disintegration of the northern Larsen Ice Shelf, Antarctic Peninsula, Ph.D. thesis, University of Innsbruck, Austria, 166 pp., 2000.
Rack, W., Doake, C. S. M., Rott, H., Siegel, A., and Skvarca, P.: In-terferometric analysis of the deformation pattern of the Northern Larsen Ice Shelf, Antarctic Peninsula, compared to field mea-surements and numerical modeling, Ann. Glaciol., 31, 205–210, 2000.
Rack, W. and Rott, H.: Pattern of retreat and disintegration of Larsen B Ice Shelf, Antarctic Peninsula, Ann. Glaciol., 39, 505–510, 2004.
Rignot, E., Casassa, G., Gogineni, P., Rivera, A., and Thomas, R.: Accelerated ice discharges from the Antarctic Peninsula follow-ing the collapse of the Larsen B Ice Shelf. Geophys. Res. Lett., 31, L18401, doi:10.1029/2004GL020697, 2004.
Rott, H.: Advances in interferometric synthetic aperture radar (In-SAR) in earth system science, Prog. Phys. Geog., 33, 769–791, doi:10.1177/0309133309350263, 2009.
Rott, H., Skvarca, P., and Nagler, T.: Rapid collapse of Northern Larsen Ice Shelf, Antarctica, Science, 271, 788–792, 1996. Rott, H., Rack, W., Skvarca, P., and De Angelis, H.: Northern
Larsen Ice Shelf, Antarctica: Further retreat after collapse, Ann. Glaciol., 34, 277–282, 2002.
Rott, H., Müller, F., Nagler, T., and Floricioiu, D.: The imbalance of glaciers after disintegration of Larsen-B ice shelf, Antarctic Peninsula, The Cryosphere, 5, 125–134, doi:10.5194/tc-5-125-2011, 2011.
TanDEM-X satellite measurements, Geophys. Res. Lett., 41, 8123–8129, doi:10.1002/2014GL061613, 2014.
Scambos, T. A., Bohlander, J. A., Shuman, C. A., and Skvarca, P.: Glacier acceleration and thinning after ice shelf collapse in the Larsen B embayment, Antarctica, Geophys. Res. Lett., 31, L18402, doi:10.1029/2004GL020670, 2004.
Scambos, T. A., Berthier, E., and Shuman, C. A.: The triggering of subglacial lake drainage during rapid glacier drawdown: Crane Glacier, Antarctic Peninsula, Ann. Glaciol., 52, 74–82, 2011. Scambos, T. A., Berthier, E., Haran, T., Shuman, C. A., Cook, A. J.,
Ligtenberg, S. R. M., and Bohlander, J.: Detailed ice loss pattern in the northern Antarctic Peninsula: widespread decline driven by ice front retreats, The Cryosphere, 8, 2135–2145, doi:10.5194/tc-8-2135-2014, 2014.
Shepherd, A., Ivins, E. R., Geruo, A, Barletta, V. R., Bentley, M. J., Bettadpur, S., Briggs, K. H., Bromwich, D. H., Forsberg, R., Galin, N., Horwath, M., Jacobs, S., Joughin, I., King, M. A., Lenaerts, J. T., Li, J., Ligtenberg, S. R., Luckman, A., Luthcke, S. B., McMillan, M., Meister, R., Milne, G., Mouginot, J., Muir, A., Nicolas, J. P., Paden, J., Payne, A. J., Pritchard, H., Rignot, E., Rott, H., Sørensen, L. S., Scambos, T. A., Scheuchl, B., Schrama, E. J., Smith, B., Sundal, A. V., van Angelen, J. H., van de Berg, W.J., van den Broeke, M. R., Vaughan, D. G., Velicogna, I., Wahr, J., Whitehouse, P. L., Wingham, D. J., Yi, D., Young, D., and Zwally, H. J.: A reconciled estimate of ice-sheet mass balance, Science, 338, 1183–1189, doi:10.1126/science.1228102, 2012.
Shuman, C. A., Berthier, E., and Scambos, T. A.: 2001–2009 eleva-tion and mass losses in the Larsen A and B embayments, Antarc-tic Peninsula, J. Glaciol., 57, 737–754, 2011.
Turner, J., Lachlan-Cope, T. A., Marshall, G. J., Morris, E. M., Mul-vaney, R., and Winter, W.: Spatial variability of Antarctic Penin-sula net surface mass balance, J. Geophys. Res., 107, AAC 4-1– AAC 4-18, doi:10.1029/2001JD000755, 2002.
Vieli, A. and Payne, A. J.: Assessing the ability of numerical ice sheet models to simulate grounding line migration, J. Geophys. Res.-Earth, 110, F01003, doi:10.1029/2004JF000202, 2005. Vieli, A., Payne, A. J., Du, Z., and Shepherd, A.: Numerical
modelling and data assimilation of the Larsen B Ice Shelf, Antarctic Peninsula, Philos. T. R. Soc. A, 364, 1815–1839, doi:10.1098/rsta.2006.1800, 2006.