TCD
7, 5509–5540, 2013Tectonic and oceanographic controls on Abbot Ice
Shelf
J. R. Cochran et al.
Title Page
Abstract Introduction
Conclusions References
Tables Figures
◭ ◮
◭ ◮
Back Close
Full Screen / Esc
Printer-friendly Version Interactive Discussion
Discussion
P
a
per
|
D
iscussion
P
a
per
|
Discussion
P
a
per
|
Discuss
ion
P
a
per
|
The Cryosphere Discuss., 7, 5509–5540, 2013 www.the-cryosphere-discuss.net/7/5509/2013/ doi:10.5194/tcd-7-5509-2013
© Author(s) 2013. CC Attribution 3.0 License.
Open Access
The Cryosphere
Discussions
This discussion paper is/has been under review for the journal The Cryosphere (TC). Please refer to the corresponding final paper in TC if available.
Tectonic and oceanographic controls on
Abbot Ice Shelf thickness and stability
J. R. Cochran, S. S. Jacobs, K. J. Tinto, and R. E. Bell
Lamont-Doherty Earth Observatory of Columbia University Palisades, NY 10964, USA Received: 29 October 2013 – Accepted: 10 November 2013 – Published: 19 November 2013 Correspondence to: J. R. Cochran ([email protected])
TCD
7, 5509–5540, 2013Tectonic and oceanographic controls on Abbot Ice
Shelf
J. R. Cochran et al.
Title Page
Abstract Introduction
Conclusions References
Tables Figures
◭ ◮
◭ ◮
Back Close
Full Screen / Esc
Printer-friendly Version Interactive Discussion
Discussion
P
a
per
|
D
iscussion
P
a
per
|
Discussion
P
a
per
|
Discuss
ion
P
a
per
Abstract
Ice shelves play key roles in stabilizing Antarctica’s ice sheets and returning freshwater to the Southern Ocean. Improved data sets of ice shelf draft and underlying bathymetry are important for assessing ocean–ice interactions and modeling ice response to cli-mate change. The long, narrow Abbot Ice Shelf south of Thurston Island produces
5
large volumes of meltwater but is in overall mass balance unlike other ice shelves in the region that are losing mass. Here we invert NASA Operation IceBridge (OIB) air-borne gravity data over the Abbot region to obtain sub-ice bathymetry, and combine OIB elevation and ice thickness measurements to estimate ice draft. A series of asym-metric fault-bounded rift basins underlie the Abbot Ice shelf west of 94◦W and also the 10
Cosgrove Ice Shelf to the south. The ice sheet bed in areas surrounding the Abbot is near or above sea level, consistent with stable grounding lines. Sub-ice water column depths along OIB flight lines are sufficiently deep to allow warm deep and thermocline waters near the western Abbot ice front to circulate through much of the ice shelf cavity. Abbot Ice Shelf drafts averaging∼200 m, about 30 m less than the Bedmap2
compi-15
lation, are coincident with the summer transition between the ocean surface mixed layer and upper thermocline. The ice feeding the Abbot crosses the relatively stable southern grounding lines and is rapidly thinned by the warmest inflow. While the sys-tem is presently in equilibrium, the overall draft is sensitive to the thickness of the cold Antarctic surface water overlying the thermocline.
20
1 Introduction
Ice shelves are found along much of the Antarctic coastline and make up about 11 % of the surface area of Antarctic ice (Fox and Cooper, 1994). These floating extensions of the ice sheets play an important stabilizing role by buttressing and slowing the flow of inland ice across the grounding line (Dupont and Alley, 2005). For example, glaciers
25
TCD
7, 5509–5540, 2013Tectonic and oceanographic controls on Abbot Ice
Shelf
J. R. Cochran et al.
Title Page
Abstract Introduction
Conclusions References
Tables Figures
◭ ◮
◭ ◮
Back Close
Full Screen / Esc
Printer-friendly Version Interactive Discussion
Discussion
P
a
per
|
D
iscussion
P
a
per
|
Discussion
P
a
per
|
Discuss
ion
P
a
per
|
shelves collapsed (Rott et al., 2002; De Angelis and Skvarca, 2003; Rignot et al., 2004), while glaciers feeding the remnant of the Larsen B in SCAR Inlet did not accelerate (Rignot et al., 2004).
Many West Antarctic ice shelves, particularly within the Amundsen Sea Embayment have experienced rapid thinning (e.g., Rignot, 1998; Shepherd et al., 2004; Pritchard
5
et al., 2012). Much of this thinning has been attributed to bottom melting resulting from relatively warm Circumpolar Deep Water (CDW) circulating on the continental shelf and beneath the ice shelves (e.g., Jacobs et al., 1996, 2011; Jenkins et al., 1997; Hellmer et al., 1998), and to unpinning from the sub-ice bathymetry (Jenkins et al., 2010). Pritchard et al. (2012) indicated that the Abbot is not thinning, although
not-10
ing a−1.01 m yr−1 basal melt imbalance for 2003–2008. Two recent studies combin-ing satellite measurements and firn modelcombin-ing also show that the Abbot is relatively stable. Rignot et al. (2013) show an area-average ice thickening of 0.16±0.6 m yr−1 with an area-average basal melt rate of 1.75±0.6 m yr−1, while Depoorter et al. (2013) estimated <1 m yr−1 thinning with a basal melt rate of 2.72±0.7 m yr−1. Two recent 15
modeling studies, Timmermann et al. (2012) and Kusahara and Hasumi (2013), found comparable basal melt rates of 2.1 m yr−1
and 2.01 m yr−1
respectively.
Effective modeling of the sub-ice shelf circulation and assessment of shelf vulnera-bility to bottom melting is facilitated by knowledge of the underlying cavity geometry. Altimetry measurements of surface elevation over ice shelves may be used to
deter-20
mine ice thickness with the assumption of hydrostatic equilibrium and a model for firn densification with depth (e.g., Griggs and Bamber, 2011). Radar methods may used to measure the ice thickness (e.g., Holland et al., 2009), but cannot penetrate through the underlying water to map the seafloor bathymetry. Seismic techniques (e.g., Jarvis and King, 1995; Johnson and Smith, 1997) and direct observations with autonomous
25
TCD
7, 5509–5540, 2013Tectonic and oceanographic controls on Abbot Ice
Shelf
J. R. Cochran et al.
Title Page
Abstract Introduction
Conclusions References
Tables Figures
◭ ◮
◭ ◮
Back Close
Full Screen / Esc
Printer-friendly Version Interactive Discussion
Discussion
P
a
per
|
D
iscussion
P
a
per
|
Discussion
P
a
per
|
Discuss
ion
P
a
per
can be inverted to obtain seafloor bathymetry when combined with altimetry and radar measurements (Tinto and Bell, 2011; Cochran and Bell, 2012).
Here we invert OIB airborne gravity data to determine the bathymetry beneath the Abbot Ice Shelf (Fig. 1). We utilize the gravity-derived bathymetry, ice thickness data, nearby ocean temperature profiles and other information near the Abbot ice front to
5
infer the presence of warm CDW and thermocline waters beneath the ice shelf, and discuss probable ice–ocean interactions.
2 Bathymetry beneath the Abbot Ice Shelf
The Abbot Ice Shelf, with a surface area of about 30 000 km2including ice rises (Swith-inbank et al., 2004; Shepherd et al., 2004; Rignot et al., 2013) is roughly the size of
10
Belgium and extends for 450 km along the Eights Coast of West Antarctica between 103◦W and 89◦W with an average width of about 65 km (Fig. 1). West of 95◦30′W, Thurston Island bounds the northern side of the ice shelf, while the eastern half is pinned at the ice front by three islands and extends to the Fletcher Peninsula. The western edge of the ice shelf faces the Amundsen Sea Embayment. The Bedmap2
15
compilation (Fretwell et al., 2013) indicates that ice thickness over most of the ice shelf is in the range of 200–325 m. The numerous islands and ice rises in Fig. 1 suggest a complex bathymetry beneath the Abbot.
2.1 Gravity anomalies over the Abbot Ice Shelf
NASA’s Operation IceBridge (OIB) program obtained ten north-south, low-altitude
air-20
TCD
7, 5509–5540, 2013Tectonic and oceanographic controls on Abbot Ice
Shelf
J. R. Cochran et al.
Title Page
Abstract Introduction
Conclusions References
Tables Figures
◭ ◮
◭ ◮
Back Close
Full Screen / Esc
Printer-friendly Version Interactive Discussion
Discussion
P
a
per
|
D
iscussion
P
a
per
|
Discussion
P
a
per
|
Discuss
ion
P
a
per
|
and a gravimeter. With no OIB lines east of Farwell Island (∼91◦W, Fig. 1), we do not include the easternmost portion of the Abbot in our analysis.
Surface elevation along the profiles was measured with the NASA “Airborne Topo-graphic Mapper” laser (Krabill, 2010), which can recover elevations with an accuracy of about 10 cm (Krabill et al., 2002). Ice thickness was determined using the
“Multi-5
channel Coherent Radar Depth Sounder” (MCoRDS) radar operated by the University of Kansas Center for Remote Sensing of Ice Sheets (CRESIS) (Leuschen, 2011). The base of the ice shelf was not imaged in the radar data for the very westernmost portion (west of km 12) of our Line 0 along the ice shelf axis(Fig. 3a) and for most of Line 1 across the ice shelf (Fig. 3b). We used least squares regression to determine the
rela-10
tionship of surface elevation to draft in areas where the base of floating ice was clearly observed and then utilized that relationship to estimate the draft in the areas where the base of ice is not observed. In a 15 km length of Line 1 where the base of the ice was observed, our estimated values, at 0.2 km intervals along the flight line, all agree with the observed draft to within 10 m. In our final data set, mismatches at line crossings
15
over floating ice varied from 0.8 m to 26.1 m with a standard error of 11.95 m. The laser and radar data were acquired on the same flights as the gravity data, so the data sets are coincident in time and space. The laser and radar data have along-track resolution equal to or greater than the gravity data.
OIB gravity data (Cochran and Bell, 2010) were obtained with a Sander Geophysics
20
AIRGrav airborne gravimeter (Argyle et al., 2000; Sander et al., 2004). A major advan-tage of the AIRGrav system compared to other airborne gravimeters is that it is able to collect high-quality data during draped flights (Studinger et al., 2008) such as the OIB flights over the Abbot Ice Shelf. Flights during OIB surveys are flown at a nominal height of 1500 feet (457 m) above the Earth’s surface. The free-air gravity anomalies
25
TCD
7, 5509–5540, 2013Tectonic and oceanographic controls on Abbot Ice
Shelf
J. R. Cochran et al.
Title Page
Abstract Introduction
Conclusions References
Tables Figures
◭ ◮
◭ ◮
Back Close
Full Screen / Esc
Printer-friendly Version Interactive Discussion
Discussion
P
a
per
|
D
iscussion
P
a
per
|
Discussion
P
a
per
|
Discuss
ion
P
a
per
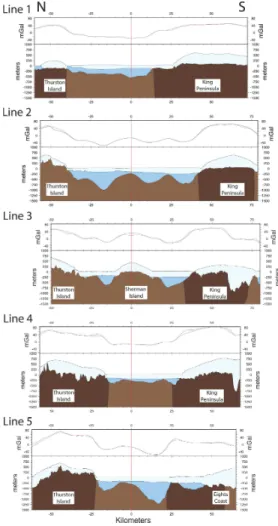
Free-air gravity anomalies measured on OIB flights over Abbot Ice Shelf are shown in map view in Fig. 2 and as profiles in Fig. 3. Observed free-air anomalies range from 80 mGal to−61 mGal. Large positive free-air anomalies are found over Thurston Island. The maximum anomaly on Line 1, at the western tip of the island is 42 mGal (Figs. 2 and 3, Line 1), but anomalies on the other lines over the island consistently reach 55
5
to 72 mGal (Lines 2–6). A large positive anomaly of 77 mGal is also measured over Dustin Island at the edge of the ice shelf immediately east of Thurston Island (Line 7). Other islands overflown during the survey also show positive gravity anomalies with recorded anomalies of 17.9 mGal over Johnson Island, 24.9 mGal over Sherman Island and 43.1 mGal over Farwell Island (Lines 0, 3, 8). An east-west band of large
10
positive anomalies with maximum amplitudes of 50–80 mGal also extends along the King Peninsula on the mainland (Lines 1–4). This band of positive gravity extends offshore into the ice shelf east of 98◦W with a reduced amplitude and dies out near 94◦E (Lines 5–8).
Large negative free-air anomalies of −55 to −60 mGal are found southeast of
15
Thurston Island over the northern part of the ice shelf from 96.5◦W to 94.5◦W and ex-tend westward to 97◦W along the southern edge of a ridge of higher gravity extending
eastward from Sherman and Carpenter Islands (Lines 0, 5–7). Free-air anomalies over the ice shelf west of Sherman Island are generally in the range of −20 to−35 mGal, although reaching −55 mGal just to the northwest of Sherman Island (Lines 0, 1, 2).
20
Free-air anomalies between Johnson and Farwell Islands in the eastern portion of the survey area are generally between−15 and −35 mGal, reaching−45 to −50 mGal in places (Lines 0, 9, 10).
2.2 Inversion of free-air gravity anomalies for bathymetry
Inversion of the gravity data for bathymetry was undertaken in two-dimensions along
in-25
TCD
7, 5509–5540, 2013Tectonic and oceanographic controls on Abbot Ice
Shelf
J. R. Cochran et al.
Title Page
Abstract Introduction
Conclusions References
Tables Figures
◭ ◮
◭ ◮
Back Close
Full Screen / Esc
Printer-friendly Version Interactive Discussion
Discussion
P
a
per
|
D
iscussion
P
a
per
|
Discussion
P
a
per
|
Discuss
ion
P
a
per
|
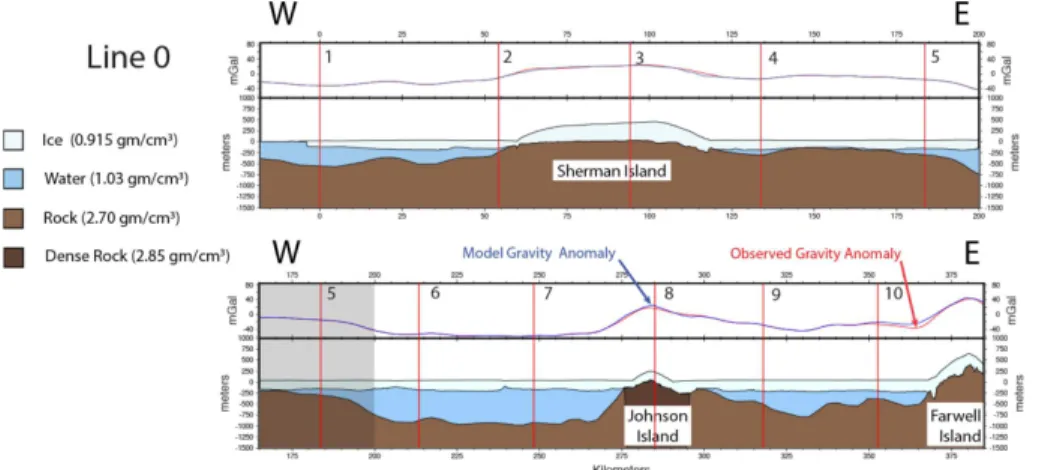
seafloor cannot be imaged with radar) varied to obtain the best match to the observed gravity. The model is pinned to the observed gravity value at a location within the region where the bed can be observed.
Since the densities of the ice and seawater are reasonably well defined, the impor-tant variable for the inversion is the bedrock density. There is very little information to
5
constrain this on the mainland. The only outcrops reported along the mainland in this region are at Lepley Nunatak and in the Jones Mountains. Lepley Nunatak, located offshore at 73◦07′S, 90◦19′W (Fig. 1) to the east of our survey area, exposes granite cut by mafic dikes (Craddock et al., 1969; Grunow et al., 1991). The Jones Mountains, located along the southern margin of the ice shelf between 93◦30′W and 94◦45′W at
10
about 73◦30′S (Fig. 1) reach an elevation of 1500 m to the south of our Line 8. The
exposed Jones Mountains rocks consist of 500–700 m of thin Miocene alkalic basalt flows overlying a basement of Early Jurassic arc-related granites cut by mafic and fel-sic dikes, overlain by Mid-Late Cretaceous intermediate to felfel-sic lavas (Craddock et al., 1964; Rutford et al., 1972; Grunow et al., 1991; Pankhurst et al., 1993).
15
Outcrops are more common on Thurston Island, where rocks have been described from about fifteen locations (White and Craddock, 1987; Lopatin and Orlenko, 1972; Storey et al., 1991; Pankhurst et al., 1993; Grunow et al., 1991). Western Thurston Island, from about 99◦W to 102◦W, is underlain primarily by pink granite, although diorite and granodiorite are found west of∼102◦W at the westernmost end of the island
20
close to our Line 1. East of 99◦W, the predominant rocks are gabbro and diorite. Storey et al. (1991) interpret aeromagnetic lines across eastern Thurston Island as suggesting that the southern part (south of about 72◦10′S) “may be underlain by a large gabbro
body of high magnetization”. Amphibolite-grade gneiss was described as exposed on cliffwalls at the eastern end of Thurston Island at Morgan Inlet and Cape Menzel (White
25
TCD
7, 5509–5540, 2013Tectonic and oceanographic controls on Abbot Ice
Shelf
J. R. Cochran et al.
Title Page
Abstract Introduction
Conclusions References
Tables Figures
◭ ◮
◭ ◮
Back Close
Full Screen / Esc
Printer-friendly Version Interactive Discussion
Discussion
P
a
per
|
D
iscussion
P
a
per
|
Discussion
P
a
per
|
Discuss
ion
P
a
per
from 99◦W to 102◦W with denser rocks (gabbro and diorite) present at the western
and eastern ends of Thurston Island as well as Dustin Island.
We began by assuming a model with four bodies; air (0 g cm−3), ice (0.915 g cm−3), seawater (1.03 g cm−3) and granitic rock (2.70 g cm−3). On Lines 1, 4, 5 and 6 across
Thurston Island and Line 7 across Dustin Island, we included a denser crustal body
5
(2.85 g cm−3) where gabbro and diorite outcrop. The upper surface of this dense body is at the radar-determined rock/ice interface and the lower surface determined by the need for the final model to match the observed gravity where the bed is observed on radar both on the islands and on the mainland.
We assume that the high-density bodies beneath Thurston Island are restricted to
10
the island based on two observations. First, the steep gravity gradient at the southern edge of the island on Lines 4–6 is much steeper than observed on Lines 2 and 3 where no high density rocks are observed (Fig. 3b). Second, if we continued the high-density region beneath the ice shelf, a significant discrepancy emerges between the north-south and east-west lines. Assuming the dense body is present beneath the ice
15
shelf, the inversions imply∼500 m of water on Line 4 between Sherman Island and Carpenter Island while the inversions of orthogonal Line 0 imply<300 m of water at
that location (Fig. 3). The orthogonal line is well controlled as it matches the gravity over the three islands (Sherman, Johnson and Farwell) where the bed can be observed on radar along Line 0 (Fig. 3a).
20
Modeling the lines across the ice shelf and satisfying the observed gravity anomalies where the bed is observed both on Thurston Island and the mainland on the profiles requires a high-density body within the mainland crust (Figs. 3 and 4) corresponding to the area of large positive gravity anomalies over the King Peninsula. Where high density bodies are inferred beneath both coasts, we constrained their extent and depth
25
TCD
7, 5509–5540, 2013Tectonic and oceanographic controls on Abbot Ice
Shelf
J. R. Cochran et al.
Title Page
Abstract Introduction
Conclusions References
Tables Figures
◭ ◮
◭ ◮
Back Close
Full Screen / Esc
Printer-friendly Version Interactive Discussion
Discussion
P
a
per
|
D
iscussion
P
a
per
|
Discussion
P
a
per
|
Discuss
ion
P
a
per
|
The zone of high-density crust beneath the King Peninsula extends offshore under the ice shelf east of 98◦E. In this area, the amplitude of the free-air anomalies over the ice shelf equals or exceeds that of the anomalies onshore where the ice surface is at an altitude of 500–800 m. If no dense body is included in this offshore region, the inversion pins the seafloor to the base of the ice and is still unable to match the
5
observed anomalies. We used the observation that changes in ice thickness (Fig. 3, Lines 5–8) and linear sets of ice rises and ice rumples (Swithinbank et al., 2004) (Fig. 1) underlie peaks in the gravity anomalies to constrain the dense bodies. We set the base of the dense body on each profile so the seafloor just touched or approached the base of the ice at the locations of the ice rises and steps in ice thickness.
10
The region of high densities along the King Peninsula determined on individual profiles forms a coherent zone delineating an east-west trending high-density body (Fig. 4). The thickness of this high density body in our models also varies smoothly from profile to profile, increasing from 4.5 km on Line 1 to 10–14 km on Lines 2–6, then decreasing rapidly eastward to 3 km on Line 7 and 2.4 km on Line 8. The high density
15
body modeled along the southern margin of the ice shelf is nearly in line with a WNW– ESE trending gravity anomaly located between 105◦W and 110◦W on the continental
shelf west of the Abbot (McAdoo and Laxon, 1997). This “Peacock Gravity Anomaly” (Larter et al., 2002), was modeled by Gohl et al. (2007), on the basis of shipboard gravity and helicopter magnetics data, as arising from a large magmatic intrusion.
20
We also needed to introduce a higher-density region corresponding to higher gravity anomalies at the seaward end of Line 10 (Fig. 3), without which the inferred seafloor reaches the sea surface. The depth to which this high-density body extended was set so the average water depth along that portion of the profile agrees with the aver-age depth in that area determined from the IBCSO (International Bathymetric Chart
25
TCD
7, 5509–5540, 2013Tectonic and oceanographic controls on Abbot Ice
Shelf
J. R. Cochran et al.
Title Page
Abstract Introduction
Conclusions References
Tables Figures
◭ ◮
◭ ◮
Back Close
Full Screen / Esc
Printer-friendly Version Interactive Discussion
Discussion
P
a
per
|
D
iscussion
P
a
per
|
Discussion
P
a
per
|
Discuss
ion
P
a
per
Gerlache seamounts offshore to the north. Early Miocene (20–23 Ma) basalts (Hagen et al., 1998) have been dredged from the De Gerlache Seamounts (∼65◦S, 91◦W) and Late Pleistocene basalt (∼0.3 Ma) (Prestvik et al., 1990; Prestvik and Duncan, 1991) has been recovered from Peter I Island (∼68◦50′S, 90◦30′W).
In all of these denser regions, there is a trade off between the assumed density
5
and the thickness determined for the body. If the actual density is greater than the as-sumed 2.85 g cm−3, the dense body will be thinner, but with minimal changes in the inferred bathymetry. We repeated the inversion of Line 6 giving the southern dense body a density of 3.0 g cm−3rather than 2.85 g cm−3while maintaining the same crite-rion that the thickness of the dense body is adjusted so that the seafloor just touched
10
or approached the base of the ice at the location of ice rises or abrupt changes in ice thickness. This resulted in a significantly thinner high-density body, but differences in the inferred bathymetry were less than 50 m across the entire region.
We tested the sensitivity of results to the choice of crustal density by repeating the inversion of E–W Line 0 assuming crustal densities that varied by 0.1 g cm−3 around
15
2.7 g cm−3while holding the bed fixed where it is visible on radar records on Sherman, Johnson and Farwell Islands and pinning the model to observed gravity over Sherman Island. The differences in bathymetry varied directly with water depth and reached a maximum of about 60 m in the deep basin west of Johnson Island (∼km 225–255 on Line 0, Fig. 3). A higher density results in shallower depths and a lower density in
20
deeper depths.
We have no information on the presence or distribution of sediments and did not include a sediment layer in our modeling. If the structure of the seafloor beneath the ice shelf developed from continental rifting in the Late Cretaceous, sediment almost certainly accumulated in basins prior to glaciation. This sediment may still exist or may
25
TCD
7, 5509–5540, 2013Tectonic and oceanographic controls on Abbot Ice
Shelf
J. R. Cochran et al.
Title Page
Abstract Introduction
Conclusions References
Tables Figures
◭ ◮
◭ ◮
Back Close
Full Screen / Esc
Printer-friendly Version Interactive Discussion
Discussion
P
a
per
|
D
iscussion
P
a
per
|
Discussion
P
a
per
|
Discuss
ion
P
a
per
|
implies that each 100 m of sediment with density 2.2 g cm−3will lead to a seafloor depth overestimate of∼30 m. However, this is a maximum estimate since it assumes that the sediments have infinite extent. The actual effect of a sediment layer will depend on its extent and geometry and the depths obtained from the inversion will lie between the actual seafloor and crystalline basement depths.
5
Tinto and Bell (2011) and Cochran and Bell (2012) estimated the uncertainties in their inversions for bathymetry under other West Antarctic ice shelves at∼70 m. In the case of Abbot, the greater survey line spacing and apparently more heterogeneous ge-ology imply somewhat larger uncertainty in gravity-derived depths beneath the Abbot. Depths in shallow areas are better constrained than those in deeper regions.
10
3 Discussion
3.1 Tectonic setting of the Abbot Ice Shelf
Our inversion for the bathymetry beneath the Abbot Ice Shelf reveals a series of east-west trending basins of varying depths and widths under the east-western portion of the ice shelf (Figs. 3–5). The basins are asymmetric with a steep slope bounding one side and
15
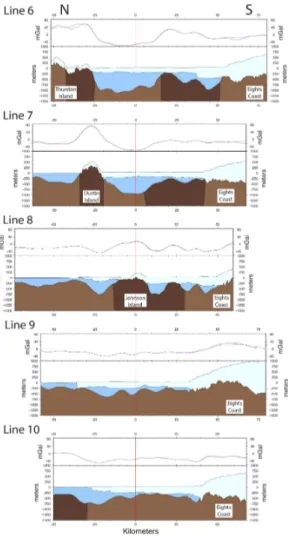
we interpret them as fault-bounded half-grabens. This interpretation is supported by the observation that radar images a deep, asymmetric basin under the King Peninsula that appears fault-bounded on the north and takes the form of a half graben (Line 3, Figs. 3 and 5). The northern wall of that basin is steeper than the walls of the gravity-delineated basins, but the gravity determined slopes are lower as a result of the 70 s
20
gravity data filter. If we filter the radar-determined bed with the spatial equivalent of the gravity filter, the basin on the King Peninsula has slopes very similar to those in the basins identified from the gravity inversion.
The distribution of interpreted faults and basins is shown in Fig. 4. The entire south-ern margin of Thurston Island appears to be comprised of an en echelon set of faults.
25
TCD
7, 5509–5540, 2013Tectonic and oceanographic controls on Abbot Ice
Shelf
J. R. Cochran et al.
Title Page
Abstract Introduction
Conclusions References
Tables Figures
◭ ◮
◭ ◮
Back Close
Full Screen / Esc
Printer-friendly Version Interactive Discussion
Discussion
P
a
per
|
D
iscussion
P
a
per
|
Discussion
P
a
per
|
Discuss
ion
P
a
per
of a series of south-facing half grabens forming 10–20 km-wide topographic basins (Figs. 3b and 4). This pattern continues south across the King Peninsula to the Cos-grove Ice Shelf, which also appears to be underlain by a half graben (Fig. 5). The tectonic pattern changes east of Carpenter Island, where a set of large inward facing faults delineate a deep basin that reaches depths of over 1200 m on Line 5 (Figs. 3b
5
and 4). Shallower small, fault-bounded basins are located along the southern margin of the ice shelf. The footwall rims of the faults bounding these basins on the north create linear rows of ice rises and ice rumples on the ice shelf surface (Figs. 1 and 3b). Rifting in this area does not extend south of the Abbot Ice Shelf as it does farther west (Fig. 5). This rifted terrain ends abruptly near 94◦W at Johnson Island. The dense crustal
10
body under the southern ice shelf and the King Peninsula also terminates at Johnson Island (Fig. 4). The bathymetry inferred beneath the ice shelf on Lines 9 and 10 (Fig. 3) located east of 94◦W between Johnson and Farwell Islands is shallower with gentler slopes than in the west and shows no features suggesting tectonic activity.
The tectonic boundary at 94◦W is directly on line with a linear, north–south oriented
15
bathymetric and gravity structure, the Bellingshausen Gravity Anomaly (BGA) of Gohl et al. (1997), in the deep ocean north of the continental margin. The BGA structure, which later marked the eastern boundary of the former Bellingshausen Plate, devel-oped along a Cretaceous ridge-trench transform separating the Phoenix and Pacific Plates (Larter et al., 2002). Rifting nucleated along this transform at about 90 Ma and
20
propagated westward, splitting the Chatham Rise and Campbell Plateau from Antarc-tica (Larter et al., 2002; Eagles et al., 2004). The tectonic boundary at 94◦W beneath the Abbot Ice Shelf implies that this rifting originally extended into the Antarctic con-tinent before focusing north of Thurston Island. Abbot and Cosgrove ice shelves thus overlie Late Cretaceous continental rifts.
25
3.2 Ocean-ice interactions beneath the Abbot Ice Shelf
TCD
7, 5509–5540, 2013Tectonic and oceanographic controls on Abbot Ice
Shelf
J. R. Cochran et al.
Title Page
Abstract Introduction
Conclusions References
Tables Figures
◭ ◮
◭ ◮
Back Close
Full Screen / Esc
Printer-friendly Version Interactive Discussion
Discussion
P
a
per
|
D
iscussion
P
a
per
|
Discussion
P
a
per
|
Discuss
ion
P
a
per
|
a trough on the continental shelf that extends along the western end of Thurston Island and to the shelf break (Fig. 4). With a minimum depth of 575 m at ∼72◦05′S, this trough is sufficiently deep to allow the southward passage of warm deep water (Hellmer et al., 1998; Jacobs et al., 2011). Ocean temperature profiles at two locations near the western ice front of the Abbot, marked by stars on Fig. 4, show that CDW is observed
5
at depths below about 400 m (Fig. 6). Temperatures are>3◦C above the melting point
of ice at those depths, and the overlying thermocline is>1◦ above freezing at depths up to∼200–250 m.
The contoured IBCSO bathymetry suggests that the bathymetry shoals eastward from station 91 toward the ice front (Fig. 4). However, the IBCSO compilation lacks
10
actual bathymetric data in that region (Arndt et al., 2013; Nitsche et al., 2007) and a 2012RRS Shackletonsingle-beam echo sounder line, not included in IBCSO, shows 600–700 m of water along that portion of the ice front (F. Nitsche, personal communi-cation, 2013) indicating that the shoaling is actually an IBCSO gridding artifact. Thus both thermocline and warm deep waters can access the ice shelf cavity.
15
The deep eastern rift basin opens onto the Bellingshausen Sea continental shelf between Dustin Island and McNamara Island through a trough reaching a depth of 785 m near km−22 on Line 8 (Fig. 3b). Thermocline waters and CDW may also flow through this cavity opening. IBSCO bathymetry to the north, very poorly constrained by sparse shipboard measurements (Graham et al., 2011; Arndt et al., 2013), does
20
not define any bathymetric troughs extending toward the edge of the continental shelf. However, as can be inferred from Fig. 4 of Jacobs et al. (2013), the relative depths of CDW and outer shelf sills is more likely to determine whether the warmer ocean waters reach inner shelf troughs.
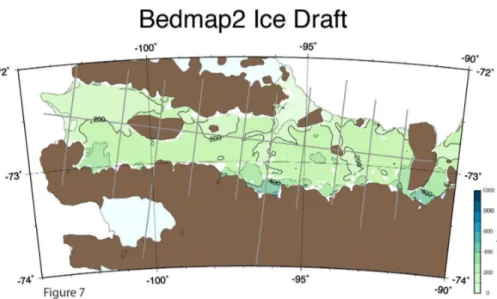
Ice draft beneath the Abbot Ice Shelf, calculated from the Bedmap2 compilation
25
TCD
7, 5509–5540, 2013Tectonic and oceanographic controls on Abbot Ice
Shelf
J. R. Cochran et al.
Title Page
Abstract Introduction
Conclusions References
Tables Figures
◭ ◮
◭ ◮
Back Close
Full Screen / Esc
Printer-friendly Version Interactive Discussion
Discussion
P
a
per
|
D
iscussion
P
a
per
|
Discussion
P
a
per
|
Discuss
ion
P
a
per
ice only extends more than a few km from grounding lines at locations where linear sets of ice rises mark fault footwall rims that may serve as sills preventing free access by CDW and lower thermocline water (e.g., Fig. 3b, line 6). This suggests that most of the ice shelf draft is controlled by the thickness of the cold surface water overlaying the thermocline (Figs. 6 and 7).
5
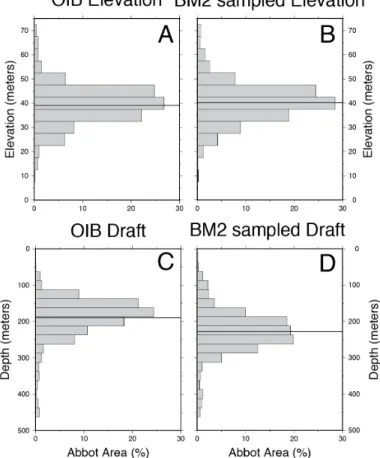
The mean depth below sea level of the Abbot Ice Shelf base from along-track OIB altimeter and radar measurements is 189.7 m,∼40 m less than the mean draft deter-mined from the Bedmap2 compilation (Figs. 6 and 8). However, the OIB and Bedmap2 elevation distributions are similar, with insignificantly different means of 39.2 and 40.2 m (Fig. 8), indicative of anomalies in one or both draft calculations. In the OIB case, no firn
10
correction has been applied to the radar measurements, which could lead to thickness underestimates of∼10 m (Fretwell et al., 2013). Radar results can also underestimate total thickness where bottom returns come from meteoric ice/marine ice interfaces. Ma-rine ice is probably not widespread at the base of the Abbot, but may occur at its thinner western end (Rignot et al., 2013), and seasonally when the ocean surface mixed layer
15
thickens.
The Bedmap2 compilation utilized the Griggs and Bamber (2011) determination of ice shelf thickness that is based on a firn densification model and the thickness nec-essary to support the observed elevations assuming hydrostatic equilibrium. Although Bedmap2 incorporates negative corrections of 21–81 m, based on firn-corrected radar
20
data, to most of the Griggs and Bamber (2011) ice shelf thickness values in the Amund-sen sector (Fretwell et al., 2013), no corrections were applied to the Abbot where ap-propriate data were not available. This suggests that the Bedmap2 drafts are too large by several tens of meters. It thus appears likely that the average draft of the Abbot is closer to, but slightly greater than, that derived from the OIB measurements, i.e.,
25
TCD
7, 5509–5540, 2013Tectonic and oceanographic controls on Abbot Ice
Shelf
J. R. Cochran et al.
Title Page
Abstract Introduction
Conclusions References
Tables Figures
◭ ◮
◭ ◮
Back Close
Full Screen / Esc
Printer-friendly Version Interactive Discussion
Discussion
P
a
per
|
D
iscussion
P
a
per
|
Discussion
P
a
per
|
Discuss
ion
P
a
per
|
water” layer will cool and thicken seasonally, its variable depth influencing melt rates over much of the ice shelf.
The thick continental ice that flows into the Abbot appears to be largely consumed by melting within a few km of glacier grounding zones (Rignot et al., 2013). That implies higher local melt rates than the August 2007–2008 area-average equilibrium rate of
5
1.90 m yr−1. Faster melting of thicker ice would be consistent with its exposure to CDW and lower thermocline waters. Once the ice has thinned to the depth range of upper thermocline and lower surface waters, melting will be controlled more by the temporal variability of the upper ocean thermal structure and the density driven cavity circulation. With an overall average draft of ∼200 m, much of the Abbot is now sensitive to
10
changes in depth of the surface mixed layer, which can be high in the Amundsen Sea (Jacobs et al., 2013). Surface water properties depend mainly on atmospheric forcing, as does the ice shelf surface, where seasonal melting can cause instability by enhanc-ing crevasse propagation (Scambos et al., 2000). The current surface melt intensity on the Abbot is less than at ice shelves further north on the Antarctic Peninsula (Trusel
15
et al., 2012), but the relatively thin state of the ice shelf may render it more vulnerable than thicker ice to increased summer air temperatures.
4 Conclusions
Inversion of NASA Operation IceBridge gravity data shows the portion of the Abbot Ice Shelf west of 94◦W to be underlain by a series of rift basins (Figs. 3–5). East of 94◦W,
20
the bathymetry is shallower and has not been modified by tectonic activity. West of 99◦W, the region of rifting extends farther south and includes the Cosgrove Ice Shelf (Fig. 5). These basins appear to be related to rifting between Antarctica and Chatham Rise in the Late Cretaceous.
Oceanographic measurements are sparse near the Abbot, limiting our understanding
25
TCD
7, 5509–5540, 2013Tectonic and oceanographic controls on Abbot Ice
Shelf
J. R. Cochran et al.
Title Page
Abstract Introduction
Conclusions References
Tables Figures
◭ ◮
◭ ◮
Back Close
Full Screen / Esc
Printer-friendly Version Interactive Discussion
Discussion
P
a
per
|
D
iscussion
P
a
per
|
Discussion
P
a
per
|
Discuss
ion
P
a
per
below depths of 400 m beneath a thermocline with temperatures well above the in situ freezing point up to 200–250 m. The rift structures beneath the ice shelf present pathways for this water to circulate under much of the ice shelf.
OIB radar data show a thinner ice shelf than the Bedmap2 compilation with an av-erage draft of∼190 m. Consideration of likely errors in the two data sets leads to the
5
conclusion that the actual mean draft is∼200 m with the draft of most of the ice shelf in the range of 150–250 m.
The Abbot differs from most other West Antarctic ice shelves by not being a sea-ward extension of large glaciers, and by overlying tectonically formed basins rather than deeply scoured glacial troughs. With the bed in surrounding areas on Thurston
10
Island and the Eights Coast near or above sea level, ice shelf grounding lines are rel-atively stable. At present the Abbot is close to a state of mass balance between inflow, accumulation, minor calving and basal melting (Rignot et al., 2013). The average ice shelf draft appears to be maintained by the depth of the ocean’s cold surface water and upper thermocline, while CDW and lower thermocline waters rapidly melt thicker
15
inflowing ice. An equilibrium mean thickness of only 240 m makes the Abbot potentially vulnerable to future changes in atmospheric forcing.
Acknowledgements. We thank Michael Studinger, Nick Frearson, Stefan Elieff and
Sean O’Rourke for their efforts during the 2009 OIB Antarctic field campaign. This work was support by NASA grants NNX09AR49G, NNX10AT69G and NNX13AD25A. This is LDEO
con-20
tribution No. XXXX.
References
Argyle, M., Ferguson, S., Sander, L., and Sander, S.: AIRGrav results: a comparison of airborne gravity data with GSC test site data, The Leading edge, 19, 1134–1138, 2000.
Arndt, J. S., Schenke, H. W., Jakobsson, M., Nitsche, F. O., Buys, G., Goleby, B., Rebesco, M.,
25
TCD
7, 5509–5540, 2013Tectonic and oceanographic controls on Abbot Ice
Shelf
J. R. Cochran et al.
Title Page
Abstract Introduction
Conclusions References
Tables Figures
◭ ◮
◭ ◮
Back Close
Full Screen / Esc
Printer-friendly Version Interactive Discussion
Discussion
P
a
per
|
D
iscussion
P
a
per
|
Discussion
P
a
per
|
Discuss
ion
P
a
per
|
(IBCSO) Version 1.0 – a new bathymetric compilation covering circum-Antarctic waters, Geo-phys. Res. Lett., 40, 3111–3117, doi:10.1002/grl.50413, 2013.
Cochran, J. R. and Bell, R. E.: IceBridge Sander AIRGrav L1B Geolocated Free Air Gravity Anomalies, V01.5, digital media, National Snow and Ice Data Center, Boulder, Colorado, 2010.
5
Cochran, J. R. and Bell, R. E.: Inversion of IceBridge gravity data for continental shelf bathymetry beneath the Larsen ice shelf, Antarctica, J. Glaciol., 58, 540–552, doi:10.3189/2012JoG11J033, 2012.
Craddock, C., Bastien, T. W., and Rutford, R. H.: Geology of the Jones Mountains area, in: Antarctic Geology: Proceedings of the First International Symposium on Antarctic Geology,
10
edited by: Adie, R. J., North Holland Publishing, Amsterdam, 171–187, 1964.
Craddock, C., White, C. M., and Rutford, R. H.: The geology of the Eights Coast, Antarct. J. US, 4, 93–94, 1969.
De Angelis, H. and Skvarca, P.: Glacier surge after ice shelf collapse, Science, 99, 1560–1562, 2003.
15
Depoorter, M. A., Bamber, J. L., Griggs, J. A., Lenaerts, J., Ligtenberg, S. R. M., van den Broeke, M. R., and Moholdt, G.: Calving fluxes and basal melt rates of Antarctic ice shelves, Nature, 502, 89–93, doi:10.1038/nature12567, 2013.
Dupont, T. K. and Alley, R. B.: Assessment of the importance of ice-shelf buttressing to ice-shelf flow, Geophys. Res. Lett., 32, L04503, doi:10.1029/2004GL022024, 2005.
20
Eagles, G., Gohl, K., and Larter, R. D.: High-resolution animated tectonic reconstruction of the South Pacific and West Antarctic Margin, Geochem. Geophy. Geosy., 5, Q07002, doi:10.1029/2003GC000657, 2004.
Fox, A. J. and Cooper, P. R.: Measured properties of theAntarctic ice sheet derived from the SCAR Antarctic digital database, Polar Rec., 30, 201–206, 1994.
25
Fretwell, P., Pritchard, H. D., Vaughan, D. G., Bamber, J. L., Barrand, N. E., Bell, R., Bianchi, C., Bingham, R. G., Blankenship, D. D., Casassa, G., Catania, G., Callens, D., Conway, H., Cook, A. J., Corr, H. F. J., Damaske, D., Damm, V., Ferraccioli, F., Forsberg, R., Fujita, S., Gim, Y., Gogineni, P., Griggs, J. A., Hindmarsh, R. C. A., Holmlund, P., Holt, J. W., Jaco-bel, R. W., Jenkins, A., Jokat, W., Jordan, T., King, E. C., Kohler, J., Krabill, W.,
Riger-30
TCD
7, 5509–5540, 2013Tectonic and oceanographic controls on Abbot Ice
Shelf
J. R. Cochran et al.
Title Page
Abstract Introduction
Conclusions References
Tables Figures
◭ ◮
◭ ◮
Back Close
Full Screen / Esc
Printer-friendly Version Interactive Discussion
Discussion
P
a
per
|
D
iscussion
P
a
per
|
Discussion
P
a
per
|
Discuss
ion
P
a
per
Sun, B., Tinto, B. K., Welch, B. C., Wilson, D., Young, D. A., Xiangbin, C., and Zirizzotti, A.: Bedmap2: improved ice bed, surface and thickness datasets for Antarctica, The Cryosphere, 7, 375–393, doi:10.5194/tc-7-375-2013, 2013.
Giulivi, C. F. and Jacobs, S. S.: Oceanographic data in the Amundsen and Bellingshausen Seas;
N. B. Palmer Cruise 9402, February–March 1994, Technical Report LDEO-97-3,
Lamont-5
Doherty Earth Observatory of Columbia University, 330 pp., 1997.
Gohl, K., Nitsche, F. O., and Miller, H. L.: Seiamic and gravity data reveal Tertiary interplate subduction in the Bellingshausen Sea, southeast Pacific, Geology, 25, 371–374, 1997. Gohl, K., Teterin, D., Eagles, G., Netzeband, G., Grobys, J. W. G., Parsiegla, N., Schlüter, P.,
Leinweber, V., Larter, R. D., Uenzelmann-Neben, G., and Udintsev, G. B.: Geophysical
sur-10
vey reveals structures in the Amundsen Sea embayment, West Antarctica, in: Proceedings of the 10th Int. Symposium of Antarctic Earth Sciences, edited by: Cooper, A. K. and Ray-mond, C. R., USGS Open-File Report 2007-1047, 2007.
Graham, A. G. C., Nitsche, F. O., and Larter, R. D.: An improved bathymetry compilation for the Bellingshausen Sea, Antarctica, to inform ice-sheet and ocean models, The Cryosphere, 5,
15
95–106, doi:10.5194/tc-5-95-2011, 2011.
Griggs, J. A. and Bamber, J. L.: Antarctic ice-shelf thickness from satellite radar altimetry, J. Glaciol., 57, 485–498, 2011.
Grunow, A. M., Kent, D. V., and Dalziel, I. W. D.: New paleomagnetic data from Thurston Island: implications for the tectonics of West Antarctica and Weddell Sea opening, J. Geophys. Res.,
20
96, 17935–17954, 1991.
Hagen, R. A., Gohl, K., Gesonde, R., Kuhn, G., Völker, D., and Kodagali, V. N.: A geophysical survey of the De Gerlache Seamounts: preliminary results, Geo-Mar. Lett., 18, 19–25, 1998. Hellmer, H. H., Jacobs, S. S., and Jenkins, A.: Oceanic erosion of a floating Antarctic glacier in
the Amundsen Sea, in: Ocean, Ice and Atmosphere: Interactions at the Antarctic Continetal
25
Margins, Antarctic Research Series v75, edited by: Jacobs, S. S. and Weiss, R. F., American Geophysical Union, Washington, D. C., 83–99, 1998.
Holland, P. R., Corr, H. F. J., Vaughan, D. G., Jenkins, A., and Skvarca, P.: Marine ice in Larsen ice shelf, Geophys. Res. Lett., 36, L11604, doi:10.1029/2009GL038162, 2009.
Jacobs, S. S., Hellmer, H. H., and Jenkins, A.: Antarctic ice sheet melting in the southeast
30
TCD
7, 5509–5540, 2013Tectonic and oceanographic controls on Abbot Ice
Shelf
J. R. Cochran et al.
Title Page
Abstract Introduction
Conclusions References
Tables Figures
◭ ◮
◭ ◮
Back Close
Full Screen / Esc
Printer-friendly Version Interactive Discussion
Discussion
P
a
per
|
D
iscussion
P
a
per
|
Discussion
P
a
per
|
Discuss
ion
P
a
per
|
Jacobs, S. S., Jenkins, A., Giulivi, C. F., and Dutrieux, P.: Stronger ocean circulation and increased melting under Pine Island Glacier ice shelf, Nat. Geosci., 4, 519–523, doi:10.1038/NEGEO1188, 2011.
Jacobs, S. S., Giulivi, C. F., Dutrieux, P., Rignot, E., Nitsche, F. O., and Mouginot, J.: Getz Ice Shelf melting response to changes in ocean forcing, J. Geophys. Res., 118, 1–17,
5
doi:10.1002/jgrc20298, 2013.
Jarvis, E. P. and King, E. C.: Seismic investigation of the Larsen Ice Shelf, Antarctica: in search of the Larsen Basin, Antarct. Sci., 7, 181–190, 1995.
Jenkins, A., Vaughan, D. G., Jacobs, S. S., Hellmer, H. H., and Keys, J. R.: Glaciological and oceanographic evidence of high melt rates beneath Pine Island Glacier, West Antarctica, J.
10
Glaciol., 43, 114–121, 1997.
Jenkins, A., Dutrieux, P., Jacobs, S. S., McPhail, S. D., Perrett, J. R., Webb, A. T., and White, D.: Observations beneath Pine Island Glacier in West Antarctica and implications for its retreat, Nat. Geosci., 3, 468–472, doi:10.1038/NGE0890, 2010.
Johnson, M. R. and Smith, A. M.: Seabed topography under the southern and western Ronne
15
Ice Shelf, derived from seismic surveys, Antarct. Sci., 9, 201–208, 1997.
Krabill, W.: IceBridge ATM L2 Icessn Elevation, Slope, and Roughness, V01, digital media, National Snow and Ice Data Center, Boulder, Colorado, 2010.
Krabill, W., Abdalati, W., Frederick, E. R., Manizade, S. S., Martin, C. F., Sonntag, J. G., Swift, R. N., Thomas, R. H., and Yungel, J. G.: Aircraft laser altimetry measurement of
eleva-20
tion changes of the Greenland Ice Sheet: techniques and accuracy assessment, J. Geodyn., 34, 357–376, 2002.
Kusahara, K. and Hushumi, H.: Modeling Antarctic ice shelf responses to future climate change and impacts on the ocean, J. Geophys. Res., 118, 1–22, doi:10.1002/jgrc.20166, 2013. Larter, R. D., Cunningham, A. P., Barker, P. F., Gohl, K., and Nitsche, F. O.: Tectonic evolution
25
of the Pacific margin of Antarctica 1. Late Cretaceous tectonic reconstructions, J. Geophys. Res., 107, 2345, doi:10.1029/2000JB000052, 2002.
Leuschen, C.: IceBridge MCoRDS L1B Geolocated Radar Echo Strength Profiles, V01.3, digital media, National Snow and Ice Data Center, Boulder, Colorado, 2011.
Lopatin, B. G. and Orlenko, E. M.: Outline of the geology of Marie Byrd Land and the Eights
30
TCD
7, 5509–5540, 2013Tectonic and oceanographic controls on Abbot Ice
Shelf
J. R. Cochran et al.
Title Page
Abstract Introduction
Conclusions References
Tables Figures
◭ ◮
◭ ◮
Back Close
Full Screen / Esc
Printer-friendly Version Interactive Discussion
Discussion
P
a
per
|
D
iscussion
P
a
per
|
Discussion
P
a
per
|
Discuss
ion
P
a
per
Lowe, A. L. and Anderson, J. B.: Reconstruction of the West Antarctic ice sheet in Pine Island Bay during the Last Glacial Maximum and its subsequent retreat history, Quaternary Sci. Rev., 21, 1879–1897, 2002.
McAdoo, D. C. and Laxon, S. W.: Antarctic tectonics: constraints from an ERS-1 satellite marine gravity field, Science, 276, 556–560, doi:10.1126/science.276.5312.556, 1997.
5
Nitsche, F. O., Jacobs, S. S., Larter R. D., and , and Gohl, K.: Bathymetry of the Amundsen Sea continental shelf: implications for geology, oceanography and glaciology, Geochem. Geophy. Geosy., 8, Q10009, doi:10010.11029/12007GC001694, 2007.
Padman, L., Costa, D. P., Dinniman, M. S., Fricker, H. A., Goebel, M. E., Huckstadt, L. A., Humbert, A., Joughin, I., Lenaerts, J., Ligtenberg, S. R. M., Scambos, T. A., and van den
10
Broeke, M. R.: Ocean controls on the mass balance of Wilkins Ice Shelf, Antarctica, J. Geo-phys. Res., 117, C01010, doi:10.1029/2011JC007301, 2012.
Pankhurst, R. J., Millar, I. L., Grunow, A. M., and Storey, B. C.: The pre-Cenozoic magmatic history of the Thurston Island crustal block, West Antarctica, J. Geophys. Res., 98, 11835– 11849, 1993.
15
Prestvik, T., Barnes, C. G., Sundvoll, B., and Duncan, R. A.: Petrology of Peter I Øy (Peter I Island), West Antarctica, J. Volcanol. Geoth. Res., 44, 315–338, 1990.
Prestvik, T. and Duncan, R. A.: The geology and age of Peter 1 Øy, antarctica, Polar Res., 9, 89–98, 1991.
Pritchard, H. D., Ligtenberg, S. R. M., Fricker, H. A., Vaughan, D. G., van der Broeke, M. R.,
20
and Padman, L.: Antarctic ice-sheet loss driven by basal melting of ice shelves, Nature, 484, 502–505, doi:10.1038/nature10968, 2012.
Rignot, E.: Fast recession of a West Antarctic glacier, Science, 549, 549–551, doi:10.1126/science.281.5376.549, 1998.
Rignot, E., Casassa, G., Gogineni, P., Krabill, W., Rivera, A., and Thomas, R. H.: Accelerated
25
ice discharge from the Antarctic Peninsula following the collapse of the Larsen B ice shelf, Geophys. Res. Lett., 31, 18401, doi:1029/2004GL020697, 2004.
Rignot, E., Jacobs, S. S., Mouginot, J., and Scheuchl, B.: Ice shelf melting around Antarctica, Science, 341, 266–270, doi:10.1126/science1235798, 2013.
Rott, H., Rack, W., Skvarca, P., and De Angelis, H.: Northern Larsen ice shelf, Antarctica: further
30
TCD
7, 5509–5540, 2013Tectonic and oceanographic controls on Abbot Ice
Shelf
J. R. Cochran et al.
Title Page
Abstract Introduction
Conclusions References
Tables Figures
◭ ◮
◭ ◮
Back Close
Full Screen / Esc
Printer-friendly Version Interactive Discussion
Discussion
P
a
per
|
D
iscussion
P
a
per
|
Discussion
P
a
per
|
Discuss
ion
P
a
per
|
Rutford, R. H., Craddock, C., White, C. M., and Armstrong, R. L.: Tertiary glaciation in the Jones Mountains, in: Antarctic Geology and Geophysics, edited by: Adie, R. J., Universitetsforlage, Oslo, 239–243, 1972.
Sander, S., Argyle, M., Elieff, S., Ferguson, S., Lavoie, V., and Sander, L.: The AIRGrav ai-borne gravity system, in: Airai-borne Gravity 2004 – Australian Society of Exploration
Geo-5
physicists Workshop, edited by: Lane, R., Geoscience Australia, available at: http://sgl.com/ technicalpapers/AIRGrav_airborne_grav_sys.pdf, 49–53, 2004.
Scambos, T. A., Hulbe, C. L., Fahnestock, M. A., and Bohlander, J.: The link between climate warming and the break-up of ice shelves in the Antarctic Peninsula, J. Glaciol., 46, 516–530, 2000.
10
Shepherd, A., Wingham, D., and Rignot, E.: Warm ocean is eroding West Antarctica, Geophys. Res. Lett., 31, L23402, doi:10.1029/2004GL021106, 2004.
Storey, B. C., Pankhurst, R. J., Millar, I. L., Dalziel, I. W. D., and Grunow, A. M.: A new look at the geology of Thurston Island, in: Geological Evolution of Antarctica, edited by: Thom-son, M. R. A., Crame, J. A., and ThomThom-son, J. W., Cambridge University Press, Cambridge,
15
399–403, 1991.
Studinger, M., Bell, R. E., and Frearson, N.: Comparison of AIRGrav and GT-1A airborne gravimeters for research applications, Geophysics, 73, 151–161, 2008.
Swithinbank, C., Williams, R. S., Ferrigno, J. G., Foley, K. M., Rosanova, C. E., and Dal-lide, L. M.: Coastal-change and glaciological map of the Eights Coast area, Antarctica 1972–
20
2001, Text to accompany Map I-2600-E, US Geological Survey Geologic Investigations Se-ries Map I-2600-E, 2004.
Talwani, M., Worzel, J. L., and Landisman, M.: Rapid gravity computations for two-dimensional bodies with application to the Mendicino submarine fracture zone, J. Geophys. Res., 64, 49–59, 1959.
25
Timmermann, R., Wang, Q., and Hellmer, H. H.: Ice-shelf basal melting ina global finite element sea-ice/ice-shelf/ocean model, Ann. Glaciol., 53, 303–314, doi:10.3189/2012AoG60A156, 2012.
Tinto, K. J. and Bell, R. E.: Progressive unpinning of Thwaites Glacier from newly iden-tified offshore ridge – constraints from aerogravity, Geophys. Res. Lett., 38, L20503,
30
TCD
7, 5509–5540, 2013Tectonic and oceanographic controls on Abbot Ice
Shelf
J. R. Cochran et al.
Title Page
Abstract Introduction
Conclusions References
Tables Figures
◭ ◮
◭ ◮
Back Close
Full Screen / Esc
Printer-friendly Version Interactive Discussion
Discussion
P
a
per
|
D
iscussion
P
a
per
|
Discussion
P
a
per
|
Discuss
ion
P
a
per
Trusel, L. D., Frey, K. E., and Das, S. B.: Antarctic surface melting dynamics: En-hanced perspectives from radar scatterometer data, J. Geophys. Res., 117, F02023, doi:10.1029/2011JF002126, 2012.
Wellner, J. S., Lowe, A. L., Shipp, S. S., and Anderson, J. B.: Distribution of glacial geomorphic features on the Antarctic continental shelf and correlation with substrate: implications for ice
5
behavior, J. Glaciol., 47, 397–411, 2001.
TCD
7, 5509–5540, 2013Tectonic and oceanographic controls on Abbot Ice
Shelf
J. R. Cochran et al.
Title Page
Abstract Introduction
Conclusions References
Tables Figures
◭ ◮
◭ ◮
Back Close
Full Screen / Esc
Printer-friendly Version Interactive Discussion
Discussion
P
a
per
|
D
iscussion
P
a
per
|
Discussion
P
a
per
|
Discuss
ion
P
a
per
|
Fig. 1. Map of the Abbot Ice Shelf (from Swithinbank et al., 2004) showing the location of
TCD
7, 5509–5540, 2013Tectonic and oceanographic controls on Abbot Ice
Shelf
J. R. Cochran et al.
Title Page
Abstract Introduction
Conclusions References
Tables Figures
◭ ◮
◭ ◮
Back Close
Full Screen / Esc
Printer-friendly Version Interactive Discussion
Discussion
P
a
per
|
D
iscussion
P
a
per
|
Discussion
P
a
per
|
Discuss
ion
P
a
per
Fig. 2. Free-air gravity anomalies from Operation IceBridge flights over the Abbot Ice Shelf
TCD
7, 5509–5540, 2013Tectonic and oceanographic controls on Abbot Ice
Shelf
J. R. Cochran et al.
Title Page
Abstract Introduction
Conclusions References
Tables Figures
◭ ◮
◭ ◮
Back Close
Full Screen / Esc
Printer-friendly Version Interactive Discussion
Discussion
P
a
per
|
D
iscussion
P
a
per
|
Discussion
P
a
per
|
Discuss
ion
P
a
per
|
Fig. 3a.Airborne geophysics line 0 along the axis of the Abbot Ice Shelf (Fig. 2) broken into
TCD
7, 5509–5540, 2013Tectonic and oceanographic controls on Abbot Ice
Shelf
J. R. Cochran et al.
Title Page
Abstract Introduction
Conclusions References
Tables Figures
◭ ◮
◭ ◮
Back Close
Full Screen / Esc
Printer-friendly Version Interactive Discussion
Discussion
P
a
per
|
D
iscussion
P
a
per
|
Discussion
P
a
per
|
Discuss
ion
P
a
per
Fig. 3b.As in Fig. 3a, but for the north-south airborne geophysics lines with vertical red lines
TCD
7, 5509–5540, 2013Tectonic and oceanographic controls on Abbot Ice
Shelf
J. R. Cochran et al.
Title Page
Abstract Introduction
Conclusions References
Tables Figures
◭ ◮
◭ ◮
Back Close
Full Screen / Esc
Printer-friendly Version Interactive Discussion
Discussion
P
a
per
|
D
iscussion
P
a
per
|
Discussion
P
a
per
|
Discuss
ion
P
a
per
|
TCD
7, 5509–5540, 2013Tectonic and oceanographic controls on Abbot Ice
Shelf
J. R. Cochran et al.
Title Page
Abstract Introduction
Conclusions References
Tables Figures
◭ ◮
◭ ◮
Back Close
Full Screen / Esc
Printer-friendly Version Interactive Discussion
Discussion
P
a
per
|
D
iscussion
P
a
per
|
Discussion
P
a
per
|
Discuss
ion
P
a
per
Fig. 4.Basins, faults and the spatial extent of rifting under Abbot and Cosgrove ice shelves, from
TCD
7, 5509–5540, 2013Tectonic and oceanographic controls on Abbot Ice
Shelf
J. R. Cochran et al.
Title Page
Abstract Introduction
Conclusions References
Tables Figures
◭ ◮
◭ ◮
Back Close
Full Screen / Esc
Printer-friendly Version Interactive Discussion
Discussion
P
a
per
|
D
iscussion
P
a
per
|
Discussion
P
a
per
|
Discuss
ion
P
a
per
|
Fig. 5.Entire length of airborne geophysics lines 3 and 6, as in Fig. 3, with line locations shown
TCD
7, 5509–5540, 2013Tectonic and oceanographic controls on Abbot Ice
Shelf
J. R. Cochran et al.
Title Page
Abstract Introduction
Conclusions References
Tables Figures
◭ ◮
◭ ◮
Back Close
Full Screen / Esc
Printer-friendly Version Interactive Discussion
Discussion
P
a
per
|
D
iscussion
P
a
per
|
Discussion
P
a
per
|
Discuss
ion
P
a
per
Fig. 6. (A)Measured temperature (T) and calculated temperature above the in-situ freezing
TCD
7, 5509–5540, 2013Tectonic and oceanographic controls on Abbot Ice
Shelf
J. R. Cochran et al.
Title Page
Abstract Introduction
Conclusions References
Tables Figures
◭ ◮
◭ ◮
Back Close
Full Screen / Esc
Printer-friendly Version Interactive Discussion
Discussion
P
a
per
|
D
iscussion
P
a
per
|
Discussion
P
a
per
|
Discuss
ion
P
a
per
|
Fig. 7.Abbot Ice Shelf draft calculated from the 1 km Bedmap2 compilation of surface elevation
TCD
7, 5509–5540, 2013Tectonic and oceanographic controls on Abbot Ice
Shelf
J. R. Cochran et al.
Title Page
Abstract Introduction
Conclusions References
Tables Figures
◭ ◮
◭ ◮
Back Close
Full Screen / Esc
Printer-friendly Version Interactive Discussion
Discussion
P
a
per
|
D
iscussion
P
a
per
|
Discussion
P
a
per
|
Discuss
ion
P
a
per
Fig. 8.Distribution of Abbot Ice Shelf surface elevations and drafts below the sea surface.(A)
Surface ice elevation from OIB altimeter data at 0.2 km intervals along flight lines.(B)Surface ice elevation from Bedmap2 surface elevation grid sampled at the same locations as the OIB elevation data.(C)Draft from OIB altimeter and radar data at 0.2 km intervals along flight lines,