www.geosci-model-dev.net/4/69/2011/ doi:10.5194/gmd-4-69-2011
© Author(s) 2011. CC Attribution 3.0 License.
Geoscientific
Model Development
Evaluation of a present-day climate simulation with a new coupled
atmosphere-ocean model GENMOM
J. R. Alder1, S. W. Hostetler2, D. Pollard3, and A. Schmittner4
1Oregon State University, Department of Geosciences, Corvallis, OR 97331, USA
2US Geological Survey, Oregon State University, Department of Geosciences, Corvallis, OR 97331, USA 3Pennsylvania State University, EMS Earth and Environmental Systems, University Park, PA 16802, USA 4Oregon State University, College of Ocean and Atmospheric Sciences, Corvallis, OR 97331, USA
Received: 22 September 2010 – Published in Geosci. Model Dev. Discuss.: 15 October 2010 Revised: 20 January 2011 – Accepted: 21 January 2011 – Published: 2 February 2011
Abstract. We present a new, non-flux corrected AOGCM, GENMOM, that combines the GENESIS version 3 atmo-spheric GCM (Global Environmental and Ecological Simu-lation of Interactive Systems) and MOM2 (Modular Ocean Model version 2) nominally at T31 resolution. We evalu-ate GENMOM by comparison with reanalysis products (e.g., NCEP2) and three models used in the IPCC AR4 assessment. GENMOM produces a global temperature bias of 0.6◦C. At-mospheric features such as the jet stream structure and major semi-permanent sea level pressure centers are well simulated as is the mean planetary-scale wind structure that is needed to produce the correct position of stormtracks. Most ocean surface currents are reproduced except where they are not resolvable at T31 resolution. Overall, GENMOM captures reasonably well the observed gradients and spatial distribu-tions of annual surface temperature and precipitation and the simulations are on par with other AOGCMs. Deficiencies in the GENMOM simulations include a warm bias in the sur-face temperature over the southern oceans, a split in the ITCZ and weaker-than-observed overturning circulation.
1 Introduction
We present a new non-flux corrected coupled atmosphere-ocean general circulation model (AOGCM), GENMOM, which combines GENESIS version 3 (Global ENvironmen-tal and Ecological Simulation of Interactive Systems) and MOM2 (Modular Ocean Model version 2) general circula-tion models. Both models have been used widely in cli-mate studies that demonstrate their overall ability to produce climate simulations that are in agreement both with
obser-Correspondence to:J. R. Alder ([email protected])
vations and with similar models. GENESIS version 1 was developed initially in 1989 at the National Center for Atmo-spheric Research (NCAR) with a focus on linking terrestrial physical and biophysical processes with the atmosphere to provide a model that could be applied to simulate paleocli-mate and possible future clipaleocli-mates under global warming.
GENESIS version 1 was released in 1991 (Thompson and Pollard, 1995) and included a land-surface transfer model (LSX) and an atmospheric general circulation model derived from NCAR CCM1. GENESIS version 2 was released in 1995 and included many improvements ranging from new prognostic cloud amounts, the use of hybrid vertical coordi-nates, the inclusion of gravity wave drag, and additional im-provements in LSX (Thompson and Pollard, 1997; Pollard and Thompson, 1997).
GENESIS version 3 expands on version 2 by including the NCAR CCM3 radiation code. The ocean can optionally be represented by fixed sea surface temperatures (SSTs), a slab or mixed layer or by the MOM2 ocean general circulation model. MOM also has a long history of use and development also spanning back to the early 1990s and is used as the ocean component in many other AOGCMs (Pacanowski, 1996). Our current version of GENMOM uses T31 (∼3.75◦×3.75◦
latitude and longitude) horizontal resolution for both the at-mosphere and ocean to balance computational requirements needed for long simulations with the ability to simulate im-portant features of the general circulation. A higher reso-lution version with 2◦×2◦ ocean and LSX with T31 atmo-sphere is under development.
NCAR CCSM 3.0 National Center for Atmospheric Research, USA
T85 (1.4◦×1.4◦) L26 Collins et al. (2004)
0.3◦–1◦×1◦L40 Smith and Gent (2002)
Table 1, Randall et al., 2007). A full description of GEN-ESIS and MOM2 as well as their coupling is provided in Sect. 2, atmospheric and oceanic results from a modern cli-mate simulation are presented in Sect. 3, and concluding re-marks follow in Sect. 4.
2 GENMOM description
2.1 GENESIS description
GENESIS has been developed with emphasis on terrestrial physical and biophysical processes, and suitability for pa-leoclimatic experiments. Earlier versions of GENESIS are described by Thompson and Pollard (1995, 1997) and Pol-lard and Thompson (1994, 1995, 1997), and have been ap-plied and tested in a wide range of modern and paleoclimate applications including the Paleoclimate Modeling Intercom-parison Project (e.g., Pollard et al., 1998; Joussaume et al., 1999; Pinot et al., 1999; Beckmann et al., 2005; Miller et al., 2005; Ruddiman et al., 2005; Bice et al., 2006; DeConto et al., 2006, 2008; Hostetler et al., 2006; Poulsen et al., 2006, 2007; Horton et al., 2007).
The nominal GENESIS resolution is spectral T31 (3.75◦×3.75◦) with 18 vertical sigma coordinate levels, 4 of which are above the tropopause. Spectral transform dynam-ics are used for mass, heat and momentum (Williamson et al., 1987). A semi-Lagrangian transport in grid space is used for water vapor (Williamson and Rasch, 1989). Convection in the free atmosphere and in the planetary boundary layer is treated using an explicit sub-grid buoyant plume model similar to, but simpler than, Kreitzberg and Perkey (1976) and Anthes (1977, Sect. 4). Stratus, convective and anvil cir-rus clouds are predicted using prognostic 3-D water cloud amounts, (Smith, 1990; Senior and Mitchell, 1993) and clouds are advected by semi-Lagrangian transport and mixed vertically by convective plumes and background diffusion.
The land-surface transfer model, LSX, accounts for the physical effects of vegetation (Pollard and Thompson, 1995). Up to two vegetation layers (trees and grass) can be
speci-fied at each grid point, and the radiative and turbulent fluxes through these layers to the soil or snow surface are calcu-lated. A six-layer soil model extends from the surface to 4.25 m depth, with layer thicknesses increasing from 5 cm at the top to 2.5 m at the bottom. Physical processes in the ver-tical soil column include heat diffusion, liquid water trans-port (Clapp and Hornberger, 1978; Dickinson, 1984), sur-face runoff and bottom drainage, uptake of liquid water by plant roots for transpiration, and the freezing and thawing of soil ice. A three-layer snow model, which includes frac-tional area cover when the snow is thin, is used for snow cover on soil, ice-sheet and sea-ice surfaces. A three-layer sea-ice model accounts for local melting, freezing, fractional sea-ice cover (Semtner, 1976; Harvey, 1988), and includes dynamics associated with wind and ocean current using the cavitating-fluid model of Flato and Hibler (1992). Version 3 of GENESIS (Zhou et al., 2008; Kump and Pollard, 2008) incorporates the NCAR CCM3 radiation code (Kiehl et al., 1998) and the ocean is represented by the MOM2 ocean gen-eral circulation model (Pacanowski, 1996).
2.2 MOM2 description
simplifies the equations used in the finite difference repre-sentation. Our version of MOM2 uses 20 unevenly spaced vertical levels that become progressively thicker with depth, so that the uppermost ocean layers are well resolved. The topmost level is 25 m thick, while the bottommost level is ∼660 m thick. A horizontal resolution of 3.75◦×3.75◦ is used to match the atmospheric T31 resolution. The hybrid mixing scheme isopycmix is used with a prescribed vertical viscosity coefficient of 0.1 cm2s−1 and a prescribed verti-cal diffusion coefficient of 0.35 cm2s−1. Although the Gent-McWilliams mixing scheme (Gent and Gent-McWilliams, 1990) is available in MOM2, it was not used in this study.
2.3 GENMOM coupling
To simplify the coupling between the atmosphere and ocean, both the GCMs are implemented on essentially the same T31 grid. In MOM2, the latitudinal grid spacing is not exactly T31, but is adjusted with a cosine-stretching factor (Pacanowski, 1996) to closely approximate T31. GENESIS has a 30-min timestep, and MOM2 has a 6-h timestep for scalar fields. The two models interact in an essentially syn-chronous manner, communicating every 6 hours: 6-h aver-ages of the surface fluxes of heat, water and momentum are passed from GENESIS to MOM2, and MOM2 is run through one 6-h scalar timestep and the updated SSTs are passed back to GENESIS and used to run it for the next 6 h. Sea ice is treated within the LSX module of GENESIS. Under sea ice, fluxes between the base and the uppermost ocean layer are passed to MOM2. Continental freshwater river runoff is globally averaged and spread over the world ocean. The T31 version of GENMOM simulates ∼22 yr per calendar day on an 8-CPU Linux server. GENMOM coupled to MOM2 has previously been used by Zhou et al. (2008) to investi-gate warm Cretaceous climates; however, their study focused mainly on paleoclimates and water isotopic ratios, and not on modern climatology.
3 Simulation of the present-day climate
We analyze the annual and seasonal climatologies of the last 30 years of a 700-year GENMOM simulation. Analy-sis of ocean temperature indicates that spin up of the model was suitably achieved after 400 years. Over the last cen-tury of the simulation the deep ocean (>1000 m) warmed by ∼0.002◦C/decade, the mid layers (200 m–1000 m) warmed by∼0.003◦C/decade and the surface temperature was es-sentially free of drift. We prescribed atmospheric CO2
con-centration at 355 ppmV, near the mean value for the 1981– 2005 climatology period. GENMOM was initialized with a latitudinal-dependent temperature profile and ocean salinity was uniformly prescribed at 35 PSS.
GENMOM input files for topography, bathymetry, and land-ocean mask were derived by interpolating the ICE-4G
model (Peltier, 2002) reconstruction from 1◦×1◦ to T31
resolution. Ice-sheet cover and thickness is prescribed by interpolating the ICE-4G model reconstruction to T31. To maintain numerical stability, we smooth the bathymetry field over the northermost Arctic Ocean with a 9-cell moving win-dow. At T31 horizontal resolution the Bering Strait is closed. Modern values for the distribution of vegetation (Dorman and Sellers, 1989), soil texture (Webb et al., 1993) and fresh-water lakes (Cogley, 1991) are prescribed. The use of ICE-4G orography to derive global topography, bathymetry, and ice-sheet extent is based on our goal of streamlining the con-figuration of GENMOM for paleoclimate applications. 3.1 Validation datasets and input files
To evaluate the GENMOM atmospheric fields we use the NOAA NCEP Reanalysis 2 data set (NCEP2, Kanamitsu, et al., 2002) for the standard climatology period of 1981–2005 unless otherwise specified. Although NCEP2 is comprised of observed and derived data it provides an internally consis-tent dataset with which to evaluate our model. SST data are derived from the NOAA Optimum Interpolation Sea Surface Temperature V2 (OI SST, Reynolds, et al., 2002), which is a 1◦×1◦ gridded dataset based on combining in situ mea-surements and satellite observations. We use a climatology period of 1982–2005 for OI SST, because 1982 is the first full year for which the data are available. Subsurface ocean tem-peratures were obtained from The World Ocean Atlas 2005 (WOA05, Locarnini et al., 2006), which is also a 1◦×1◦ gridded dataset of ocean temperature and salinity. We use the Hadley Ice and Sea Surface Temperature v1.1 (HadISST, UK Meteorological Office, 2006) for observed sea-ice extent data and to evaluate ocean surface currents and overturning, we use the German partner of the Estimating the Circula-tion and Climate of the Ocean dataset (GECCO), which is a 50-year (1950–2000) oceanography reanalysis (K¨ohl and Stammer, 2008; NCEP1; Kalnay et al., 1996).
3.2 Atmospheric fields
The zonally averaged profile of air temperature simulated by GENMOM is in overall agreement with the NCEP2 profile (Fig. 1). Seasonally, GENMOM simulates the meridional shift of peak insolation and warmest surface temperatures well although the modeled tropical warm region is slightly more compressed meridionally than that of the NCEP2 data. North of 30◦N in both boreal winter and summer GENMOM produces a cold bias relative to NECP2 from the surface ex-tending up to the mid-troposphere. An additional cold bias in the upper atmosphere is found over the polar region during boreal winter. A cold bias south of 60◦S is present during austral summer and in the upper atmosphere during winter.
Fig. 1. Mean-annual zonal averaged atmospheric temperature profiles. (a)Observed (NCEP2, 1981–2005) December, January, February (DJF),(b)Observed June, July, and August (JJA),(c)GENMOM DJF,(d)GENMOM JJA.
Fig. 2. Winter (DJF) and summer (JJA) zonally averaged eastward wind velocity. (a)Observed (NCEP2, 1981–2005) DJF,(b)Observed JJA,(c)GENMOM DJF,(d)GENMOM JJA.
core of the jetstream (at∼200 hPa) and related upper level winds (500 hPa) are slightly enhanced relative to those of the NCEP2 data. These minor mismatches notwithstanding, the overall structure of the simulated jetstream suggests that GENMOM produces a realistic mean planetary-scale wind structure that is essential to the related positioning of the stormtracks.
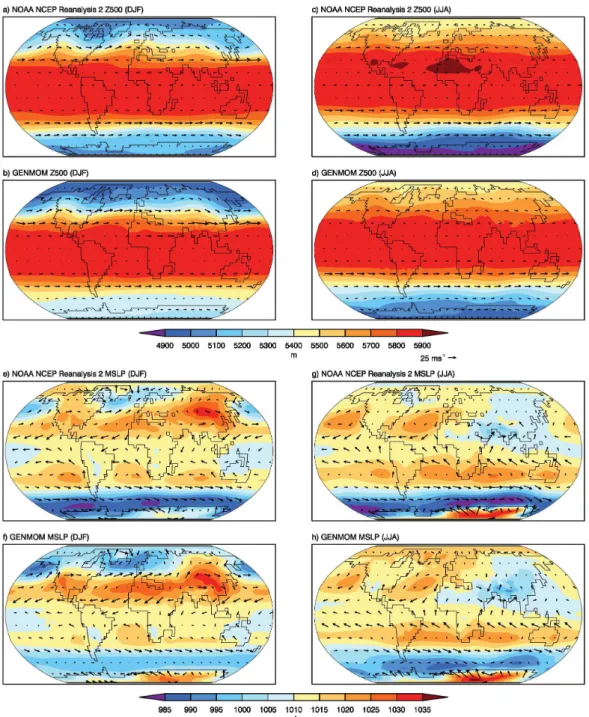
Fig. 3. 500 hPa geopotential height (Z500,a–d) and mean sea level pressure (MSLP,e–h) with wind vectors for both winter (DJF) and summer (JJA).
Atlantic and slightly more zonal flow than that of the NCEP2 data (Fig. 3b). The 500 hPa heights over North America and Eurasia are lower than those of the NCEP2 data resulting in reduced wind velocities, particularly over eastern North America and the North Atlantic. In the Southern Hemi-sphere (SH), austral summer 500 hPa heights are well sim-ulated but wind velocities associated with the westerlies are somewhat weaker than NCEP2 due to the lower pressure gra-dient over the Southern Ocean and Antarctica and the lack of actual topographic forcing due to the resolution of the model.
During boreal summer, the ridge over western North America is correctly placed in GENMOM, but the amplitude of the ridge and the related downstream trough is greater than that of the NCEP2 data (Fig. 3c). Heights in the region ex-tending east of the Mediterranean and across India and China appear modestly lower than observed; however, part of the apparent discrepancy stems from values that are just above or just below the color breaks in the plotting scales.
some regional differences (Fig. 3e–h). During boreal win-ter GENMOM simulates lower-than-observed MSLP in the Aleutian and Icelandic lows. As a result, surface wind veloc-ities are enhanced around the pressure centers and over North America. Stronger-than-observed westerly winds across southern Europe are simulated by GENMOM as a result of the enhanced Icelandic low and the cold temperature bias in the Norwegian Sea. In the SH (austral summer), surface pressure and winds are comparable with those of the NCEP2 but GENMOM simulates a weaker-than-observed subtropi-cal high and associated anticyclonic wind flow over the east-ern Pacific off the coast of South America (Fig. 3e and f). This deficiency in turn affects the magnitude of the north-ward wind along the coast and the strength of convergence and westerly trade winds in the Intertropical Convergence Zone (ITCZ). Over the Southern Ocean, the simulated gradi-ent of MSLP is weaker and more diffuse than that of NCEP2 resulting in lower surface wind velocity, which affects the location and strength of circulation around Antarctica.
The boreal summer MSLP pressure patterns and wind ve-locities in both hemispheres are well captured by GENMOM (Fig. 3g and h). The Northern Hemisphere (NH) subtropi-cal highs are well placed, but slightly weaker than NCEP2; the associated wind velocities are similar to those of NCEP2. MSLP and wind velocities in the tropics and the SH (aus-tral winter) are also well simulated by GENMOM; however, as is the case with DJF, the JJA high-pressure anticyclones are somewhat weaker than observed. Again, the associated anticyclonic flow around the subtropical highs is too weak which contributes to a weakened South Pacific Gyre. The SH westerly winds are simulated to be too weak, presumably due to coarse resolution topography, which will influence ocean overturning.
3.3 Surface temperature
The simulated global mean-annual 2 m air temperature is 278.3 K, in good agreement with the NCEP2 value of 278.9 K. Over land, the simulated temperature is 1.3 K colder than observed and over the oceans simulated tem-perature is 0.6 K warmer than observed. GENMOM cap-tures the observed meridional temperature and temperacap-tures over topographic features resolved by the model such as the Rocky Mountains, the Andes and the Himalayas. These re-gions have temperatures that compare well with observations (Fig. 4b). The temperature bias over land and much of the ocean is similar in magnitude to other AOGCMs (Fig. 4c–d). The cold bias over the Norwegian Sea reflects too much simulated sea-ice resulting from insufficient meridional over-turning. Warm biases are found over the Southern Ocean and in the upwelling region off the western coast of South Amer-ica (Fig. 4a). The Southern Ocean bias is attributed primar-ily to weaker-than-observed sea level pressure gradient and attendant reduced westerly wind strength (Fig. 3) which re-sults in weakened ocean overturning. The warm bias off the
Fig. 5. Observed and modeled seasonal cycle amplitude of sur-face temperature and anomalies. The amplitude of the seasonal cy-cle is calculated as the standard deviation of the 12 climatological months.
coast of South America is in part attributed to weaker shore-parallel winds associated with the reduced subtropical high (Fig. 3) and to the lack of resolution of finer scale currents in MOM. Lack of a California Current (∼300 km wide) is sim-ilarly attributed to the T31 resolution of the models. Further discussion of the oceanic circulation is given in Sect. 3.5.
Fig. 6. Zonal averaged annual precipitation for observations (black), GENMOM (red) and three IPCC AR4 models (gray). The IPCC AR4 models are averaged over the last 30 years (1970–1999) of the Climate of the 20th Century experiment.
Greenland, South America, southeast United States and Aus-tralia and underestimates the amplitude over northern Africa, the western United States and much of Europe and Asia (Fig. 5). The model also simulates greater variability over some of the oceans, particularly in the mid latitudes. 3.4 Precipitation
GENMOM simulates global mean-annual precipitation rea-sonably well relative to the reanalysis data (Figs. 4g and 6). Notable exceptions are dry biases over Southeast Asia and South America. GENMOM also produces a double ITCZ in the tropical Pacific, which is characterized by displacement of precipitation maxima off the equator (Lin, 2007). The dry biases and the double ITCZ are common to other AOGCMs (Fig. 4h–j).
During DJF, the southern branch of the ITCZ simulated by GENMOM extends too far to the east, whereas during JJA, the northern branch of the ITCZ is compressed and extends too far to the north relative to observations. Lin (2007) at-tributes the double ITCZ to: (1) excessive tropical precipita-tion, (2) high sensitivity of modeled precipitation and surface air humidity to SST, (3) a lack of sensitivity of cloud amount to precipitation, and (4) a lack of sensitivity of stratus cloud formation to SST. GENMOM produces a cold SST bias in the Pacific Basin along with a confined cold tongue, both of which Lin (2007) note as factors that result in a double ITCZ. Consistent with Lin (2007), GENMOM does not produce a double ITCZ when coupled to a slab ocean. The split ITCZ problem can potentially be resolved by improving resolution of tropical ocean-atmosphere feedbacks.
3.5 Oceanic fields
The global surface and subsurface patterns of ocean potential temperatures simulated by GENMOM are consistent with the WOA05 data (Fig. 7); however, anomalies reveal biases exceeding 2◦C (Fig. 7c), similar to other AOGCMs
(Ran-Fig. 7.Mean-annual zonally averaged ocean potential temperature profile. (a)Observed (WOA05),(b) GENMOM,(c)Anomalies, calculated as GENMOM – observed.
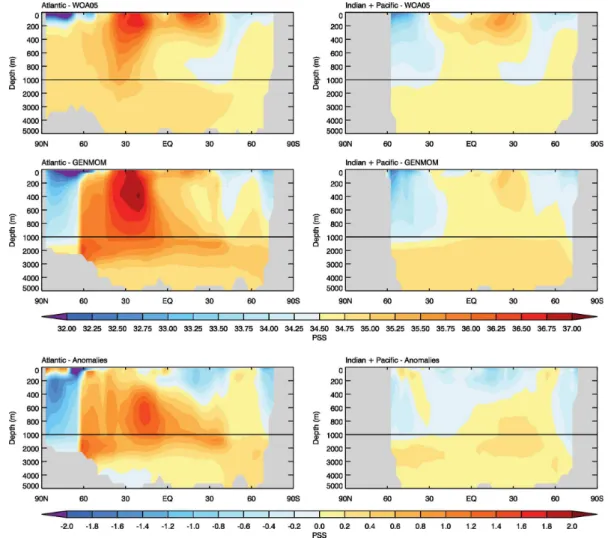
Fig. 8. Mean-annual zonally averaged ocean salinity profile for both observed (WOA05) and simulated (GENMOM) for the Atlantic Ocean (left), Indian and Pacific Oceans (right), and anomalies between observed and simulated.
GENMOM captures the zonal distributions of salinity with depth both between and within the Atlantic and Indian + Pa-cific basins (Fig. 8). Salinity in the Indian + PaPa-cific Oceans matches well to observations with much of the zonal bias being less than±0.2 PSS. Relative to the WOA05 data, in the Atlantic, GENMOM simulates lower salinity waters at high latitudes and higher salinity waters in the northern mid latitudes; the maximum centered on 30◦N exceeds obser-vations and the maximum at 30◦S underestimates
observa-tions. A 1+ PSS salinity bias in the northern mid latitudes between 400–1000 m is attributed to a build up of salinity in the Gulf of Mexico caused by weaker-than-observed circu-lation associated with the coarse resolution of ocean orogra-phy. Similarly, the low salinity bias north of 60◦N is as-sociated with reduced northward penetration of the North Atlantic Drift into the Arctic, again due to the coarse res-olution of ocean orography, and weaker-than-observed At-lantic Meridional Overturning Circulation (AMOC). Simi-lar to ocean temperature, the GENMOM salinity anomalies are comparable with those of other AOGCMs (Randall et al., 2007, Supplementary Materials, Pages 66–68).
Fig. 9.Ocean overturning for both observed (GECCO) and simulated (GENMOM, full 300-year simulation) globally (top), Atlantic Ocean (middle), Indian and Pacific Oceans (bottom).
to simulate the Deacon Cell also contributes to the warm Southern Ocean temperature bias by limiting the addition of upwelled cold waters.
The simulated AMOC is somewhat weaker in strength than that of the GECCO data. The maximum AMOC strength over the 300-year simulation is 14.5±0.9 Sv, which is lower than the observed 16–18 Sv range. (The models used in the IPCC AR4 generally fall between 12–20 Sv (Meehl et al., 2007b; Schmittner et al., 2005).) The combined In-dian Ocean and Pacific Ocean overturning matches well with observations with the exception that GENMOM simulates deeper-than-observed clockwise overturning in the northern tropics, which may imply the vertical diffusion coefficient is too high.
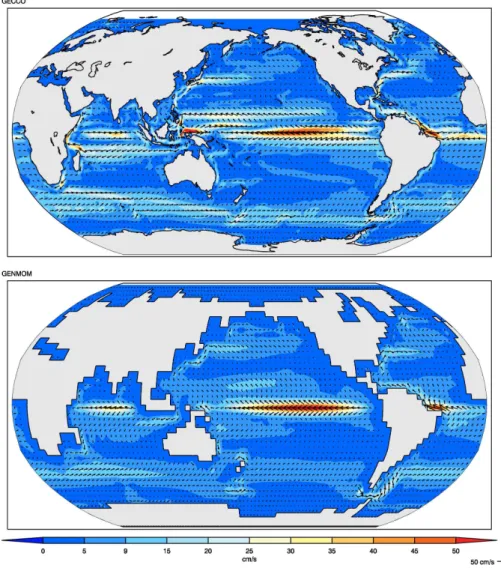
The major Atlantic surface currents are well simulated in GENMOM, with the exception of the Gulf Stream, which is too weak (Fig. 10). The Antarctic Circumpolar Current flow-ing through the Drake Passage is well resolved, as is the
Fig. 10.Annual global surface currents for both observations (GECCO) and GENMOM simulated.
Surface currents in the northern Indian Ocean are modu-lated by the monsoon, where currents flow westward during winter and eastward during summer. The annually averaged surface currents in Fig. 10 show westward flow dominating in GENMOM whereas eastward flow dominates in the observa-tions. The reversal of the surface currents is most noticeable in GENMOM during winter and spring.
GENMOM reproduces the observed NH winter and sum-mer sea-ice extent and concentration (Fig. 11). Sea ice ex-tends too far into the Norwegian Sea during both winter and summer and too far into Hudson Bay during winter. The excessive sea-ice in the Norwegian Sea is likely due to the weakened AMOC, which does not transport enough warm, mid-latitude water northward. Sea ice is deficient around Antarctica during both seasons. The lack of extent and con-centration is a direct result of the persistent warm tempera-ture bias in the Southern Ocean.
4 Discussion
We present the first formal evaluation of the new AOGCM GENMOM, a non-flux corrected model comprised of GEN-ESIS 3 atmospheric model, the MOM2 ocean model and LSX land-surface model. The spectral resolution of T31 for both atmosphere and ocean is used during this evaluation. The simulated global 2 m air temperature is 0.6◦C warmer over oceans and 1.3◦C colder over land. The jet stream structure and major planetary features of sea level pressure are well captured by the model. GENMOM produces a real-istic mean planetary-scale wind structure that is needed to produce the correct position of stormtracks. The 500 hPa ridges and troughs are well simulated, as are the seasonal surface pressure cyclones and anticyclones.
Fig. 11.Fractional sea-ice extent. HadISST v1.1 15% observed contour plotted in red.
well to observations and are on par with the three other AOGCMs. Cold SST anomalies in the Norwegian Sea are explained by excessive sea-ice in both winter and summer, which is in turn caused by weak Atlantic Ocean overturn-ing. A warm bias in the Southern Ocean is attributed to a weak ocean overturning resulting in a poor simulation of the Deacon Cell, which suppresses associated cold water up-welling in the Southern Ocean. GENMOM fails to resolve adequately the South Pacific Gyre, which results in a warm SST bias in the eastern Pacific Ocean and weak anticyclonic atmospheric circulation around the gyre. GENMOM simu-lates a double ITCZ when coupled with the OGCM, which is not present when GENESIS is coupled to a slab ocean.
The global ocean temperature is generally well simulated, with the exception of a warm bias between 200–1000 m in the tropics and mid-latitudes. The warm bias is attributed to weak global overturning and the use of a high value of the vertical diffusion coefficient, which was needed to
main-tain realistic global ocean overturning. Salinity is generally well simulated, but with a fresh bias in the North Atlantic caused by underrepresentation of narrow channels (i.e., the Norwegian Sea) at T31 model resolution and a 1+ PSS salin-ity bias in the northern mid latitudes originating in the Gulf of Mexico. Ocean overturning is simulated with the correct spatial pattern, but is generally weaker-than-observed. We attribute the weak meridional ocean overturning to (1) weak and northwardly displaced westerly winds in the SH due to coarse topography and (2) a narrow and shallow Drake Pas-sage also due to coarse orography.
and SH deficiencies are linked to weak ocean overturning. The use of the Gent-McWilliams mixing scheme should be considered in future GENMOM simulations with the expec-tation that this scheme should cool the Southern Ocean and increase SH sea-ice (Wiebe and Weaver, 1999).
The evaluation performed here demonstrates that the first generation of GENMOM produces a realistic climatology. Deficiencies in the oceanic component of the model dis-cussed here provide guidance for improving GENMOM. The addition of a coupled ocean model allows GENMOM to be used to investigate past climates and to study phenomena such as ENSO that require dynamic ocean-atmosphere in-teraction.
Acknowledgements. We thank the UK Meteorological Office Hadley Centre, US National Weather Service and PCMDI (US Dept. of Energy), and the National Oceanographic Data Center for providing access to datasets. We acknowledge the modeling groups, the Program for Climate Model Diagnosis and Intercom-parison (PCMDI) and the WCRP’s Working Group on Coupled Modelling (WGCM) for their roles in making available the WCRP CMIP3 multi-model dataset. Support of this dataset is provided by the Office of Science, US Department of Energy. We also thank our two anonymous GMD reviewers for their feedback.
Edited by: O. Marti
References
Anthes, R. A.: A cumulus parameterization scheme utilizing a one-dimensional cloud model, Mon. Wea. Rev., 105, 270–286, 1977. Beckmann, B., Floegel, S., Hoffman, P., Schulz, M., and Wag-ner, T.: Orbital forcing of Cretaceous river discharge in tropical Africa and ocean response, Nature, 437, 241–244, 2005. Bice, K. L., Birgel, D., Meyers, P. A., Dahl, K. A.,
Hin-richs, K. U., and Norris, R. D.: A multiple proxy and model study of Cretaceous upper ocean temperatures and atmo-spheric CO2 concentrations, Palaeoceanography, 21, PA2002, doi:10.1029/2005PA001203, 1–17, 2006.
Bryan, F. O., Danabasoglu, G., Nakashiki, N., Yoshida, Y., Kim, D. H., Tsutsui, J., and Doney, S. C.: Response of the North At-lantic thermohaline circulation and ventilation to increasing car-bon dioxide in CCSM3, J. Climate, 19, 2382–2397, 2006. Bryan, K.: A numerical method for the study of the circulation of
the world oceans, J. Comput. Phys., 4, 347–376, 1969.
Clapp, R. B. and Hornberger, G. M.: Empirical equations for some soil hydraulic properties, Water Res. Res., 14, 601–604, 1978. Cogley, J. G.: GGHYDRO–Global hydrological data release 2.0,
Trent Clim. Note, 91–1, 13 pp., Dept. Geogr., Trent Univ., Peter-borough, Ont, 1991.
Collins, W. D., Rasch, P. J., Boville, B. A., McCaa, J. R., Williamson, D. L., Kiehl, J. T., Briegleb, B., Bitz, C., Lin, S.-J., Zhang, M., and Dai, Y.: Description of the NCAR Community Atmosphere Model (CAM3.0), Technical Note TN-464+STR, National Center for Atmospheric Research, Boulder, Colo., 214 pp., 2004.
DeConto, R. M., Pollard, D., and Harwood, D.: Sea ice feedback and Cenozoic evolution of Antarctic climate and ice sheets, Pale-oceanography, 22, PA3214, doi:10.1029/2006PA001350, 2006. DeConto, R. M., Pollard, D., Wilson, P., Palike, H., Lear, C., and
Pagani, M.: Thresholds for Cenozoic bipolar glaciation, Nature, 455, 653–656, 2008.
Dickinson, R. E.: Modeling evapotranspiration for three-dimensional global climate models, in: Climate Processes and Climate Sensitivity, edited by: Hansen, J. E. and Takahashi, T., Geophysical Monograph 29, American Geophysical Union, Washington D.C., 58–72, 1984.
Dorman, J. L. and Sellers, P. J.: A global climatology of albedo, roughness and stomatal resistance for atmospheric general cir-culation models as represented by the Simple Biosphere Model (SB), J. Appl. Meteor., 28, 833–855, 1989.
Flato, G. M. and Hibler, W. D.: Modeling pack ice as a cavitating fluid, J. Phys. Oceanogr., 22, 626–651, 1992.
Gent, P. R. and McWilliams, J.: Isopycnal mixing in ocean circula-tion models, J. Phys. Oceanogr., 20, 150–155, 1990.
GFDL GAMDT (The GFDL Global Atmospheric Model Devel-opment Team): The new GFDL global atmosphere and land model AM2-LM2: Evaluation with prescribed SST simulations, J. Clim., 17, 4641–4673, 2004.
Gnanadesikan, A., Dixon, K. W., Griffies, S. M., Balaji, V., Bar-reiro, M., Beesley, J. A., Cooke, W. F., Delworth, T. L., Gerdes, R., Harrison, M. J., Held, I. M., Hurlin, W. J., Lee, H. C., Liang, Z., Nong, G., Pacanowski, R. C., Rosati, A., Russel, J., Samuels, B. L., Song, Q., Spelman, M. J., Stouffer, R. J., Sweeney, C. O., Vecchi, G., Winton, M. Wittenberg, A. T., Zeng, F., Zhang, R., and Dunne, J. P.: GFDL’s CM2 global coupled climate models – Part 2: The baseline ocean simulation, J. Climate, 19, 675–697, 2004.
Gordon, A. L., Susanto, R. D., and Ffield, A.: Throughflow within Makassar Strait, Geophys. Res. Lett., 26, 3325–3328, 1999. Harvey, L. D. D.: Development of a sea ice model for use in zonally
averaged energy balance climate models, J. Climate, 1, 1221– 1238, 1988.
Held, I. M. and Phillipps, P. J.: Sensitivity of the Eddy Momentum Flux to Meridional Resolution in Atmospheric Gcms, J. Climate, 6, 499–507, 1993.
Horton, D. E., Poulsen, C. J., and Pollard, D.: Orbital and CO2 forcing of late Paleozoic continental ice sheets, Geophys. Res. Lett., 34, L19708, doi:10.1029/2007GL031188, 2007.
Hostetler, S. W., Pisias, N. J., and Mix, A. C.: Sensitivity of Last Glacial Maximum climate to uncertainties in tropical and sub-tropical ocean temperatures, Quat. Sci. Rev., 25, 1168–1185, 2006.
K¨ohl, A. and Stammer, D.: Decadal sea level changes in the 50-year GECCO ocean synthesis, J. Climate, 21, 1876–1890, 2008. Kreitzberg, C. W. and Perkey, D. J.: Release of potential instability:
Part I. A sequential plume model within a hydrostatic primitive equation model, J. Atmos. Sci., 33, 456–475, 1976.
Kump, L. R. and Pollard, D.: Amplification of Cretaceous warmth by biological cloud feedbacks, Science, 320, p. 195, 2008. Lin, J. L.: The double-ITCZ problem in IPCC AR4 coupled GCMs:
Ocean-atmosphere feedback analysis, J. Climate, 20, 4497– 4525, 2007.
Locarnini, R. A., Mishonov, A. V., Antonov, J. I., Boyer, T. P., and Garcia, H. E.: World Ocean Atlas 2005, Volume 1: Tempera-ture. S. Levitus, Ed. NOAA Atlas NESDIS 61, US Government Printing Office, Washington, D.C., 182 pp., 2006.
Lumpkin, R. and Speer, K.: Global ocean meridional overturning, J. Phys., Oceanogr., 37, 2550–2562, 2007.
Marsland, S. J., Haak, H., Jungclaus, J. H., Latif, M., and R¨oske, F.: The Max-Planck-Institute global ocean/sea ice model with orthogonal curvilinear coordinates, Ocean Model., 5, 91–127, 2003.
Meehl, G. A., Covey, C., Delworth, T., Latif, M., McAvaney, B., Mitchell, J. F. B., Stouffer, R. J., and Taylor, K. E.: The WCRP CMIP3 multi-model dataset: A new era in climate change re-search, B. Am. Meteorol. Soc., 88, 1383–1394, 2007a.
Meehl, G. A., Stocker, T. F., Collins, W. D., Friedlingstein, P., Gaye, A. T., Gregory, J. M., Kitoh, A., Knutti, R., Murphy, J. M., Noda, A., Raper, S. C. B., Watterson, I. G., Weaver, A. J., and Zhao, Z.-C.: Global Climate Projections, in: Climate Change 2007: The Physical Science Basis. Contribution of Working Group I to the Fourth Assessment Report of the Intergovernmental Panel on Climate Change, edited by: Solomon, S., Qin, D., Manning, M., Chen, Z., Marquis, M., Averyt, K.B., Tignor, M., and Miller, H. L., Cambridge University Press, Cambridge, United Kingdom and New York, NY, USA, 2007b.
Miller, G., Mangan, J., Pollard, D., Thompson, S., Felzer B., and Magee, J.: Sensitivity of the Australian monsoon to insolation and vegetation: implications for human impact on continental moisture balance, Geology, 33, 1, 65–68, 2005.
Pacanowski, R. C.: MOM 2 Version 2.0 (Beta) Documentation: User’s Guide and Reference Manual, NOAA GFDL Ocean Tech-nical Report 3.2, 329 pp., 1996.
Peltier, W. R.: Global glacial isostatic adjustment: palaeogeodetic and space-geodetic tests of the ICE-4G (VM2) model, J. Quater-nary Sci., 17, 491–510, ISSN 0267-8179, 2002.
Pinot, S., Ramstein, G., Harrison, S. P., Prentice, I. C., Guiot, J., Stute, M., and Joussaume, S.: Tropical paleoclimates at the Last Glacial Maximum: Comparison of Paleoclimate Modeling
In-Pollard, D., Bergengren, J. C., Stillwell-Soller, L. M., Felzer, B., and Thompson, S. L.: Climate simulations for 10 000 and 6000 years BP using the GENESIS global climate model, Paleocli-mates – Data and Modelling, 2, 183–218, 1998.
Poulsen, C. J., Pollard, D., and White, T. S.: General Circulation Model simulation of the d18O content of continental precipita-tion in the middle Cretaceous: A model-proxy comparison, Ge-ology, 35, 199–202, 2006.
Poulsen, C. J., Pollard, D., Montanez I. P., and Rowley, D.: Late Pa-leozoic tropical climate response to Gondwanan glaciation, Ge-ology, 35, 771–774, 2007.
Randall, D. A., Wood, R. A., Bony, S., Colman, R., Fichefet, T., Fyfe, J., Kattsov, V., Pitman, A., Shukla, J., Srinivasan, J., Stouf-fer, R. J., Sumi, A., and Taylor, K. E.: Climate Models and Their Evaluation, in: Climate Change 2007: The Physical Science Basis. Contribution of Working Group I to the Fourth Assess-ment Report of the IntergovernAssess-mental Panel on Climate Change, edited by: Solomon, S., Qin, D., Manning, M., Chen, Z., Mar-quis, M., Averyt, K. B., Tignor, M., and Miller, H. L., Cambridge University Press, Cambridge, United Kingdom and New York, NY, USA, 2007.
Reynolds, R. W., Rayner, N. A., Smith, T. M., Stokes, D. C., and Wang, W.: An Improved In Situ and Satellite SST Analysis for Climate, J. Climate, 15, 1609–1625, 2002.
Roeckner, E., B¨auml, G., Bonaventura, L., Brokopf, R.,, Esch, M., Giorgetta, M., Hagemann, S., Kirchner, I., Kornblueh, L., Manzini, E., Rhodin, A., Schlese, U., Schulzweida, U., and Tompkins, A.: The Atmospheric General Circulation Model ECHAM5. Part I: Model Description, MPI Report 349, Max Planck Institute for Meteorology, Hamburg, Germany, 127 pp., 2003.
Ruddiman, W. F., Vavrus, S. J., and Kutzbach, J. E.: A test of the overdue-glaciation hypothesis, Quat. Sci. Rev., 24, 1–10, 2005. Schmittner, A., Latif, M., and Schneider, B.: Model projections
of the North Atlantic thermohaline circulation for the 21st cen-tury assessed by observations, Geophys. Res. Lett., 32, L23710, doi:10.1029/2005GL024368, 2005.
Schmittner, A., Silva, T. A. M., Fraedrich, K., Kirk, E., and Lunkeit, F.: Effects of Mountains on Global Ocean Circulation, J. Cli-mate, doi:10.1175/2010JCLI3982.1., in press, 2011.
Semtner, A. J.: A model for the thermodynamic growth of sea ice in numerical investigations of climate, J. Phys. Oceanogr., 6, 379– 389, 1976.
Clim., 22, 1277–1286, 2009.
Smith, R. N. B.: A scheme for predicting layer clouds and their water content in a general circulation model, Q. J. Roy. Meteorol. Soc., 116, 435–460, 1990.
Smith, R. D., and Gent, P. R.: Reference Manual for the Paral-lel Ocean Program (POP), Ocean Component of the Community Climate System Model (CCSM2.0 and 3.0), Technical Report LA-UR-02-2484, Los Alamos National Laboratory, Los Alamos, NM, http://www.ccsm.ucar.edu/models/ccsm3.0/pop/, 2002. Thompson, S. L. and Pollard, D.: A global climate model
(GENE-SIS) with a land-surface-transfer scheme (LSX), Part 1: Present-day climate, J. Climate, 8, 732–761, 1995.
Thompson, S. L. and Pollard, D.: Greenland and Antarctic mass balances for present and doubled CO2 from the GENESIS ver-sion 2 global climate model, J. Climate, 10, 871–900, 1997. Tibaldi, S., Palmer, T. N. Brankovic, C., and Cubasch, U.:
Extended-Range Predictions with ECMWF Models: Influence of Horizontal Resolution on Systematic-Error and Forecast Skill, Q. J. Roy. Meteor. Soc., 116, 835–866, 1990.
Toggweiler, J. R. and Samuels, B.: Effect of Drake Passage on the Global Thermohaline Circulation, Deep Sea Res. I, 42, 477–500, 1995.
UK Meteorological Office, Hadley Centre: HadISST 1.1 – Global sea-Ice coverage and SST (1870–Present) [Internet], British At-mospheric Data Centre, Downloaded 2/8/2010, available at: http: //badc.nerc.ac.uk/data/hadisst/, 2006.
Webb, R. S., Rosenzweig, C. E., and Levine, E. R.: Specifying land surface characteristics in general circulation models: Soil pro-file data set and derived water-holding capacities, Global Bio-geochem. Cycles, 7, 97–108, 1993.
Wiebe, E. C. and Weaver, A. J.: On the sensitivity of global warm-ing experiments to the parameterization of sub-grid scale ocean mixing, Climate Dyn., 15, 875–893, 1999.
Williamson, D. L. and Rasch, P. J.: Two-dimensional semi-Lagrangian transport with shape-preserving interpolation, Mon. Wea. Rev., 117, 102–129, 1989.
Williamson, D. L., Kiehl, J. T., Ramanathan, V., Dickinson, R. E., and Hack, J. J.: Description of NCAR Community Climate Model (CCM1), NCAR Technical Note NCAR/TN-285+STR, Boulder, Colorado, 112 pp., 1987.