Universidade Federal de Minas Gerais
Engineering School
Department of Sanitary and Environmental Engineering
Postgraduate Program in Sanitation, Environment and Water Resources.
Membrane Bioreactor for treating petroleum
refinery effluent: treatment performance,
membrane fouling mechanism and fouling control
Aline Ribeiro Alkmim
Aline Ribeiro Alkmim
Membrane Bioreactor for treating petroleum
refinery effluent: treatment performance,
membrane fouling mechanism and fouling control
Dissertation presented to the Postgraduate Program in Sanitation, Environment and Water Resources of Federal University of Minas Gerais as a partial requirement to obtain the title of Master in Sanitation, Environment and Water Resources.
Concentration area: Environmental Studies
Research Line: Characterization, prevention and control of pollution
Supervisor: D. Sc. Míriam Cristina Santos Amaral Moravia
Aline Ribeiro Alkmim
Biorreator com membrana tratando efluente de
refinaria de petróleo: performance do tratamento,
mecanismos de incrustação da membrana e controle
de incrustação
Dissertação apresentada ao Programa de Pós-graduação em Saneamento, Meio Ambiente e Recursos Hídricos da Universidade Federal de Minas Gerais, como requisito parcial à obtenção do título de Mestre em Saneamento, Meio Ambiente e Recursos Hídricos.
Área de Concentração: Meio Ambiente
Linha de Pesquisa: Caracterização, prevenção e controle da poluição
Orientador(a): Profa. Dra. Míriam Cristina Santos Amaral Moravia
______________________________________________________________________ Programa de Pós-graduação em Saneamento, Meio Ambiente e Recursos Hídricos i
ACKNOWLEDGEMENTS
First of all, I would like express my gratitude to God, the one who gives us the gift of life and empowers us in all work. For the privilege of being a steward of creation, work of His hands, and for His faithfulness to me all the days of my life.
Over the past two years I have received support and encouragement from a great number of individuals. I thank my husband, Davi, who has always been at my side, with wise and comforting words, for his patience, support, encouragement and care.
I would like to thank my parents, Jair and Elivani, and my brother, Pedro, for their constant support, for believing in me and encouraging me to follow my dreams, filled with love and strong dedication.
I would like express my gratitude to Miriam, my supervisor, for her dedication, availability and trust. For opening many opportunities; and for frequently encouraging me in such a way that I could continue believing in my potential.
I would like to thank Luzia, who made herself present with essential contributions to this work and also for her dedicated supervision.
For their collaboration, support and encouragement, I would like to thank DESA professors, especially Sílvia, Lisete, Camila e Mônica.
I would like to thank my coworkers from Petrobrás project at UFMG, who have contributed greatly to this work: Paula, Renata, Lucas, Tatiane, Rosimeire, Gabriel, Dhayannie e Isabella. Thank you very much!
I thank our REGAP coworkers at the pilot plant, who were always available to help and have done that with joy, goodwill and commitment, always interested in this project´s development. I thank Priscila, Cíntia, Marcelo, Felipe, Luciana, Mayrink, Luciano. It was great to work with you all!
______________________________________________________________________ Programa de Pós-graduação em Saneamento, Meio Ambiente e Recursos Hídricos ii I thank my friend Bárbara for helping me countless times, for our study time, papers, tests and scientific articles, for having solutions to the problems and questions and for sharing both the joyful and the difficult moments.
I thank Beatriz who promptly accepted to help me about toxicity tests.
I thank Lucilaine who has always been available to help me, sharing her knowledge and support.
I thank Cassiano, Aline, Mirna and Thais, who were dedicated and reliable to this project. Thanks for the tests, help and companionship.
I thank my postgraduate classmates and GEAPS coworkers, who have always been at my side.
______________________________________________________________________ Programa de Pós-graduação em Saneamento, Meio Ambiente e Recursos Hídricos iii
ABSTRACT
______________________________________________________________________ Programa de Pós-graduação em Saneamento, Meio Ambiente e Recursos Hídricos iv
RESUMO
______________________________________________________________________
Programa de Pós-graduação em Saneamento, Meio Ambiente e Recursos Hídricos v
SUMMARY
1. INTRODUCTION ... 11.1 Contextualization and problem ... 1
1.2 Objectives ... 4
1.2.1 General Objective ... 4
1.2.2 Especific Objectives ... 4
1.3 Structural form ... 4
1.4 References ... 5
2. POTENTIAL USE OF SUBMERGED MEMBRANE BIOREACTOR TO TREAT REFINERY EFFLUENT: COMPREHENSION OF MBR DYNAMIC TO REMOVE ORGANIC MATTER AND FOULING CHARACTERISTICS ... 8
2.1 Introduction ... 8
2.2 Materials and methods ... 11
2.2.1 Petroleum refinery effluent ... 11
2.2.2 Experimental Apparatus and Operational Conditions ... 12
2.2.3 Effluent characterization and pollutant removal evaluation ... 12
2.2.4 Investigation into the mechanisms of removal and retention of organic substances by FTIR (Fourier transform infrared spectroscopy) ... 13
2.2.5 Fouling formation evaluation ... 13
2.2.6 Statistic Evaluation ... 15
2.3 Results and discussion ... 15
2.3.1 MBR pollutant removal efficiency ... 15
2.3.2 Mechanism of pollutant removal and retention ... 19
2.3.3 Membrane performance ... 24
2.3.4 Fouling characteristics ... 28
2.4 Conclusions ... 29
2.5 References ... 30
3. THE APPLICATION OF FILTERABILITY AS A PARAMETER TO EVALUATE THE BIOLOGICAL SLUDGE QUALITY IN A MBR TREATING REFINERY EFFLUENT 37 3.1 Introduction ... 37
3.2 Methodology ... 39
3.2.1 Selection of Filterability methods ... 39
3.2.2 The influence of the sludge filterability on membrane fouling process ... 42
______________________________________________________________________
Programa de Pós-graduação em Saneamento, Meio Ambiente e Recursos Hídricos vi
3.3 Results and Discussion ... 43
3.3.1 Selection of Filterability methods ... 43
3.3.2 Filterability as a parameter to evaluate the sludge fouling potential in a MBR . 45 3.3.3 Influence of sludge characteristics in sludge filterability ... 46
3.3.4 Filterability test towards sustainability in MBR operation ... 50
3.4 Conclusions ... 50
3.5 References ... 51
4. LONG TERM EVALUATION OF DIFFERENT STRATEGIES OF CATIONIC POLYELECTROLYTE DOSAGE TO CONTROL FOULING IN MEMBRANE BIOREACTOR TREATING REFINERY EFFLUENT ... 55
4.1 Introduction ... 55
4.2 Materials and methods ... 58
4.2.1 Effluent sampling and characterization ... 58
4.2.2 Batch treatment test ... 59
4.2.3 Effects of different cationic polyelectrolyte dosing strategies ... 60
4.2.4 The effect MPE 50 use on MBR pollutant removal performance ... 61
4.3 Results and discussion ... 62
4.3.1 Batch treatment test ... 62
4.3.2 Effect of different strategies of MPE 50 use on fouling control ... 63
4.3.3 MPE 50 addition influence on MBR pollutant removal performance... 71
4.4 Conclusions ... 72
4.5 References ... 72
5. FINAL CONSIDERATIONS ... 76
______________________________________________________________________ Programa de Pós-graduação em Saneamento, Meio Ambiente e Recursos Hídricos vii
LIST OF PUBLICATIONS
CONGRESS PUBLICATIONS:
ALKMIM, A. R., DA COSTA, P. R.; FRANÇA NETA, L. S.; CERQUEIRA, A. C.; SANTIAGO V. M. J.; AMARAL, M. C. S. Study of Filterability Methods for Quality Evaluation in Biological Sludge from BRM. II Simpósio de processos de separação com membranas - 29 de julho a 02 de agosto de 2013, Rio de Janeiro.
ALKMIM, A. R., DA COSTA, P. R.; FRANÇA NETA, L. S.; CERQUEIRA, A. C.; SANTIAGO V. M. J.; AMARAL, M. C. S. The application of filterability as a parameter to evaluate the biological sludge quality in a MBR used for treating refinery effluent. - EWM 2013 – Engineering with membranes towards a sustainable future. 3-7 setembro de 2013, Sain-Pierre dOleron (France).
ALKMIM, A. R., DA COSTA, P. R.; FRANÇA NETA, L. S.; CERQUEIRA, A. C.; SANTIAGO V. M. J.; AMARAL, M. C. S. Estudo do teste filtrabilidade como ferramenta para monitoramento e controle de incrustação em BRM. - 27° Congresso Brasileiro de Engenharia Sanitária e Ambiental. 15 – 19 de setembro de 2013, Goiânia.
ALKMIM, A. R., DA COSTA, P. R.; FRANÇA NETA, L. S.; CERQUEIRA, A. C.; SANTIAGO V. M. J.; AMARAL, M. C. S. Comparison of different filterability methods for fouling potential evaluation of MBR sludge. - The 7th IWA Specialised Membrane Technology Conference and Exhibition for Water and Wastewater Treatment and Reuse. August 25 - 29, 2013, Toronto, Canadá.
ALKMIM, A. R., DA COSTA, P. R.; MOSER, P. B.; FRANÇA NETA, L. S.; CERQUEIRA, A. C.; SANTIAGO V. M. J.; AMARAL, M. C. S. Improvement of sludge quality to control fouling in MBR. - CITEM 2014 - IX Ibero-american congress on membrane science and technology. May 25 to May 28, 2014. Santander, Spain.
ACADEMIC JOURNAL PUBLICATION:
______________________________________________________________________ Programa de Pós-graduação em Saneamento, Meio Ambiente e Recursos Hídricos viii filterability as a parameter to evaluate the biological sludge quality in an MBR treating refinery effluent. Desalination and Water Treatment, n. ahead-of-print, p. 1-10, 2014.
SUBMITTED ARTICLE:
ALKMIM, A. R., DA COSTA, P. R.; MOSER, P. B.; FRANÇA NETA, L. S.; CERQUEIRA, A. C.; SANTIAGO V. M. J.; AMARAL, M. C. S. Long term evaluation of different strategies of cationic polyelectrolyte dosage to control fouling in membrane bioreactor treating refinery effluent.
ARTICLE TO BE SUBMITTED:
______________________________________________________________________
Programa de Pós-graduação em Saneamento, Meio Ambiente e Recursos Hídricos ix
LIST OF FIGURES
Figura 1 -Schematic diagram of generic sequence for treating petroleum refinery effluent. .... 2Figure 2 – MBR schematic drawing ... 12
Figure 3 -Performance of the MBR for (a) COD removal and (b) NH3-N removal. ... 16
Figure 4 - FTIR spectrum of refinery effluent, mixed liquor, supernatant of mixed liquor and permeate... 20
Figure 5 – Behavior of TMP, Colloidal TOC and Filterability over the monitoring time. ... 25
Figure 6 – Behavior of SMP and EPS over the monitoring time period ... 27
Figure 7 – Assemblies used for sludge filterability tests. ... 41
Figure 8 – Temporal comparison among the three filterability methods being analyzed. The highlighted values stand for the outliers. ... 43
Figure 9 - Box-plot Chart showing the range of variation coefficients of different filterability methods. ... 45
Figure 10 – Permeability and filterability profile by operation monitoring time. ... 46
Figure 11 - Graphic of possible correlation between the parameters analyzed and sludge filterability found by TTF Test. ... 47
Figure 12 - Effects of different corrective and preventive MPE usage strategies on MBR sludge filtration rates (filterability)... 66
______________________________________________________________________ Programa de Pós-graduação em Saneamento, Meio Ambiente e Recursos Hídricos x
LIST OF TABLES
Table 1 – Physicochemical and toxicological characterization of the MBR feeding and permeate... 18
Table 2 – Main peak wave value in the FTIR spectrum, relevant groups and their corresponding wave peak values ... 21
Table 3 – Load variations occurred over the monitoring time period and their influence on MBR parameters ... 26
Table 4- Fouling characteristics related to sludge ... 28 Table 5 - Kruskal-Wallis statistic tests that showed significant differences among groups at a
significance level of 5%. ... 44
Table 6 - Spearman correlation coefficient (R) values and correlation significance analysis 48 Table 7 - Refinery effluent physicochemical characterization ... al107059 Table 8 - Results of optimal MPE 50 dosage addition tests ... 62 Table 9 - Effects of fouling resistance, colloidal TOC, SMP and EPS, floc size and TTF ... 64 Table 10 - Results of correlation tests of characterization parameters regarding sludge and
filterability ... 67
______________________________________________________________________ Programa de Pós-graduação em Saneamento, Meio Ambiente e Recursos Hídricos xi
LIST OF SYMBOLS AND ABREVIATIONS
µ Dynamic viscosity
BP By products
BR Biological removal
BS Biological Sludge
COD Chemical Oxygen Demand
CST Capilarity Suction Time
DFCm Delft Filtration Characterization Method EC50 Median Effective Concentration
EC50 30 min Median Effective Concentration in 30 minutes EPS Extracellular Polymeric Substances
EPSc EPS concentration in terms of polysaccharide EPSp EPS concentration in terms of protein
FT Filter test
FTIR Fourier transform infrared spetroscopy
HTR Hidraulic Retention Time
MBR Membrane Bioreactor
MCE Mixed cellulose ester
MFI Modified Fouling Index
ML Mixed Liquor
MLSS Mixed Liquor Suspended Solids
MLSSV Mixed liquor volatile suspended solids
MPE Membrane performance enhancer
MR Membrane retention
NH3–N Ammoniacal nitrogen
NR Not removed
NTU Nephelometric turbidity units O&G Oil and Greases
P Permeate
PVDF Polyvinylidene Difluoride
R Spearman correlation coefficient
______________________________________________________________________ Programa de Pós-graduação em Saneamento, Meio Ambiente e Recursos Hídricos xii
REGAP Refinery Gabriel Passos
S supernatant of mixed liquor
s Standard Deviation
SA Sludge adsorption
SFI Sludge Filtration Index SMP Soluble Microbial Products
SMPc SMP concentration in terms of polysaccharide SMPp SMP concentration in terms of protein
SS Suspended Solids
t Filtration Time
TDS Total Dissolved Solids
TMP Transmembrane Pressure
TOC Total Organic Carbon
TTF Time to Filter
UF Ultrafiltration
V Permeate Volume
VC variation coefficient
Median Value
α specific resistance
______________________________________________________________________ Programa de Pós-graduação em Saneamento, Meio Ambiente e Recursos Hídricos 1
1. INTRODUCTION
1.1 Contextualization and problem
The petroleum refining industry transforms crude oil in more than 2500 products, including liquefied gas, gasoline, kerosene, jet fuel, diesel fuel, lubricants, amongst others. A great demand for water is required in the processes, especially for distillation, desalination and cooling systems (YAVUZ et al., 2010).
The estimated water consumption per barrel of oil to be processed is 246-341 L, which generates an effluent of approximately 0.4-1.6 times this value (ALVA-ARGAEZ et al., 2007). The amount of liquid effluent generated by this industrial typology and its features depends on the settings of each process. In general, the refinery wastewater contains COD levels of about 300-600 mg / L, phenol grade from 20-200 mg / L, benzene levels from 1-100 mg / L, besides of heavy metal levels like chromium, from 0.1 to 100 mg / L, lead from 0.2-10 mg / L, and other pollutants such as oils, greases and ammonia at high concentration (WBG, 1999). Due to these pollutants, the effluent is considered a major source of contamination of the aquatic environment (WAKE, 2005).
______________________________________________________________________ Programa de Pós-graduação em Saneamento, Meio Ambiente e Recursos Hídricos 2
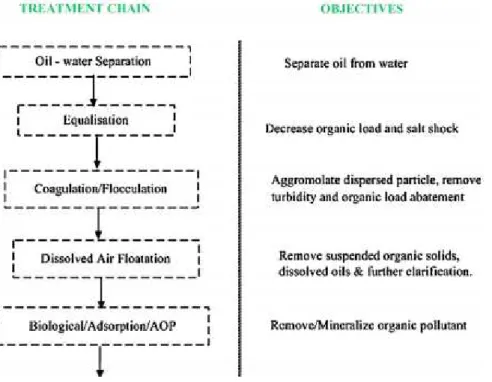
Figure 1 -Schematic diagram of generic sequence for treating petroleum refinery effluent. (Source: Diya’uddeen et al., 2011)
However, the increased cost in water collection and treatment, the effluent discharge and, in some cases, the low availability of water, combined with the imposition of environmental laws increasingly restrictive as well as the industry pressure for sustainable development, have driven oil refineries to deploy wastewater reuse systems.
Several solutions have been suggested to optimize the effluent treatment process. Some studies presents methods that include chemical precipitation (HOSSEINI et al., 2003; ALTAŞ and BÜYÜKGÜNGÖR, 2009), eleltrocoagulation (YAVUZ et al., 2010, YAN et al., 2011), fenton oxidation (HASSAN et al., 2012), photocatalytic oxidation (KHAN et al., 2014, SHAHREZAEI et al., 2012), adsorption (EL-NAAS et al., 2010), membranes (TAKHT RAVANCHI et al., 2009; MADAENI e ESLAMIFARD, 2010; SALEHI et al., 2014; WANG et al., 2014), membrane bioreactor (BAYAT et al., 2014; VIERO et al., 2008; QIN et al.,
2007; RAHMAN and AL-MALACK, 2006) amongst others.
______________________________________________________________________ Programa de Pós-graduação em Saneamento, Meio Ambiente e Recursos Hídricos 3
wastewater for removal of organic matter and nutrients due to their increased pollutant removal efficiency compared to conventional processes. High mixed liquor suspended solids (MLSS) concentration in this technology has made it a suitable choice for the treatment of highly toxic wastewater such as petrochemical wastewater (BAYAT et al., 2014).
Some advantages of MBR are: high efficiency removal of micro-pollutants and persistent organic pollutants, low sensitivity to load variation, low sludge production, high sludge age, total removal of suspended solids, among others (JUDD, 2006). However, the possibility of fouling that reduces flow through the membrane has been limiting the use of this process, especially when treating industrial effluents, which, due to the high load variations tends to amplify this problem.
The membrane fouling is caused by the adsorption of solute molecules on the membrane surface, pore clogging obstruction by suspended particulate material and the deposit of suspended material on the surface of the membrane forming a cake (JUDD, 2006). This process is influenced by a number of factors related to feeding, membrane operating conditions, and is determined by the membrane tendency in being encrusted by components of the liquid accumulated in the external and internal membrane structures (LE-CLECH et al., 2006). The membranes fouling affects directly the permeate flow and the pressure differential in the system resulting in greater energy requirements, higher frequency of the membrane cleaning, shorter life of the membrane and, consequently, greater operating costs. Therefore, monitoring and fouling control are essential for the technical and economic use of MBR in treating effluents.
______________________________________________________________________ Programa de Pós-graduação em Saneamento, Meio Ambiente e Recursos Hídricos 4 1.2 Objectives
1.2.1 General Objective
The general objective of this study was to evaluate the MBR performance in terms of pollutants removal, fouling investigation and control in the petroleum refinery effluent.
1.2.2 Especific Objectives
Evaluate MBR performance at long term monitoring in terms of nutrients and organic matter removal treating petroleum refinery effluent.
Investigate pollutants removal/retention mechanisms in MBR;
Investigate membrane fouling mechanisms;
Evaluate the sludge filterability test as a parameter to monitoring membrane fouling;
Select the filterability method with higher reproducibility for MBR treating Petroleum refinery effluent;
Investigate the influence of sludge quality in MBR sludge filterability;
Evaluate the use of a permeability improving agent as a tool fouling control;
Evaluate the effect of permeability enhancer dosage in the MBR performance in the removal of organic matter and nutrients;
The first three specific objectives are related to the dissertation´s second chapter. The following three are linked to the third chapter. The two last objectives are mainly associated to the fourth chapter.
1.3 Structural form
Besides this introduction (Chapter 1), the final considerations (Chapter 5) and recommendations (Chapter 6), this dissertation is structured in three chapters in an article format. The choice of an article format indicates that the chapters are interdependent but can also be read separately.
______________________________________________________________________ Programa de Pós-graduação em Saneamento, Meio Ambiente e Recursos Hídricos 5
load. To get a better insight into the mechanism of pollutants removal and the causes of membrane fouling in the MBR, detailed physicochemical characteristics of effluent, mixed liquor and permeate and morphological and filtration characteristics of mixed liquor were also studied.
Chapter 3 discusses the filterability parameter of biological sludge in MBR, showing that the measurement of this parameter is an important tool for assessing the quality of biological sludge and the potential of fouling formation in MBR. It is also discussed the lack of standardization of its determination method making it difficult to understand its interference with the MBR performance and also the comparison of results. Thus, this first article aims to compare three filtration methods measurement reported in the literature (Time to Filter, Filter Test e Sludge Filtration Index) in terms of detection capability of the sludge quality variations
and its reproducibility, evaluating the implementation of this parameter as a tool for monitoring and controlling the fouling in the MBR treating oil refinery effluent and investigating the influence of sludge quality in the filterability of the same for MBR.
In Chapter 4 is discussed the long-term use of cationic polyelectrolyte to improve the sludge filterability, and as well to control membrane fouling in membrane bioreactor while treating refinery effluents. Different dosages of strategic were also evaluated concern- the MBR without cationic polyelectrolyte addition performance in terms of sludge quality and performance in the removal of organic matter and nutrients.
1.4 References
ALTAŞ, L.; BÜYÜKGÜNGÖR, H. Sulfide removal in petroleum refinery wastewater by chemical precipitation. Journal of hazardous materials, v. 153, n. 1, p. 462-469, 2008.
ALVA-ARGÁEZ, A.; KOKOSSIS, A.C.; SMITH, R. The design of water using systems in petroleum refining using a water-pinch decomposition. Chemical Engineering Journal, 128, 33-46, 2007.
______________________________________________________________________ Programa de Pós-graduação em Saneamento, Meio Ambiente e Recursos Hídricos 6
oxide/ethylene glycol and olefin units. Journal of Industrial and Engineering Chemistry, in press, 2014.
DIYA’UDDEEN, B. H.; DAUD, W. M. A. W.; ABDUL AZIZ, A. R. Treatment technologies
for petroleum refinery effluents: a review. Process Safety and Environmental Protection, v. 89, n. 2, p. 95-105, 2011.
EL-NAAS, M. H.; AL-ZUHAIR, S.; ALHAIJA, M. A. Reduction of COD in refinery wastewater through adsorption on date-pit activated carbon. Journal of hazardous materials, v. 173, n. 1, p. 750-757, 2010.
HASAN, D. B.; ABDUL AZIZ, A. R.; DAUD, W. M. A. W. Oxidative mineralisation of petroleum refinery effluent using Fenton-like process. Chemical Engineering Research and Design, v. 90, n. 2, p. 298-307, 2012.
HOSSEINI, S. N.; MIRBAGHERI, S. A. Pilot plant investigation on petrochemical wastewater treatment for the removal of copper and chromium with the objective of reuse. Int. J. Environ. A, v. 28, p. 369-374, 2003.
KHAN, W. Z.; NAJEEB, I.; TUIYEBAYEVA, M.; MAKHTAYEVA, Z. Refinery wastewater degradation with titanium dioxide, zinc oxide, and hydrogen peroxide in a photocatalytic reactor. Process Safety and Environmental Protection, In press, 2014.
JUDD, S. 2006. The MBR Book: Principles and Applications of Membrane Bioreactors in Water and Wastewater Treatment. 1 ed. Oxford: Elsevier Ltd., 342 p.
LE-CLECH, P.; CHEN, V.; FANE T.A.G. Fouling in membrane bioreactors used in
wastewater treatment, Journal of Membrane Science, Volume 284, Pages 17-53, 2006.
MADAENI, S. S.; ESLAMIFARD, M. R. Recycle unit wastewater treatment in petrochemical complex using reverse osmosis process. Journal of hazardous materials, v. 174, n. 1, p. 404-409, 2010.
QIN, J. J.; OO, M. H.; TAO, G.; KEKRE, K. A. Feasibility study on petrochemical wastewater treatment and reuse using submerged MBR. Journal of Membrane Science, 293(1), 161-166, 2007.
______________________________________________________________________ Programa de Pós-graduação em Saneamento, Meio Ambiente e Recursos Hídricos 7
SALEHI, E.; MADAENI, S. S.; SHAMSABADI, A. A.; LAKI, S. Applicability of ceramic membrane filters in pretreatment of coke-contaminated petrochemical wastewater: Economic feasibility study. Ceramics International, 40(3), 4805-4810, 2014.
SHAHREZAEI, F.; MANSOURI, Y.; ZINATIZADEH, A. A. L.; AKHBARI, A. Process modeling and kinetic evaluation of petroleum refinery wastewater treatment in a photocatalytic reactor using TiO2 nanoparticles. Powder technology, 221, 203-212, 2012.
TAKHT RAVANCHI, M.; KAGHAZCHI, T.; KARGARI, A. Application of membrane separation processes in petrochemical industry: a review. Desalination, v. 235, n. 1, p. 199-244, 2009.
VIERO, A. F., DE MELO, T. M., TORRES, A. P. R., FERREIRA, N. R. The effects of long-term feeding of high organic loading in a submerged membrane bioreactor treating oil refinery wastewater. Journal of Membrane Science,319(1), 223-230, 2008.
YAN, L., MA, H., WANG, B., WANG, Y., CHEN, Y.. Electrochemical treatment of
petroleum refinery wastewater with three-dimensional multi-phase
electrode. Desalination, 276(1), 397-402, 2011.
YAVUZ, Y.; KOPARAL, A. S.; ÖĞÜTVEREN, Ü. B. Treatment of petroleum refinery wastewater by electrochemical methods. Desalination, v. 258, n. 1, p. 201-205, 2010.
WAKE, H. Oil refineries: a review of their ecological impacts on the aquatic environment. Estuarine, Coastal and Shelf Science, v. 62, n. 1, p. 131-140, 2005.
WANG, F. H.; HAO, H. T.; SUN, R. F.; LI, S. Y.; HAN, R. M.; PAPELIS, C.; ZHANG, Y. Bench-scale and pilot-scale evaluation of coagulation pre-treatment for wastewater reused by reverse osmosis in a petrochemical circulating cooling water system. Desalination, 335(1), 64-69, 2014.
______________________________________________________________________ Programa de Pós-graduação em Saneamento, Meio Ambiente e Recursos Hídricos 8
2. POTENTIAL
USE
OF
SUBMERGED
MEMBRANE
BIOREACTOR
TO
TREAT
REFINERY
EFFLUENT:
COMPREHENSION
OF
MBR
DYNAMIC
TO
REMOVE
ORGANIC MATTER AND FOULING CHARACTERISTICS
2.1 Introduction
Petroleum refinery effluent combine effluents from different typical refinery plants such as cracking, reforming, topping and lube manufacturing processes. Such processes require high water volumes, and therefore they account for high effluent outflow. Usually, 246 to 340 liters of water are required to process a crude oil barrel, which corresponds to a production of average effluent volume ranging from 0.4 to 1.6 times the amount of the oil processed (Alva-Argáez et al., 2007). Additionally, such effluents contain a great variety of organic and inorganic pollutants, including sulfides, ammonia, cyanides, aliphatic hydrocarbons (up to C12), and polyaromatic hydrocarbons such as
ethylbenzene, toluene, benzene and 1-methylethyl benzene and phenolic compounds that, when released into the environment can result in serious environmental consequences (Wake, 2005).
A typical refinery effluent treatment plant comprises a primary treatment by which a combination between physical and physicochemical processes are performed to remove free oil (floating oil), suspended solids and colloidal substances, followed by a secondary treatment to remove effluent contaminants and to acceptable levels for its discharge into water streams (Diya’uddeen et al., 2011).
______________________________________________________________________ Programa de Pós-graduação em Saneamento, Meio Ambiente e Recursos Hídricos 9 In such background, the membrane bioreactors (MBR) technology that consists in combining biologic processes with membrane separation processes has arisen as a good alternative to petroleum refinery effluent treatment for being capable to produce high quality effluent that suited to be reused in refining processes (Fallah et al., 2010).
Rahman and Al-Malack (2006) studied the use of crossflow membrane bioreactor to treat petroleum refinery effluent. In their study, the authors assessed the performance of the technology using two different concentrations of MLSS (Mixed Liquor Suspended Solids), that is, 5000 and 3000 mg/L. The results showed that, independently on MLSS concentrations, the effectiveness of COD removal was over 93%.
Qin et al. (2007) investigated the feasibility of using submerged membrane bioreactors by evaluating refinery effluent treatment performance, and as well the possibility of reusing the water produced during the process. COD concentration dropped down from 700-1200 mg/L at feeding to 50 mg/L in the product, while the ammonia concentration dropped down from 56-132 mg/L to 0.10-0.95 mg/L, and from 14-20 mg/L to a 1 – 4 mg/L of oil and grease content in the product. To discharge the treated product, all parameters were within specified standard ranges. About reusing the water in the process, specifically in the cooling towers, all requirements have been met, except the total dissolved solid contents that, due to the high sodium and sulfate concentrations, have not met the requirements of such application, and then it was required to segregate streams containing high TDS concentrations.
Viero et al. (2008) also analyzed the use of submerged membrane bioreactors to treat petroleum refinery effluents, specifically in oily streams containing high phenol concentrations. Compared to a conventional biological system, the use of a MBR improved the COD and TOC removing efficiency by 17% and 20%, respectively. Besides it, and in spite of the biodegradation difficulties placed by the high oil and grease and phenol concentrations, the treatment by MBR has proved to be highly efficient to remove phenol and organic contents.
______________________________________________________________________ Programa de Pós-graduação em Saneamento, Meio Ambiente e Recursos Hídricos 10 operational cost (Lin et al., 2013), has been restraining the use of this process, specially to treat refinery effluents that, due to their high load variations, are prone to aggravate this inconvenience.
Fouling formation on the membranes is caused by the adsorption of solute molecules over their surfaces, obstruction of pores by suspended particles and deposition of suspended substances over membrane surface that forms a sludge cake (Judd, 2006). This process is influenced by many factors related to feeding, the membrane and
operational conditions, and it’s determined by the membrane tendency to be fouled by
the contents of the liquid that accumulates on the inner and outer membrane structures (Le-Clech et al., 2006).
Many studies have striven to correlate permeability declination caused by fouling formation to sludge properties. Chang et al. (2002), Judd (2006) and Drews (2010), for example, presented a review of the parameters associated with the sludge properties,
that’s to say, floc size, volatile suspended solid concentration, EPS (Extracellular Polymeric Substances), SMP (Soluble Microbial Products), among others – and showed how they are related to MBR fouling formation likeliness. As discussed in these works, due to the biologic system complexity, the conclusions have been often controversial, so they can not be directly transferred to other systems.
Fouling process characterization may be accomplished by some essays such as, for example, characterization essays and quantification of the resistance to transport due to
different fouling process types. The total resistance to filtration defined by Darcy’s law,
has usually been analyzed by using the resistance in-series model to describe the role of each fouling mechanism such as cake deposition, gel layer formation, pore blocking, free or bound EPS, adsorption or formation of condensation polarization layers (Diez et al., 2014).
______________________________________________________________________ Programa de Pós-graduação em Saneamento, Meio Ambiente e Recursos Hídricos 11 Additionally, to monitor or check the likeliness of fouling formation on the membrane, other essays may be performed, as the assessing membrane permeability (Sabia et al., 2014), sludge filterability (Rosemberger & Kraume, 2003, Alkmim et al., 2014), and also by determining the concentration of compounds excreted by bacteria, i.e., Soluble Microbial Products (SMP) and Extracellular Polymeric Substances (EPS) that, according to some researchers, are the main responsible for membrane fouling formation in MBR systems (Pan et al., 2010; Lee et al., 2001).
The literature reports many studies on MBR use to treat industrial effluents, specially petroleum refinery effluent treatments. However, only few have been carried out in the long run of monitoring, and have taken into account the influence of the load variation and the composition of the effluent on the MBR performance to remove pollutants and the potentiality of fouling formation over the membranes.
Thus, this work aims to evaluate MBR performance in a pilot project to treat petroleum refinery effluent treatment, and has been primarily focused on the removing efficiency of organic substances and nutrients, and as well on analyzing fouling formation under load variation conditions and effluent composition. To have a clearer view of pollutant removing process, and membrane fouling formation causes in the MBR, detailed physicochemical characteristics of effluent, mixed liquor and permeate, and as well morphological and filtration characteristics of mixed liquor have also been studied.
2.2 Materials and methods
2.2.1 Petroleum refinery effluent
The effluent used in this study was from REGAP - Gabriel Passos Refinery Plant -
______________________________________________________________________ Programa de Pós-graduação em Saneamento, Meio Ambiente e Recursos Hídricos 12 day, and in the second stage, from the 238th to the 400th day, by an oil-water separator, flotation and sand filter
2.2.2 Experimental Apparatus and Operational Conditions
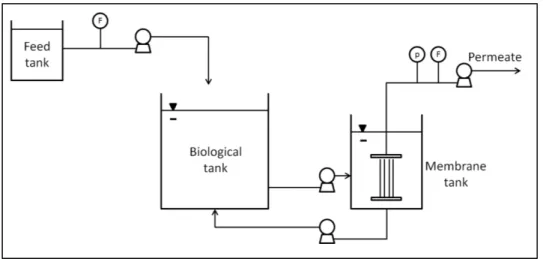
MBR pilot plants comprised a 90L biological tank connected in series to a 30L membrane tank in which PVDF hollow fiber modules with middle size pores up to 0.040 µm submersed with an 0.9 m2 area (Figure 2).
Figure 2 – MBR schematic drawing
The plant were operated and monitored for 400 days under the same operating conditions: hydraulic retention time of 8 hours, sludge retention time of 45 days, permeate flux of 16 L.m-2.h-1, backwash of 15 seconds and flux of 25 L.h-1 every 600 seconds of filtration, biological tank aeration of 3.6 L/h and membrane tank aeration of 3.0 L/h. The sludge pH has kept constant nearly 7 with a dose of a 200 ppm sodium carbonate solution and phosphor demand supplied by a 1.5 g.L-1 sodium triphosphate solution.
2.2.3 Effluent characterization and pollutant removal evaluation
______________________________________________________________________ Programa de Pós-graduação em Saneamento, Meio Ambiente e Recursos Hídricos 13 COT (5310B), alkalinity (2320B), ammonia (4500-NH3-B), phenol (5530D), color (2120B), turbidity (2130B), nitrite (4500-NO2-B), nitrate (4500-NO2-B), conductivity (2510 – B), chloride (4500-Cl -B), oils e greases (5520 D). The parameters of color, turbidity and TOC (Total Organic Carbon) have been analyzed by the following devices: Hach DR 3900 Spectrum Photometer, Hach 2100AN Turbidimeter, Shimadzu TOC-VCPH analyzer, respectively. The samples used to characterize the effluent were collected three times a week during the monitoring period.
The refinery effluent and MBR permeate were also characterized for acute toxicity by Aliivibrio fischeri bioluminescence bacterium using a Microtox® Model 500 Analyzer
(SDI). The results were presented in EC50 – (Median Effective Concentration).
2.2.4 Investigation into the mechanisms of removal and retention of organic substances by FTIR (Fourier transform infrared spectroscopy)
To evaluate the MBR pollutant removing and retaining dynamic, 200mL samples of feeding and permeate, biologic sludge, and supernatant biologic sludge after sedimentation were dried out in a dehumidifying chamber at a temperature of 100°C for 24 hours. Dry solid samples were analyzed by a FTIR spectrometer (Shimadzu IR-prestigio-21 model Infrared device in ATR module). The samples were analyzed by direct exposure of the sample compressed by radiation in the ATR module in the range from 400 to 4.000 cm−1, and resolution of 4.0. Readings were done based on percent transmittance.
2.2.5 Fouling formation evaluation
______________________________________________________________________ Programa de Pós-graduação em Saneamento, Meio Ambiente e Recursos Hídricos 14 characterized with regard to the content of carbohydrate (Dubois et al., 1956), proteins (Lowry et al., 1951), and DQO, floc size (Laser Scattering Particle Size Distribution Analyzer HORIBA - LA-950V2) and colloidal TOC (Yang et al., 2010).
The pressure and permeate flux data was daily collected. The filtering resistance caused by fouling formation was assessed based on the model proposed by Choo and Lee (1998).
MFI (Modified Fouling Index) measurements have also been performed to find out fouling characteristics. A batch cell (8400, Amicon, USA), with an ultrafiltration membrane (Nominal molecular weight limit 100 kDa, polyethersulfone, 31,7 cm2, Amicon, USA), was used to measure the permeate volume under a constant pressure of 10 psi. Two samples were applied to fractionate the membrane foulants into soluble and suspended solids (SS) compounds. First, the mixed liquor (ML) of the MBR sludge containing the soluble and SS components was filtered. Second, for the soluble component, the supernatant of the mixed liquor centrifuged at 4500 rpm for 10 min, was filtered. Last, the SS component was calculated by subtraction of the soluble component from the ML. The MFI was calculated from the plot of t/V versus V using the filtration equation at constant pressure (Equation 1). The MFI is defined as the gradient of the linear relationship between t/V and V (Equation 2) (Dillon et al., 2001).
Eq. 1
Eq. 2
where t is the filtration time (s), V is the permeate volume per unit filtration area (mL), µ is the dynamic viscosity of the permeate (Pa*s), Rm is the intrinsic membrane
resistance (m−1), P is the applied transmembrane pressure (kPa), α is the specific
______________________________________________________________________ Programa de Pós-graduação em Saneamento, Meio Ambiente e Recursos Hídricos 15 2.2.6 Statistic Evaluation
Kruskal Wallis’ test was used to check for the e isting significant differences between
the evaluated parameters, followed by nonparametric multiple comparisons among
groups. To find out the correlation between the evaluate parameters, Spearman’s
coefficient of correlation between variables was determined with further correlation significance analysis by hypothesis testing. STATISTICA 8.0 software was used for all statistical analyses.
2.3 Results and discussion
2.3.1 MBR pollutant removal efficiency
______________________________________________________________________ Programa de Pós-graduação em Saneamento, Meio Ambiente e Recursos Hídricos 16
(a)
(b)
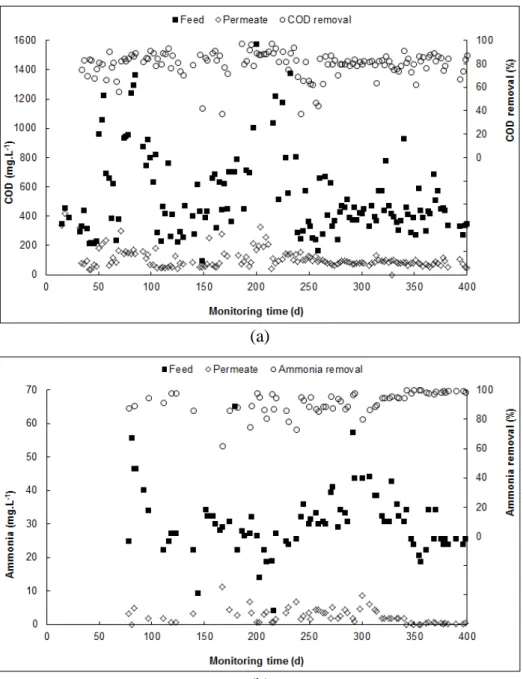
Figure 3 -Performance of the MBR for (a) COD removal and (b) NH3-N removal.
______________________________________________________________________ Programa de Pós-graduação em Saneamento, Meio Ambiente e Recursos Hídricos 17 average removal efficiency of 87 %; while in the second stage the corresponding permeate ammonia was 2.2 mg/L and standard deviation of 1.9 mg/L which corresponds to an average removal efficiency of 94 %. MBR performance difference in both stages was confirmed by statistical analyses based on Kruskal Wallis test method followed by nonparametric multiple comparisons among groups with p value < 0,05.
The average pH in the reactor suggests that most part of the ammonia nitrogen content found during the monitoring period was in ammonium cation (NH4+) form as a higher
amount of ammonia (NH3) occurs when the pH value is above 9.25 (BENJAMIN,
2002). In such condition, ammonia removal by volatilization becomes negligible, which suggests that nitrification was the main ammonia removal mechanism. Gray (2004) added that nitrification is favored by slightly alkaline conditions, at an optimal pH value between 8.0 and 8.4, which reinforces the nitrification mechanism as the one responsible for the maintenance of low concentrations of N-NH4+ in the permeate.
The lower removal ratio of ammonia during the first stage may be attributed to the lower growth rate of nitrifying bacteria as these bacteria need more time to get established and reach concentrations sufficient to nitrify the ammonium (Terada et al., 2013). In the first stage the concentration of NO3-N in the permeate (61±30 mg/L)
corresponds to 93% of total nitrogen, while in the second stage the concentration of NO3-N in the permeate (107±28 mg/L) corresponds to 98% of total nitrogen, which
reinforces the lower growth rate of nitrification in the first stage in relation to the second stage.
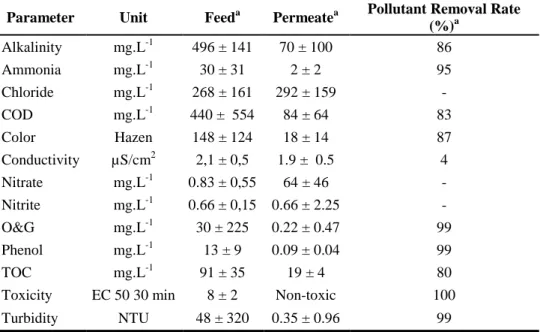
______________________________________________________________________ Programa de Pós-graduação em Saneamento, Meio Ambiente e Recursos Hídricos 18 The removal of COD and ammonia may be correlated to the sludge concentration (MLSSV) (Spearman R of -0.16367 and p-level of 0.10024 for COD removal and MLSSV correlation, and Spearman R of -0.25528 and p-level of 0.06506 for ammonia removal and MLLSSV correlation). The results of COD and ammonia removal demonstrate the importance of having an efficient pretreatment on the MBR treatment performance efficiency. Table 1 shows the physicochemical characterization results and refinery effluent toxicity after pretreatment (feed) and after MBR treatment (permeate), and also the treatment performance associated with the pollutant removal ratio.
Table 1 – Physicochemical and toxicological characterization of the MBR feeding and
permeate
Parameter Unit Feeda Permeatea Pollutant Removal Rate (%)a
Alkalinity mg.L-1 496 ± 141 70 ± 100 86
Ammonia mg.L-1 30 ± 31 2 ± 2 95
Chloride mg.L-1 268 ± 161 292 ± 159 -
COD mg.L-1 440 ± 554 84 ± 64 83
Color Hazen 148 ± 124 18 ± 14 87
Conductivity µS/cm2 2,1 ± 0,5 1.9 ± 0.5 4
Nitrate mg.L-1 0.83 ± 0,55 64 ± 46 -
Nitrite mg.L-1 0.66 ± 0,15 0.66 ± 2.25 -
O&G mg.L-1 30 ± 225 0.22 ± 0.47 99
Phenol mg.L-1 13 ± 9 0.09 ± 0.04 99
TOC mg.L-1 91 ± 35 19 ± 4 80
Toxicity EC 50 30 min 8 ± 2 Non-toxic 100
Turbidity NTU 48 ± 320 0.35 ± 0.96 99
The MBR system reduced the color of refinery effluent value from 148±124 Hazen unit to 18±14 Hazen unit corresponding to an average removal of 87%. The color remotion in the MBR may be associated with the remotion of humic substances occurred by both, biologic oxidation or by the membrane filtration. Meanwhile, the average concentration of refinery effluent turbidity was reduced from 48±320 NTU to 0.35±0.96 NTU corresponding to an average removal of 99%. Furthermore, MBR system achieved full removal of total suspended solids (TSS) from the effluent.
______________________________________________________________________ Programa de Pós-graduação em Saneamento, Meio Ambiente e Recursos Hídricos 19 other ions with the same property, besides the consumption of alkalinity for neutralizing acids produced during the degrading process.
MBR system shows high stability and efficiency to remove oil and grease even over eventual period of incidental oil and grease overload in the effluent. The average value of refinery effluent during the first stage was 155 ± 264 mg/L, and the corresponding permeate oil and grease concentration was 0.45±0.5 mg/L, which corresponds to an average removal efficiency of 99.8%, while in the second stage the average value of refinery effluent during the first stage was 20 ± 17 mg/L, and the corresponding permeate oil and grease concentration was 0.16±0.08 mg/L, which corresponds to an average removal efficiency of 99.9%.
MBR also has proved to be highly efficient to remove phenol, and then to reduce phenol concentration in refinery effluent value from 13±9 mg/L to 0.09±0.04 mg/L corresponding to an average removal of 99%.
The excellent MBR performance to remove pollutants may be confirmed by the full acute toxicity removal of the refinery effluent evaluated by Microtox test using Aliivibrio fischeri bioluminescence bacterium. It could be inferred that the toxic and
refractory organics were mainly transformed into readily biodegradable intermediates, thus wastewater toxicity was simultaneously decreased.
2.3.2 Mechanism of pollutant removal and retention
______________________________________________________________________ Programa de Pós-graduação em Saneamento, Meio Ambiente e Recursos Hídricos 20
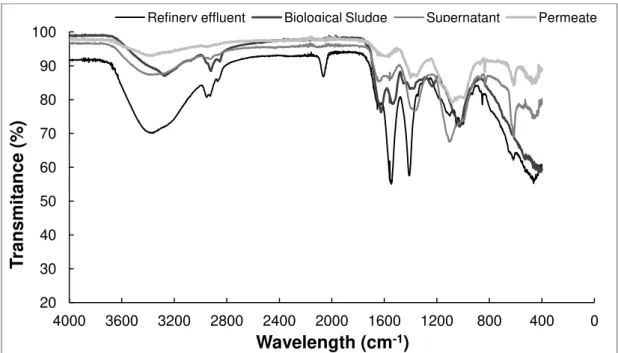
Figure 4 - FTIR spectrum of refinery effluent, mixed liquor, supernatant of mixed liquor and permeate
20 30 40 50 60 70 80 90 100
0 400 800
1200 1600
2000 2400
2800 3200
3600 4000
T
ra
nsm
itanc
e
(%
)
Wavelength (cm-1)
______________________________________________________________________ Programa de Pós-graduação em Saneamento, Meio Ambiente e Recursos Hídricos 21
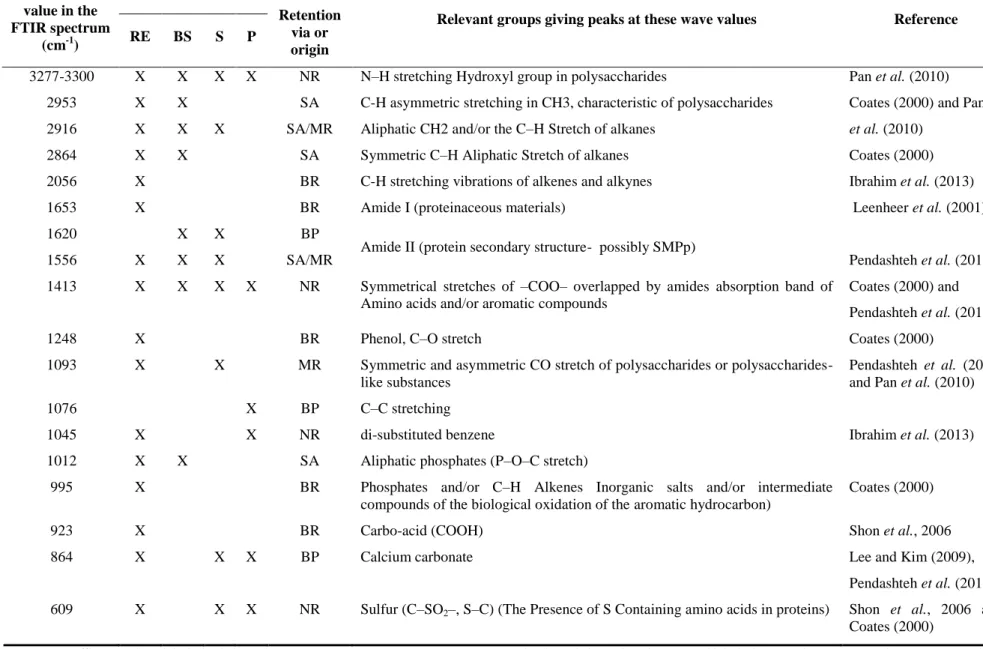
Table 2 – Main peak wave value in the FTIR spectrum, relevant groups and their corresponding wave peak values
Peak wave value in the FTIR spectrum
(cm-1)
Occurrence Removal/
Retention via or origin
Relevant groups giving peaks at these wave values Reference RE BS S P
3277-3300 X X X X NR N–H stretching Hydroxyl group in polysaccharides Pan et al. (2010)
2953 X X SA C-H asymmetric stretching in CH3, characteristic of polysaccharides
Aliphatic CH2 and/or the C–H Stretch of alkanes
Coates (2000) and Pan
et al. (2010)
2916 X X X SA/MR
2864 X X SA Symmetric C–H Aliphatic Stretch of alkanes Coates (2000)
2056 X BR C-H stretching vibrations of alkenes and alkynes Ibrahim et al. (2013)
1653 X BR Amide I (proteinaceous materials) Leenheer et al. (2001)
1620 X X BP
Amide II (protein secondary structure- possibly SMPp)
1556 X X X SA/MR Pendashteh et al. (2011)
1413 X X X X NR Symmetrical stretches of –COO– overlapped by amides absorption band of
Amino acids and/or aromatic compounds
Coates (2000) and
Pendashteh et al. (2011)
1248 X BR Phenol, C–O stretch Coates (2000)
1093 X X MR Symmetric and asymmetric CO stretch of polysaccharides or
polysaccharides-like substances
Pendashteh et al. (2011) and Pan et al. (2010)
1076 X BP C–C stretching
1045 X X NR di-substituted benzene Ibrahim et al. (2013)
1012 X X SA Aliphatic phosphates (P–O–C stretch)
995 X BR Phosphates and/or C–H Alkenes Inorganic salts and/or intermediate
compounds of the biological oxidation of the aromatic hydrocarbon)
Coates (2000)
923 X BR Carbo-acid (COOH) Shon et al., 2006
864 X X X BP Calcium carbonate Lee and Kim (2009),
Pendashteh et al. (2011)
609 X X X NR Sulfur (C–SO2–, S–C) (The Presence of S Containing amino acids in proteins) Shon et al., 2006 and
Coates (2000)
___________________________________________________________________________ Programa de Pós-graduação em Saneamento, Meio Ambiente e Recursos Hídricos 22 The FTIR analysis of the refinery effluent showed many hazardous components such as polyaromatic hydrocarbons at 1413 cm-1, C-H stretching vibrations of alkenes and alkynes at 2056 cm-1, nitric acid at 3277-3,300 cm-1, amide at 1653 and 1556 cm-1, phenol at 1248 cm-1, di-substituted benzene at 1045 cm-1 and sulfur containing groups 609 cm-1. These species were also detected in other studies involving refinery effluents (Ibrahim et al., 2013). The
peak that’s the closest to the wavelength 864 cm-1
shows the presence of calcium carbonate. The impact of calcium ions on membrane fouling formation in submerged MBR membranes remains controversial. It has been reported that the interaction of hydrophobic organic compounds such as soluble microbial products (SMP) and extracellular polymeric substances (EPS) with calcium improved bioflocculation (Nagaoka et al., 1996). Additionally, calcium may play an important role as a coagulant to produce colloidal flocs via charge neutralization (Kim and Jang, 2006). In this regard, external fouling formation promoted by calcium deposition over the membrane surface may come to be significant, if the colloidal flocs are larger than the membrane pore size. Calcium carbonate may also contribute to membrane scaling. Given to that, the concentrations of dissolved inorganic solutes increase in the direction of the feed flow, while the concentrations of sparingly soluble salts exceed their solubility limit, and then their crystallization may occur either directly over the membrane surface or in the bulk. CaCO3 particles are cohesive and lay down a deposit of CaCO3
particles over the membrane surface, which may be physically irreversible (Kim and Jang, 2006).
Some compounds detected in the effluent are biodegradable, and are removed by the biologic oxidation, evidenced by the disappearance of the peaks in the permeate, mixed liquor and supernatant spectrum at the wavelengths of 2056, 1653, 1248, 995, 923 cm-1, or intensity decrease of the peaks 1413 e 1556 cm-1. The higher intensity of the peak 2916 cm-1 (C-H asymmetric stretching in CH2) and the intensity decrease of peaks 2953 cm-1 (C-H
asymmetric stretching in CH3) and 2864 cm-1 (C-H symmetric stretching in CH2) in the
sludge, supernatant and permeate in relation to the effluent indicates changes from long aliphatic chains in wastewater to less abundant and more branched structures after going through biological treatment process.
___________________________________________________________________________ Programa de Pós-graduação em Saneamento, Meio Ambiente e Recursos Hídricos 23 wavelength of 1012, 2864 and 2953 cm-1. The biological process could be divided into two stages. Firstly, the organic matter is adsorbed by sludge, and then organic substrates cell surfaces undergo oxidation by microorganism within sludge (Zhang et al., 2014). The degradation of adsorbed compounds depend on their biodegradability as the HRT (Hydraulic Retention Time) of these compounds inside the MBR is longer than the HRT set to the MBR. The recalcitrant compounds are eliminated from the MBR along with the sludge discharge to control the cellular retention time. The adsorption of toxic recalcitrant compounds on the sludge requires a differentiated management of the discharged sludge. It is noteworthy that the adsorption of these compounds can also change the sludge characteristics and influence the sludge fouling potential.
Another mechanism involved in the removal and retention of refinery effluent compounds is their retention by the membrane evidenciated by the detection of some peaks in the biologic sludge supernatant spectrum and their absence in the permeate spectrum, i.e., peaks at wavelengths of 1093, 1556 and 2916 cm-1. The retention of organic compounds with molecular size smaller than the pore size may occur due to the fact that, during operation, a cake is formed over the membrane surface. Such cake is formed by microorganisms, cellular matter, proteins, etc., and works as a dynamic layer that favors filtration efficiency improvement by reducing the effective pore size of the membranes (Berube et al., 2006).
Some compounds are not removed or retained during the process being found in the permeate, sludge and supernatant, i.e., peaks recorded at wavelengths of 609, 864, 1045, 1413, and 3277-3300 cm-1. It is noteworthy that these residual compounds may correspond to effluent compounds and/or degradation byproducts that may contribute to membrane fouling. Shariati et al. (2011) evaluated the use of a membrane sequencing batch reactor to treat synthetic
petroleum refinery wastewater and, by analyzing the fouling material deposited over the membrane by FTIR, found polysaccharides, proteins and possibly aliphatic and aromatic hydrocarbons, or the intermediate compounds produced by their biodegradation.
___________________________________________________________________________ Programa de Pós-graduação em Saneamento, Meio Ambiente e Recursos Hídricos 24 SMP and EPS. Some of these products are retained by the membrane, while others permeate through the membrane contributing to residual COD or TOC. Such residual organic matter, although not affect the fulfillment of the law standards, can hinder the reuse of the effluent in the process.
Another substantiation of SMP and EPS production is the higher peak intensity observed at the wavelength value of 1093 cm-1 that correspond to the symmetric and asymmetric CO stretch of polysaccharides or substances resembling polysaccharides, and 609 cm-1 that correspond to the presence of S containing amino acids in the proteins in the supernatant spectrum related to the effluent spectrum. Manu authors report the presence of sulfur compounds associated with the presence of EPS (Higgins et al., 2008). An unobserved peak at 1093 cm-1 in the permeate spectrum suggests the retention of polysaccharides or substances resembling polysaccharides by the membrane, while sulfur compounds pass through the
membrane as it’s been observed in the permeate. Such SMPs play an important role in
membrane fouling formation and flow rate decrease in wastewater reclamation and reuse processes.
2.3.3 Membrane performance
For suspension filtration like biological sludge in MBR, the permeation flux will decrease proportionally to the time as a result of the increase in total resistance resulting from membrane fouling formation due to deposition of particles on the membrane, or adsorption into the membrane pores. Because MBR process in this study was operated on constant flux basis, an increase in TMP will take place during the whole experiment due to the fouling formation phenomenon as shown in Figure 5. The stable TMP during the second stage was due to the better pretreatment the have provided the conditions to the obtention of higher quality sludge. Many studies have related permeability decrement caused by fouling formation to sludge properties. For example, Chang et al. (2002), Judd (2006) and Drew (2010) presented a review of sludge parameters – floc size, MLSS, EPS, SMP, among others, and how they relate to MBR fouling formation likeliness.
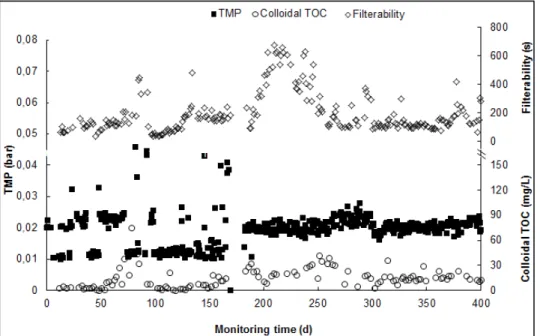
___________________________________________________________________________ Programa de Pós-graduação em Saneamento, Meio Ambiente e Recursos Hídricos 25 observed that the fouling formation over the membrane, and its consequent permeability decrease may be predicted by measuring sludge filterability, which shows that filterability is directly related to the membrane permeability. Fan et al. (2006) observed that colloidal TOC may be related to the critical flux, a parameter used to control the fouling formation process and filterability, and also defined as a flow rate below which the membrane fouling formation will not take place (Field et al., 1995). An increase in colloidal TOC content in the sludge will cause critical flux decrement.
In this study there was a negative correlation between permeability values and filterability (Spearman R = -0.151, p-level = 0.024) indicating that the better the filterability (shorter filtration time), the better the membrane permeability. Regarding colloidal TOC, it was found also a negative correlation (Spearman R = -0.238), i.e., the higher is the colloidal TOC value, the lower the membrane permeability.
Figure 5 – Behavior of TMP, Colloidal TOC and Filterability over the monitoring time.
___________________________________________________________________________ Programa de Pós-graduação em Saneamento, Meio Ambiente e Recursos Hídricos 26 maintenance of MBR membrane permeability a tough challenge at treating this kind of effluent. Over the monitoring time period, seven events of shock load were reported for high oil and grease concentrations, ammonia an phenol, which have impacted the sludge quality, increased the colloidal COT and filterability values, and consequently the membrane fouling, which increased the TMP required to keep a steady flux, and also affected the MBR performance to remove COD and ammonia (Table 3).
Table 3 – Load variations occurred over the monitoring time period and their influence on
MBR parameters
Time (days) Event descriptiona Filterabilityb (s) TMPb (bar) Colloidal TOCb(mg/L)
COD Removalc (%)
Ammonia Removalc (%)
64 -71th
High O&G concentration - 82 (24) mg/L
177 ±36 (123 ± 17)
0,024 ± 0,001 (0,022 ±0,001)
27 ± 10
(10 ±3) 61 (84) -
81-92th High NHconcentration - 46 3
(27)mg/L
389 ± 59 (171 ± 32)
0,044 ± 0,004 (0,012 ±0,001)
38 ± 9
(19 ±9) 81 (84) -
102-104th High O&G concentration - 74
(26) mg/L
64 ± 18 (46 ± 11)
0,013 ± 0,001 (0,012 ±0,001)
3 ± 1
(3 ±1) 78 (85) 89 (87)
179-207th
High Phenol concentration - 19 (2) mg/L
254 ± 75 (175 ± 46)
0,021 ± 0,001 (0,013 ±0,002)
26 ± 4
(14 ±3) 79 (89) 74 (86)
194-253th
High O&G concentration - 240 (25) mg/L
646± 23 (114 ±44)
0,022 ± 0,001 (0,019 ±0,001)
30± 3
(14 ±4) 55 (83) 79 (88)
291 - 295th High Alkalinityd 333 ± 37
(151±26)
0,024 ± 0,001 (0,021 ±0,001)
18 ± 2
(6±2) 79 (80) 80 (98)
370-377th
High Phenol concentration - 40 (9) mg/L
250 ± 99 (114 ±6)
0,022 ± 0,001 (0,020 ±0,001)
18 ± 3
(15 ±2) 74 (87) 98 (99)
a – Values between brackets correspond to the average of the parameters evaluated within the four-day period the events have occurred. b – Values in bold letters have different significance between the values evaluated before and after the events (p<0,05) at a significance level
up to 0.05%.
c –It wasn’t possible to carry out statistics tests regarding COD and ammonia removal due to the insufficiency of data. d - pH reading error – The pH sensor was located in membrane tank, and the sodium triphosphate solution was added to the biological tank. By this way, there was a response time until the sensor sensed the sludge pH stabilization in the biological tank, allowing a higher amount of
sodium triphosphate which increased the alkalinity.
___________________________________________________________________________ Programa de Pós-graduação em Saneamento, Meio Ambiente e Recursos Hídricos 27 The high concentration of O&G in the effluent may cause a number of problems to its biological treatment, including the decrease the exchange of substrate, products and oxygen between bacterial cells and the environment by depositing a lipid layer around the biological flocs. Furthermore, it may cause the emergence of foam and a high number of filamentous microorganisms with unwanted properties. Likewise, a poor microbiological activity associated with an excessive concentration of O&G prevents sedimentation and causes biomass losses. These negative effects are also associated with clogging and stinks, and besides being frequently associated with a decrease in the treatment system efficiency (Cammarota and Freire, 2006).
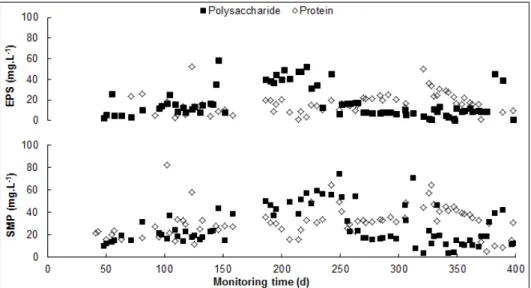
The soluble microbial products (SMP) and the polymeric extracellular substances (EPS) may potentiate the membrane fouling and diminish their filtration rates. The EPS are secreted by the cells or produced during cell lysis and are made up of insoluble materials such as capsular polymers, gels, polymers, and organic materials. EPS are important to determine biomass physicochemical properties such as floc structure, floc load and hydrophobicity. SMPs are released by cells in response to some environmental and/or operational condition during cell lysis, corresponding to the largest part of the effluent from biological processes (Laspidou and Ritmann, 2002). Figure 6 shows the SMP and EPS concentration profiles regarding polysaccharides and proteins over the monitoring time period.
Figure 6 – Behavior of SMP and EPS over the monitoring time period
___________________________________________________________________________ Programa de Pós-graduação em Saneamento, Meio Ambiente e Recursos Hídricos 28 (EPSc) varied between 1 and 58 mg/L with an average value of 17±15 mg/L, while the EPS concentration of protein (EPSp) varied between 2.7 and 53 mg/L with an average value of 17±15 mg/L. SMP and EPS value variations occur mostly in periods of stress events corresponding to a response to any high concentrations of oil and grease, phenol and others.
It’s been noticed that there was a significant positive correlation between SMPc and EPSc and
sludge filterability and particle size, and EPS concentration of TOC, with Spearman correlation coefficients of about 0.4037 and 0.3223 for SMPc and EPSc respectively. That way, it has been found that by increasing SMPc and EPSc concentration the sludge filterability decrease takes place.
Several researchers have been pointing out that polysaccharides-like substances in the fraction contribute more to fouling than the protein-like substances (Rosenberger et al., 2006; Yigit et al., 2008; Lyko et al., 2007).
According to the literature, polysaccharides contribute to the cohesion of the cell, playing an important role in maintaining the structural integrity of biofilms (Christensen, 1989). Other studies have also correlated polysaccharide concentration and fouling rate in MBR (Rosenberger et al., 2006; Fan et al., 2006).
2.3.4 Fouling characteristics
In order to identify the fouling formation process more clearly, the characteristics of fouling were occasionally analyzed by MFI (Modified Fouling Index) test of mixed liquor and sludge supernatant, and then compared it to the fouling resistance, floc size, MLSSV, colloidal TOC, SMP and EPS measurement (Table 4).
Table 4- Fouling characteristics related to sludge
Operating time (days) Fouling resistance (m-1) Sludge
MFI (s.L-2)
Supernatant
MFI (s.L-2)
Filterability (s)
Floc size (µm)
MLSSV
(mg.L-1)
Colloidal
TOC (mg.L-1)
SMP
(mg.L
-1 )
EPS (mg.L-1)
306 1.20E+10 3.00E+05 2.21E+05 105 26.5 4790 21.3 106 26.6
312 3.70E+10 2.03E+05 1.90E+05 94 26.6 6360 18.3 97 132.2
377 7.00E+10 9.24E+05 6.90E+05 421 27.2 4810 20.9 234 69.6