Field investigations of apparent optical properties of ice cover in Finnish
and Estonian lakes in winter 2009
Ruibo Lei
a, Matti Leppäranta
b, Ants Erm
c, Elina Jaatinen
band Ove Pärn
ca
Polar Research Institute of China, 451 Jinqiao Road, Pudong, Shanghai, 200136 China; leiruibo@pric.gov.cn
b
Department of Physics, University of Helsinki, Box 48, FI-00014 Helsinki, Finland; matti.lepparanta@helsinki.fi, elina.jaatinen@helsinki.fi
c
Marine Systems Institute, Tallinn University of Technology, Akadeemia tee 21, 12618 Tallinn, Estonia; ants@phys.sea.ee, ove@sea.ee
Received 7 July 2010, accepted 4 November 2010
Abstract. A field programme on light conditions in ice-covered lakes and optical properties of lake ice was performed in seven lakes of Finland and Estonia in February–April 2009. On the basis of irradiance measurements above and below ice, spectral reflectance and transmittance were determined for the ice sheet; time evolution of photosynthetically active radiation (PAR) transmittance was examined from irradiance recordings at several levels inside the ice sheet. Snow cover was the dominant factor for transmission of PAR into the lake water body. Reflectance was 0.74–0.92 in winter, going down to 0.18–0.22 in the melting season. The bulk attenuation coefficient of dry snow was 14–25 m–1; the level decreased as the spring was coming. The reflectance and bulk attenuation coefficient of snow-free ice were 0.1–0.4 and 1–5 m–1. Both were considerably smaller than those of snow cover. Seasonal evolution of light transmission was mainly due to snow melting. Snow and ice cover not only depress the PAR level in a lake but also influence the spectral and directional distribution of light.
Key words: lake ice, snow, optics, reflectance, transmittance, attenuation coefficient.
INTRODUCTION
Boreal lakes normally freeze over in winter and are isolated from the world above, apart from slow heat loss to the atmosphere in cold periods and limited penetration of sunlight. They are quiet, thermally stable, and, when snow-covered, dark water bodies as compared with the open water season. The thickness of the ice sheet is 10– 100 cm. At the bottom of snow cover a slush layer may form and further transform into snow-ice. Thus the stratigraphy of lake ice with snow cover in general consists of four kinds of layers, snow, slush, snow-ice and congelation ice, which are dissimilar in their physical properties. In some years a semi-persistent slush layer forms and acts as a habitat for biota.
Optical properties of the four layers in a lake ice sheet are quite different, and light transfer through the ice sheet is consequently sensitive to the relative thicknesses of the layers (Leppäranta et al. 2003, 2010; Wang et al. 2005; Jakkila et al. 2009; Leppäranta 2009a). The optically active substances in an ice sheet consist of the solid and liquid phases of water, gas bubbles, coloured dissolved organic matter (CDOM) in liquid water pockets and ice sediment particles. There are large differences between freshwater ice and sea ice in the concentration of entrapped CDOM and optically active particles. Beneath the ice the transferred radiation warms the water, provides light quanta for primary
production and induces vertical convection and deepening of the mixed layer (Jonas et al. 2003; Jakkila et al. 2009).
Solar radiation absorbed by ice cover warms and melts ice and snow at the surface and in the interior. In the melting season internal melting is of the same order of magnitude as boundary melting (Leppäranta et al. 2010). Then reflectance decreases and consequently the rate of melting increases, known as the ice-albedo feed-back mechanism. Internal melting also changes the physical properties of ice. Optical properties of ice and snow are therefore highly important model parameters for mathematical lake ice thermodynamic models (Launiainen & Cheng 1998; Reid & Crout 2008; Leppäranta 2009b). Although much comprehensive field measurements have been performed for better under-standing of the optical properties of sea ice (e.g. Perovich 1998; Perovich et al. 2002), similar measurements on freshwater ice are not as plentiful, especially for the light absorption and scattering in different layers from surface to bottom.
addition to the properties of the medium itself), which are obtained from irradiance measurements. Most of the solar radiation in ice and water is within the band of 350–800 nm. Photosynthetically active radiation (PAR), with the wavelength band from 400 nm to 700 nm, is of special interest in biological investigations; this band nearly overlaps with visible light. Remote sensing satellites are now providing low-cost medium- and high-resolution multi-channel optical images, such that can be utilized in large and medium-size lakes. In the calibration and validation of algorithms and for interpre-tation of data products, ground-based optical data are crucial (Kouraev et al. 2007).
In the present study a series of measurements was undertaken in seven freshwater lakes in Finland and Estonia in winter 2009. The data consist of manual spectral irradiance measurements above and below the ice cover and short time series of the vertical
distribution of PAR irradiance inside the ice. Both natural snow-covered ice and ice manually cleared of snow were examined. The fieldwork period spanned from winter to spring, covering the period when major changes in the incident solar irradiance and snow and ice cover characteristics occur. The objectives were to (1) explore the seasonal changes in apparent optical properties of snow and ice and (2) investigate the role of stratigraphy of ice and snow layers for the apparent optical properties. The results of the 2009 field programme are given here.
DATA AND METHODS Research sites
The locations of the study lakes are shown in Fig. 1, and Table 1 presents their geographical characteristics. Five
lakes are located in southern Finland, where lakes are normally ice-covered from the beginning of December to the beginning of May with the maximum annual ice thickness ranging from 30 to 80 cm (Kuusisto 1994; Kärkäs 2000; Leppäranta & Kosloff 2000). Two large lakes are included from Estonia. Võrtsjärv is a shallow lake in southern Estonia, normally ice-covered from the end of November to mid-April (Nõges 2004). Peipsi is the fourth largest freshwater lake in Europe, with a similar ice season as Võrtsjärv (Reinart & Pärn 2006).
Our field experiments were divided into three phases. The first phase was in mid-winter, 4–7 February 2009, when lake ice was in the growth stage. Observations were made in three lakes in southern Finland: Lovojärvi, Pääjärvi and Iso Valkjärvi. The second phase was performed in Estonia at the vernal equinox, from 18 to 24 March 2009, when ice cover was at its annual maximum thickness. The study lakes were Võrtsjärv and Peipsi. The third phase was in spring, 14–15 April 2009, when snow cover had melted and ice was in the melting stage; measurements were made then in two Finnish lakes, Vanajavesi and Vesijärvi.
In the presentation of data and results below, local time is used (East European Time, equal to GMT + 2 h until 28 March and GMT + 3 h thereafter in winter/spring
2009). Our sites were located in the sector 24.3°E–27.5°E, where the solar noon was at 10:38–10:49 hours GMT.
Experimental procedure
Ice samples were taken at the sites for the analysis of ice stratification and crystal structure, and the snow thickness and quality was also noted (Table 2). The thickness of ice was 18–42 cm, with 2.5–15 cm snow on top. An ice sample was taken from Iso Valkjärvi on 7 February to determine the crystal structure from thin sections. In mid-winter there was a thick cover of new snow, while in March and April snow cover had changed into a hard crust.
Two types of irradiance measurements were carried out. (1) Downwelling and upwelling spectral irradiance was measured manually above and under the ice. (2) Quantum PAR irradiance was measured by recording PAR sensors at various depths in ice and snow. The spectral measurements were made using Ramses ACC-VIS hyper-spectral radiometers (TriOS, Inc., Germany) in the wavelength window 320–950 nm with spectral resolution of 3.3 nm. The sensor is equipped with a cosine receptor and the field of view is a full hemisphere. The sensitivity goes down to 4 × 10⁻⁵ W m–2 nm–1, and spectral Table 1. Limnological features of the study lakes
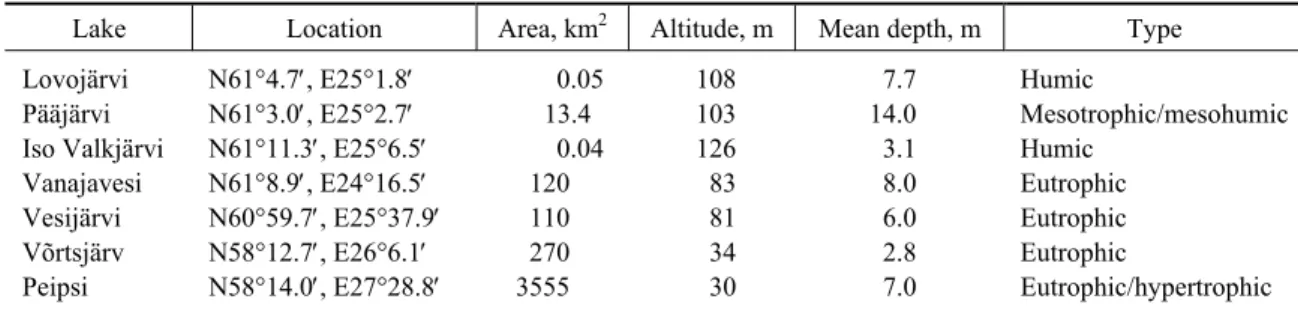
Lake Location Area, km2 Altitude, m Mean depth, m Type
Lovojärvi N61°4.7′, E25°1.8′ 0.05 108 7.7 Humic
Pääjärvi N61°3.0′, E25°2.7′ 13.4 103 14.0 Mesotrophic/mesohumic
Iso Valkjärvi N61°11.3′, E25°6.5′ 0.04 126 3.1 Humic
Vanajavesi N61°8.9′, E24°16.5′ 120 83 8.0 Eutrophic
Vesijärvi N60°59.7′, E25°37.9′ 110 81 6.0 Eutrophic
Võrtsjärv N58°12.7′, E26°6.1′ 270 34 2.8 Eutrophic
Peipsi N58°14.0′, E27°28.8′ 3555 30 7.0 Eutrophic/hypertrophic
Table 2. Ice and snow conditions in the field sites in 2009. Cloudiness and solar altitude refer to the time of spectral light measurements with Ramses ACC-VIS
Lake Date Snow depth,
cm
Ice thickness, cm
Ice freeboard, cm
Surface condition
Cloudiness, tenths
Solar altitude angle, °
Lovojärvi 4 Feb. 15 22 0 New snow 8 9.5
Pääjärvi 4 Feb. 15 18 –1.0 New snow 8 10.3
Iso Valkjärvi 7 Feb. 15 32 1.0 New snow 8 9.7
Vanajavesi 18 Mar. 15 39 –9.0 Snow + slush 4 28.7
Peipsi 24 Mar. 13 42 2.0 Crust 1 29.1
Võrtsjärv 25 Mar. 4 41 2.5 Hard crust 1 5.5
Vanajavesi 14 Apr. 2.5 34 1.0 Crust 2 19.6
accuracy is 0.3 nm. Output from Ramses ACC-VIS was transferred directly to a laptop.
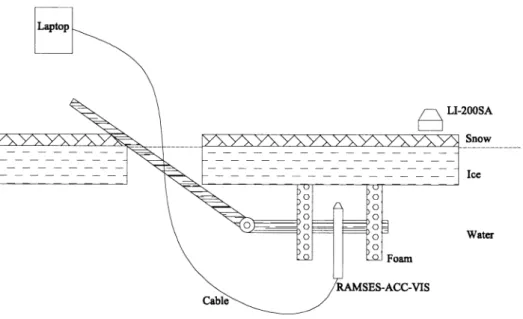
Ramses ACC-VIS was employed for the measure-ments of snow surface spectral reflectance. Downwelling irradiance was first recorded, and immediately after that the sensor head was inverted and upwelling irradiance was recorded. Irradiance under ice was measured with an aluminium frame, which was lowered through a 50 cm × 40 cm hole. The frame was equipped with a mechanism to push the sensor southwards (i.e. towards the sun) beneath the ice by 1 m (Fig. 2). Then, if the ice was snow-covered, a 2 m × 2 m spot was cleared from snow for measurements through snow-free ice. The spot was made south of the hole to minimize shadow effects on the underwater sensor. Finally, the sensor was taken out of the hole and the spectral reflectance of the cleared spot was measured. The sensor was kept at about 40 cm above the surface during measurements of upwelling irradiance ensuring that the downward-looking sensor collected more than 96% of the signal from a snow-free spot (Nicolaus et al. 2010). The incoming solar irradiance may change during the period of measurement series due to variations in cloudiness. For the control and corrections, the incident broadband (400–1100 nm) irradiance was recorded synchronously by the LI-200SA pyranometer (LI-COR, Inc., USA).
Spectral irradiance measurements were made using Ramses ACC-VIS in all lakes. In Lovojärvi the bare ice case was not measured due to technical problems. In Võrtsjärv the solar elevation was only 5.5°, shadowing effects were enhanced and irradiance under ice was
below the threshold of the sensor; thus, the Ramses data were neglected here. Because of weak incident irradiance and strong attenuation of red and near-infrared light by the snow-ice-water system, the level of under-ice light was below the sensitivity of the sensor in these spectral bands.
Attenuation of downwelling quantum irradiance through snow and ice was measured by PAR sensors (Alec Elect. Inc., Japan). These sensors are 115 mm in length and 18 mm in diameter. Quantum PAR irradiance QPAR is given in PAR quanta per unit area and unit time;
transformation to PAR irradiance in units of power (EPAR) depends on the spectral distribution of irradiance.
For white light, which can here be assumed for the atmosphere, we have QPAR [µmol m–2 s–1] = 4.60 ×EPAR
[W m–2]; in water (and ice) the spectrum of light is different and the factor 4.60 is replaced by a factor in the range 4.8–5.5, large values for more turbid waters (Reinart et al. 1998). The correction factor of 5.0 can thus be taken as a representative one in the present study. The accuracy of the PAR sensors is 2 W m–2 in air and 3 W m–2 in water (or ice). These sensors were deployed at the top and bottom of snow cover and inside the ice sheet. Installation inside ice was made in the following way. An ice block of approximately 50 cm × 50 cm horizontal cross section was cut and lifted up, and then holes were drilled from the bottom of the block for the sensors. Sensors were placed into the holes, fastened with slush filling, and the block was put back into the ice sheet. This deployment process keeps the ice above the sensors undisturbed.
Twelve PAR sensor recording series were obtained in four lakes (Table 3). Four sensors were deployed in Vanajavesi on 18 March; the recordings lasted until 7 April and the measurement interval was 10 min. The sensor at the snow–ice interface was initially covered by 5.0 cm snow, 2.0 cm slush and 2.0 cm frozen slush. By the end of the measurements snow cover melted over most of the lake. Three sensors were deployed in Võrtsjärv and two in Peipsi in March. These recordings lasted about 21 h and the measurement interval was 1 min. Three sensors were deployed in Vesijärvi on 15 April for about 2.5 h with the time interval of 1 min as well.
When picking up the sensors at the end, their position and inclination were documented. Inclinations of sensors 3 and 4 were 5° relative to the plumb line, due to the interior melting of the ice. This slight change, however, did not give any significant error on the measurements. Due to melting and re-freezing, the positions of these two sensors were changing relative to the ice top and bottom boundaries. No inclination was observed in other cases.
Parameters derived from the data
The vertical co-ordinate is denoted by z, positive down-ward and zero at the surface of the ice/snow sheet.
Spectral reflectance r( )λ is, by definition, the ratio of upwelling irradiance Eu( , 0)λ to downwelling irradiance
d( , 0):
E λ
u d
( , 0)
( ) .
( , 0)
E r E λ λ λ
= (1)
PAR-band reflectance, rPAR, is defined taking integrals
over the PAR band of upwelling and downwelling irradiances in Eq. (1). Note that albedo is defined as the ratio between upwelling and downwelling irradiances integrated over the whole wavelength window of solar radiation (in practice from 0.2 to 3.0 µm). This window is not covered with the present instrumentation; we can examine just spectral or PAR-band reflectance.
Irradiance beneath ice cover depends on reflectance, absorption and scattering in snow and ice. Spectral transmittance T( )λ is defined as
d d
( , )
( ) ,
( , 0 )
E h T E λ λ λ −
= (2)
where h is the total thickness of the ice/snow sheet and the notation 0− stands for the vertical co-ordinate just above the ice. PAR-band transmittance is then defined analogously to PAR-band reflectance. Light
trans-Table 3. Information on the setup of PAR sensors in 2009. Time is East European time, equal to GMT + 2 h in the beginning and shifting to GMT + 3 h in 03:00 hours on 28 March
Lake Sensor Measurement period Setup position Pickup position Vanajavesi 1 18 Mar. 12:05–7 Apr. 13:15 Above snow Above snow
2 18 Mar. 12:35–7 Apr. 13:15 Covered by 7 cm snow and 9 cm slush
Covered by 0.5 cm snow, 2 cm slush and 2 cm frozen slush
3 18 Mar. 11:45–7 Apr. 13:15 10 cm below the ice surface
13.5 cm below the ice surface 4 18 Mar. 11:45–7 Apr. 13:15 21 cm below the ice
surface
24.5 cm below the ice surface
Võrtsjärv 5 23 Mar. 19:00–25 Mar. 16:00 Above snow –
6 23 Mar. 19:00–25 Mar. 16:00 11 cm below the ice surface
– 7 23 Mar. 19:00–25 Mar. 16:00 27.5 cm below the ice
surface
–
Peipsi 8 24 Mar. 15:00–25 Mar. 11:30 Covered by 13 cm snow – 9 24 Mar. 15:43–25 Mar. 11:30 20.5 cm below the ice
surface
–
Vesijärvi 10 15 Apr. 10:56–13:25 Above snow –
11 15 Apr. 10:48–13:25 Covered by 2 cm snow
and 2 cm slush –
12 15 Apr. 10:47–13:25 2 cm below the ice surface
mission through snow and ice, in terms of irradiance, is described by the diffuse attenuation coefficient
( , ),
K=K λ z which tells the rate at which downwelling irradiance decreases with depth due to scattering and absorption. It is assumed that the attenuation law is similar to the Beer–Lambert beam absorption law, i.e.,
( , )
( , ) ( , ). dE z
K z E z dz
λ
λ λ
= − (3)
This can be directly integrated for a layered medium into
(
)
d( , ) [1 ( )] d( , 0) exp k k k , E λ z = −r λ E λ −
∑
λ h (4)where λk and hk are the attenuation coefficients and thicknesses of the individual layers. Equation (4) presents an inverse problem for the diffuse attenuation coefficients
for ice and snow layers, solvable by regression techniques (see Leppäranta et al. 2010). The PAR-band attenuation coefficients of snow and ice are then obtained by integrating the irradiances over the PAR region.
RESULTS
Ice and snow conditions
The winter 2008–2009 was relatively warm in the Baltic Sea region. The mean air temperature was 1.4°C above normal (1960–2000 climatology), and the maximum annual thickness of lake ice was about 10 cm less than normal. Lake ice attained its maximum annual ice thickness in late March in the present study region, and then snow cover started to melt. Ice breakup was in southern Finland on 20–30 April. The stratigraphy of ice and snow at the time of measurements is given in Fig. 3.
In February sites ice thickness was 22–32 cm and the ice was covered by snow with a thickness of 13–15 cm. The top 5 cm was fresh, fine-grained (0.5–2.0 mm) snow of low density (0.16–0.17 g cm–3). In the bottom layers the grain size was the same but density was greater, 0.20–0.22 g cm–3. In Pääjärvi the freeboard was negative and there was a thin slush layer at the snow–ice interface; therefore, when snow cover was removed, the bare ice was covered by a thin water film (up to 1–2 cm). Lovojärvi and Pääjärvi ice consisted of a granular snow-ice layer (2 cm) on top and columnar congelation snow-ice underneath. In Iso Valkjärvi there was a discernible three-layer structure as seen in the thin section photo-graphs. The top 6 cm was layered snow-ice, with the crystal size smaller than 1 mm in the top 3 cm and 1–3 mm in the lower layer. Beneath snow-ice, the congelation ice layer was 26 cm thick and consisted of large columnar crystals. The crystal height was from 10 to 100 mm, increasing with depth.
In March sites Lake Vanajavesi ice was 39 cm thick, consisting primarily of columnar congelation ice with a 1-cm granular snow-ice layer on top. Snow thickness was 15 cm, with 6 cm dry snow and 9 cm slush. The grain size was larger than in February, ranging from 2.0 to 10.0 mm in diameter, and snow density had increased to 0.32 g cm–3. In Estonian Lake Võrtsjärv there was wind-packed snow about 2 cm thick with etched surface features and a 2 cm thick nearly frozen slush layer underneath. The upper 10 cm of the ice sheet was snow-ice, below which there was an 18 cm thick columnar congelation ice layer with a distinguishable internal boundary at 14 cm from the bottom, induced by two separate ice growth phases. In Lake Peipsi the wind-packed snow was about 13 cm thick. The surface of snow cover had undergone melt-freeze metamorphosis and acquired smooth and glazed appearance. The ice was 40 cm thick, consisting of a 20-cm snow-ice layer and a 20-cm columnar congelation ice layer. Snow-ice layers in both lakes showed larger grains in deeper levels, but no internal boundary could be detected. No distinguishable boundary existed between snow and snow-ice. Strong adhesion occurred between these layers, and therefore snow cover could not be fully removed for irradiance measurements for bare ice.
In April sites, in southern Finland, snow had almost melted from the ice. In Vanajavesi, there was just a very thin coarse-grained snow cover, about 0.5 cm, and 2 cm soaked slush on top of the ice on 7 April. The ice was 41.5 cm thick, consisting of 6 cm frozen slush and 35.5 cm columnar congelation ice. In mid-April the ice in Vanajavesi and Vesijärvi was covered by thin 1–2 cm snow and a thin 1–2 cm layer of slush. When snow was removed, bare ice also was covered by a thin water film (up to 1–2 cm) in Vanajavesi, originating from
melt-water. In both lakes snow-ice had melted, and in both lakes the ice sheet consisted of 34 cm thick columnar congelation ice. The bottom ablation was 2.5 cm from 7th to 14th of April in Vanajavesi.
Spectral reflectance and transmittance of light in snow and ice
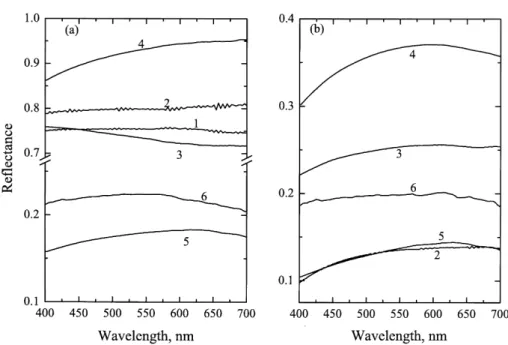
Reflectance
Manual measurements of downwelling and upwelling spectral irradiance with Ramses ACC-VIS provided spectral reflectance (Fig. 4). Measurements were made for the natural snow surface and for bare ice when snow had been manually removed. The results for the natural surface show large variation from reflectance less than 0.2 (Vanajavesi, wet and bare ice surface) to 0.9 (Peipsi, highly scattering snow crust).
In February and March the PAR-band reflectance of snow was larger than that of the bare ice surface by a factor of 2.6 to 6.2. In Peipsi, due to strong adhesion between ice and snow and a thick (20 cm) snow-ice layer with a high scattering level, the reflectance of bare ice was relative large; the PAR-band reflectance was about 0.35.
The relatively small increase in spectral reflectance after snow cover had been removed in April cases can be explained by the thin and wet snow layers. The natural snow reflectances were only 1.4 and 1.1 times the reflectances of snow-removed ice in Vanajavesi and Vesijärvi, respectively. The bare ice reflectance in Vanajavesi was comparable with that in Pääjärvi in February as both were covered by a thin water film after shovelling the snow. The spectral shapes both for the natural snow reflectance and the bare ice reflectance in April were characterized by a maximum at 550–620 nm and a slight decrease after this region due to the absorption by water within snow cover or on the bare ice surface.
Transmittance
April the increase in the spectral transmittance after snow cover had been removed was limited as the transmittance of the natural ice with thin snow cover was considerably large. Transmittance increased by factors of 1.4 and 1.6 in Vanajavesi and Vesijärvi, respectively, due to the manual removal of snow.
The spectral transmittances of snow-covered ice and snow-free ice show a similar shape in February and March, with a maximum in the middle of the PAR band. In April spectral transmittances showed different patterns. The curves were characterized by a weak wavelength dependency from 400 to 570 nm, after which Fig. 4. Spectral reflectance of (a) the natural snow surface and (b) bare ice with manually removed snow cover in the study lakes: 1, Lovojärvi; 2, Pääjärvi; 3, Iso Valkjärvi; 4, Peipsi; 5, Vanajavesi (14 April); 6, Vesijärvi.
a pronounced decrease followed. This is due to that both snow and ice contained a significant amount of liquid water, which increased the absorption in long wave-lengths of light.
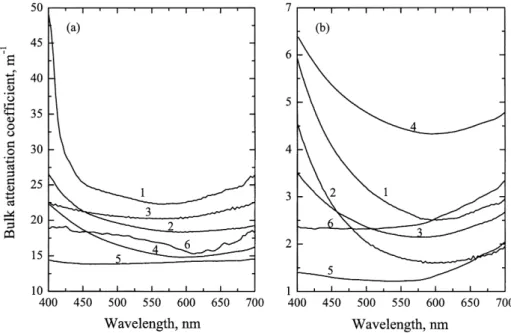
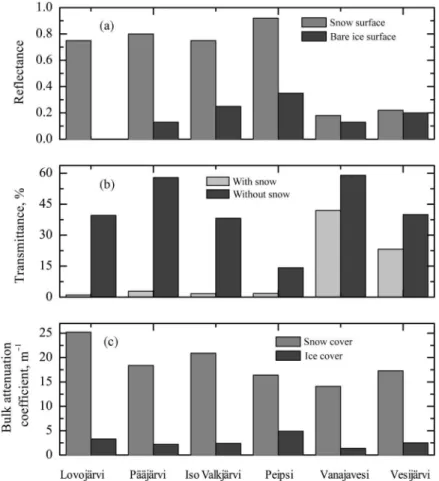
Bulk attenuation coefficients of snow and ice
Figure 6 shows the bulk attenuation coefficients of snow-covered ice and bare ice. In February the attenuation of light in natural conditions is dominated by snow influence. The snow was fine-grained and dry, and the resulting PAR-band bulk attenuation coefficient was fairly large, 20–25 m–1. With snow removed the bulk attenuation coefficient was 2–4 m–1. The coefficients showed a sharp increase at 400–425 nm, likely due to humic substances in the ice sheet (this was especially true in highly humic Lovojärvi). Although lake ice captures a very small fraction of dissolved matter from the parent water, in humic lakes CDOM content can become significant. Snow cover with fine grains in February showed distinguishably higher bulk attenuation coefficients than coarse-grained snow cover in March and April (15–20 m–1). However, this seasonal variation in the attenuation coefficient of snow was smaller than the variation in reflectance of snow. Differences in the attenuation coefficients of snow in the same month can be attributed to differences in cloud cover, solar altitude and liquid water content. The bulk attenuation coefficient of bare ice was at lowest in Vanajavesi (1–1.5 m–1) and Vesijärvi (2.5 m–1), but at highest in Peipsi (about 5 m–1) due to a large fraction of snow-ice.
The spectral shape of snow attenuation coefficients was characterized by weak wavelength dependence with a slight minimum at 570–600 nm, except for the Lovojärvi case where a peak appeared at short wave-lengths. The spectral shape of ice attenuation coefficients showed a sharp decline from 400 to 550 nm and then a slight rise, except in April with relatively weak wave-length dependence below 550 nm.
Optical properties of snow and ice determined using recording PAR sensors
The recording PAR sensors were used for time series measurements. The longest record is from Vanajavesi, from 19 March to 7 April, when the transition from winter to spring took place in the ice season with alternation of relatively cold weather and mild weather. On 19 March ice and snow cover consisted of, from top down, 7 cm snow, 9 cm slush, 1 cm frozen slush and 38 cm clear columnar congelation ice. By 7 April a marked change had taken place: snow cover was only 2.5 cm with 2.0 cm of that slush, and the ice sheet consisted of 6 cm snow-ice and 35.5 cm clear columnar congelation ice.
The weather conditions during this period are shown in Fig. 7. Solar radiation was measured at the Jokioinen weather station, 70 km west of our site in Vanajavesi. The other data are from the Laune weather station, 70 km east of our site. In this period the precipitation was all in a solid phase (snowfall), and the air temperature ranged from –19.3°C to 7.4°C. In snowfall
events solar radiation was depressed and air temperature rose. The diurnal variation in solar radiation was controlled mainly by cloudiness and solar altitude. In clear days both solar radiation and air temperature increased gradually towards spring.
Four PAR sensors were set up to measure the downwelling PAR in Vanajavesi (Table 3): sensor 1 at the surface, sensor 2 at the snow bottom, and sensors 3 and 4 in ice interior. Sensors 1 and 2 were deployed 2 m away from the ice block containing sensors 3 and 4. The records of sensors 2 and 3 are difficult to use for comparisons since major transformations took place in lower snow and upper ice layers between them, while sensors 3 and 4 are clearer and tell about the evolution of the diffuse attenuation coefficient of congelation ice. The PAR under ice during the measurement period is estimated on the basis of the location and PAR of sensor 3 and the bulk attenuation coefficient of the ice between sensors 3 and 4.
As shown in Fig. 8, sensor 1, deployed on the snow surface, became mostly likely covered by snow during
Journal of
Earth
Sciences, 2011
,
60
, 1
, 50–64
Table 4. Bulk attenuation coefficient of various snow/ice layers
Lake Measurement date
Comments Attenuation coefficient,
m–1 Võrtsjärv 24, 25 March 2 cm snow + 2 cm
refrozen slush 11 cm granular ice
14.7±1.1
16 cm congelation ice 1.7±0.5 Peipsi 24, 25 March 13 cm snow 21.3±1.5 20 cm granular ice 5.6±1.0 Vesijärvi 15 April 2 cm snow + 2 cm slush 11.6±1.4 20 cm columnar ice 1.2±0.1
of snow and ice were due to the day-to-day variations in solar altitude, cloudiness, and day and night melt–freeze processes in snow cover.
The records were short in other lakes and were used to estimate just the mean attenuation coefficients. The results are shown in Table 4. Since there were no measurements for incident PAR in Peipsi, we used the corresponding reading in Võrtsjärv also for Peipsi. This
is acceptable since it was a clear day and the distance between the lakes is only about 70 km. The columnar congelation ice had the smallest attenuation coefficient, which was 21–30% of that of granular ice, and 5.6– 14.6% of that of snow/slush. This can be used to explain why the change in the transmittance of natural snow-covered ice was dominated not only by the thickness but also by the stratigraphy, and why the bare ice in Peipsi had the smallest transmittance compared with other cases.
Comparisons between lakes
Averaged optical properties integrated over the PAR band are shown in Fig. 9. Here we apply single-dependent-variable and multiple-single-dependent-variable linear regression to examine the role of various factors influencing the optical properties of lake ice cover.
Light transmittance through snow-covered ice is primarily determined by the total thickness of snow and slush (TSS). Regression analysis showed significance at
the 1% level (correlation coefficient R = –0.945), but ice thickness was insignificant in the present data at the
5% level, largely because thickness variations were small. Furthermore, transmittance is explained by snow and slush thicknesses (separately) significantly at the 1% level (R = –0.987), and by TSS and ice thickness
(separately) significantly at the 5% level (R = –0.961). In snow-free ice the regression shows insignificance for ice thickness at the 5% level but snow-ice thickness is significant at the 5% level (R = –0.827). Adding congelation thickness separately to snow-ice thickness does not improve the regression fit. Thus, the primary influence on the transmittance of snow-free ice comes from snow-ice thickness.
It is obvious that the reflectance of the natural snow surface is largely explained by snow thickness: this is significant at the 5% level (R = 0.955). Total snow and slush thickness TSS is also significant at the 5% level
(R = 0.949); that vs. the total thickness of snow, slush and ice is insignificant at the 0.05 level; that vs. snow thickness and slush thickness (separately) is insignificant at the 0.05 level. Thus, the primary influence on the changes in the snow reflectance is snow thickness. To explain the bare ice reflectance, ice thickness is insignificant but snow-ice thickness is significant at the 5% level (R = 0.938). Reflectance also depends on the surface condition. For example, the bare ice reflectance in Peipsi was relatively large, as the snow could not be removed completely, while the bare ice reflectance was relatively small in Pääjärvi and Vanajavesi, since there was a thin water film on the ice. However, the surface condition is difficult to characterize quantitatively.
The light attenuation coefficient of snow is influenced by snow texture and impurities. Due to the limitation of the present data, we could not analyse this question. The light attenuation coefficient of ice could be explained by the fractional thickness of snow-ice thickness to 74.6% at the 5% significant level, which is due to the relatively high scattering level of snow-ice compared with congelation ice.
Solar altitude and cloudiness also influence the apparent optical properties. We found that the PAR transmittance at the top layer always showed a maximum at noon, which is at least partly connected to the high solar altitude at noon. The weak incoming solar irradiance in early morning or later afternoon may also introduce more measurement noise.
DISCUSSION
Arst et al. (2006) examined optics of lake ice in Estonia and South Finland. They found integral PAR trans-mittances from 0.6% to 8.4% for natural snow-covered ice and from 7.5% to 58% for ice cover where snow was manually removed as here. All values are close to our
results. The melt season (April) could not be compared, since their data did not include this period. Then the present transmittances were quite large for natural snow-covered ice (23–42%), which can be attributed to very thin and wet snow cover. The bulk PAR attenuation coefficient for bare lake ice ranged from 0.5 to 3.5 m–1 in Arst et al. (2006), which is comparable with our results. As the attenuation coefficient of congelation ice is close to that of lake water, the magnitude of irradiance under snow-free ice cover is comparable with that at the same depth of ice-free lakes. However, light having penetrated ice cover is considerably more diffuse than that at the same depth in ice-free lakes (Arst et al. 2006, 2008).
The transmittance of congelation ice was good and stable. However, at the end of the melting season temporal variations in the transmittance are expected when the porosity of ice increases. Jakkila et al. (2009) reported of such changes as the columnar congelation ice was transformed into candled ice due to ice melt at crystal boundaries. Candled ice has relatively large porosity, with a high scattering level when pores contain gas, but good transmittance when pores contain liquid water. Our PAR sensor time series record lasted just to 7 April, by which time the deterioration of the interior of the ice sheet was undetectable.
The influence of snow cover on light transmittance was also demonstrated by Bolsenga (1981). In his case the PAR transmittances were 90% for 28 cm thick clear ice and 10% for the same ice cover with 3 cm thick fresh snow on top. Bolsenga (1983) obtained PAR band spectral reflectances 0.75–0.90 for ice covered by new snow, 0.15–0.25 for ice covered by a thin deteriorated snow layer, 0.2–0.4 for refrozen slush ice and 0.10–0.15 for clear ice.
In Antarctic lakes in winter the bare ice reflectance ranges form 0.17 to 0.40 (Kaup 1995), which is close to our results. However, since there was no snow in their cases, the ice surface became whitish in the melting period and the reflectance reached levels from 0.44 to 0.52. This phenomenon did not occur in our cases. An explanation for this could be that the bare ice surface would be covered by a thin water film as the snow melting during spring for our cases.
there is insignificant difference between reflectances of brackish landfast ice and lake-ice when they are covered by a similar snow cover. However, bare sea-ice has a larger reflectance than bare lake-ice.
CONCLUSIONS
Optics of snow-covered lake ice in Finnish and Estonian lakes has been examined on the basis of field measurements in seven lakes in February–April 2009. The data consist of manual spectral irradiance measure-ments above and below ice cover and recording PAR sensors deployed into the ice and snow.
Snow cover was the dominant factor for transmission of PAR into the lake water body, due to its large reflectance and attenuation coefficient. Natural snow-covered ice had high reflectance in winter (February– March), bulk PAR reflectances ranging from 0.74 to 0.92. In April snow began to melt, liquid water was present in the snow layer and the grain size and density of snow increased. In mid-April also ice cover was deteriorated, and with wet and thin snow cover showed much lower reflectance, 0.18 to 0.22 integrated over the PAR band. The increase in incoming solar irradiance and light transmittance of snow-covered ice induced a distinct increase in the PAR under ice. Thus, for the ecosystem and thermodynamics underneath ice cover, the available PAR can reach a high level before ice cover has melted, resulting in convection and start-up of the spring bloom.
The bulk attenuation coefficient of dry snow in winter was relatively large, from 14.1 to 25.2 m–1; the level decreased as the spring was coming. After snow cover had been removed, bare ice reflectance was dominated by the surface condition and snow-ice thickness. The bulk attenuation coefficient of snow-free ice was dominated by the fractional thickness of snow-ice, since the attenuation coefficient was much larger in snow-ice than in columnar congelation ice, by the factor of 2 to 3. Both the reflectance and bulk attenuation coefficient of snow-free ice were considerably smaller than those of snow cover: 0.1–0.4 and 1–5 m–1. The lack of significant increase in light transmittance after the snow cover had been removed in April is explained by the relatively thin snow cover and its relatively low reflectance and attenuation coefficient.
Seasonal evolution of light transmission was mainly due to snow melting. In the period of measurements changes in the reflectance and bulk attenuation coefficient of ice were small. Light transmission through bare ice cover strongly depended on the thickness of snow-ice, which firstly increased the amount of radiation scattered back into the atmosphere. Thus, for the evolution of the
transparency of ice cover, in the melting season the top boundary, bottom boundary and interior are all critical. Snow and ice cover not only depress the PAR level in a lake but also influence the spectral and directional distribution of light.
There are distinct seasonal changes in stratigraphy of snow and ice. Due to strong relationships between the optical properties of ice and snow and their stratigraphy, parameterizations of the light transfer through snow and ice in numerical modelling should include this stratigraphy as a dependent model variable. Also, to predict the onset of primary production in spring, a good understanding of optical properties of snow and ice is needed. In addition, crystal structure, gas bubble size and contaminants should also be considered in predicting light transfer through snow and ice. For apparent optical properties, solar altitude, cloud types and cloud amount need also to be taken into account. Our measurements are still limited and more fieldwork and model experiments are necessary to develop parameterization of the reflectance and transmittance of light.
Acknowledgements. February 2009 data were acquired during the Winter Limnology field course in the Lammi Biological Station of the University of Helsinki. Comments from Dr Bin Cheng on the manuscript are greatly appreciated. Professor Kunio Shirasawa is thanked for the use of his PAR sensors. This work was supported by the bilateral exchange programme of the Academy of Finland and Estonian Academy of Sciences, National Natural Science Foundation of China under contract No. 40930848, and YMPANA research programme (development of a lake monitoring station) in Finland. The first author has also received a CIMO scholarship from the Ministry of Education and Culture of Finland, which is gratefully acknowledged.
REFERENCES
Arst, H., Erm, A., Leppäranta, M. & Reinart, A. 2006. Radiative characteristics of ice-covered fresh- and brackish-water bodies. Proceedings of the Estonian Academy of Sciences, Geology, 55, 3–23.
Arst, H., Erm, A., Herlevi, A., Kutser, T., Leppäranta, M., Reinart, A. & Virta, J. 2008. Optical properties of boreal lake water in Finland and Estonia. Boreal Environment Research, 13, 133–158.
Bolsenga, S. J. 1981. Radiation transmittance through lake ice in the 400–700 nm range. Journal of Glaciology, 27(95), 57–66.
Bolsenga, S. J. 1983. Spectral reflectances of snow and fresh-water ice from 340 through 1100 nm. Journal of Glaciology, 29(102), 296–305.
Jonas, T., Terzhevik, A. Y., Mironov, D. V. & Wüest, A. 2003. Radiatively driven convection in an ice-covered lake investigated by using temperature microstructure technique. Journal of Geophysical Research, 108(C6), 3183.
Kärkäs, E. 2000. The ice season of Lake Pääjärvi in southern Finland. Geophysica, 36, 85–94.
Kaup, E. 1995. Solar radiation in water bodies. In The Schirmacher Oasis, Queen Maud Land, East Antarctica and Its Surroundings (Bormann, P. & Fritsche, D., eds), pp. 286–290. Justus Perthes Verlag Gotha.
Kouraev, A. V., Semovski, S. V., Shimaraev, M. N., Mognard, N. M., Légresy, B. & Remy, F. 2007. Observations of Lake Baikal ice from satellite altimetry and radiometry.
Remote Sensing of Environment, 108, 240–253.
Kuusisto, E. 1994. The thickness and volume of lake ice in Finland in 1961–90. Publications of the Water and Environmental Research Institute, 17, 27–36.
Launiainen, J. & Cheng, B. 1998. Modelling of ice thermo-dynamics in natural water bodies. Cold Regions Science and Technology, 27, 153–178.
Leppäranta, M. 2009a. Modelling of formation and decay of lake ice. In Impact of Climate Change on European Lakes
(George, G., ed.), pp. 63–83. Springer-Verlag, Dordrecht. Leppäranta, M. 2009b. A two-phase model for
thermo-dynamics of floating ice. In Proceedings of the 6th Workshop on Baltic Sea Ice Climate (Leppäranta, M., ed.),
Report Series in Geophysics, 61, 146–154. Department of Physics, University of Helsinki, Helsinki, Finland. Leppäranta, M. & Kosloff, P. 2000. The thickness and
structure of Lake Pääjärvi ice. Geophysica, 36, 233–248. Leppäranta, M., Reinart, A., Erm, A., Arst, H., Hussainov, M.
& Sipelgas, L. 2003. Investigation of ice and water properties and under-ice light fields in fresh and brackish water bodies. Nordic Hydrology, 34, 245–266.
Leppäranta, M., Terzhevik, A. & Shirasawa, K. 2010. Solar radiation and ice melting in Lake Vendyurskoe, Russian Karelia. Hydrology Research, 41, 50–62.
Nicolaus, M., Hudson, S. R., Gerland, S. & Munderloh, K. 2010. A modern concept for autonomous and continuous measurements of spectral albedo and transmittance of sea ice. Cold Regions Science and Technology, 62, 14–28.
Nõges, T. 2004. Reflection of the changes of the North Atlantic Oscillation Index and the Gulf Steam Position Index in the hydrology and phytoplankton of Võrtsjärv, a large, shallow lake in Estonia. Boreal Environment Research, 9, 401–407.
Perovich, D. K. 1998. The optical properties of the sea ice. In Physics of Ice-Covered Seas (Leppäranta, M., ed.), pp. 195–230. Helsinki University Printing House, Helsinki.
Perovich, D. K., Grenfell, T. C., Light, B. & Hobbs, P. V. 2002. Seasonal evolution of the albedo of multiyear Arctic sea ice. Journal of Geophysical Research, 107(C10), 8044. Rasmus, K., Ehn, J., Granskog, M., Kärkäs, E., Leppäranta, M.,
Lindfors, A., Pelkonen, A., Rasmus, S. & Reinart, A. 2002. Optical measurements of sea ice in the Gulf of Finland. Nordic Hydrology, 33, 207–226.
Reid, A. & Crout, N. 2008. A thermodynamic model of freshwater Antarctic lake ice. Ecological Modeling, 210, 231–241.
Reinart, A. & Pärn, O. 2006. Ice conditions of a large shallow lake (Lake Peipsi) determined by observations, an ice model, and satellite images. Proceedings of the Estonian Academy of Sciences, Biology, Ecology, 55, 243–261. Reinart, A., Arst, H., Blanco-Sequeiros, A. & Herlevi, A.
1998. Relation between underwater irradiance and quantum irradiance in dependence on water transparency at different depths in the water bodies. Journal of Geophysical Research, 103(C4), 7749–7752.
Wang, C., Shirasawa, K., Leppäranta, M., Ishikawa, M., Huttunen, O. & Takatsuka, T. 2005. Solar radiation and ice heat budget during winter 2002–2003 in Lake Pääjärvi, Finland. Verhandlungen IVL, 29, 414–417.