www.hydrol-earth-syst-sci.net/13/1749/2009/ © Author(s) 2009. This work is distributed under the Creative Commons Attribution 3.0 License.
Earth System
Sciences
A qualitative description of shallow groundwater effect on surface
temperature of bare soil
F. Alkhaier1, R. J. Schotting2, and Z. Su1
1Department of water resources, International Institute for Geo-information Science and Earth Observation,
Enschede, The Netherlands
2Faculty of Geosciences, Utrecht University, Utrecht, The Netherlands
Received: 6 February 2009 – Published in Hydrol. Earth Syst. Sci. Discuss.: 9 March 2009 Revised: 21 August 2009 – Accepted: 13 September 2009 – Published: 30 September 2009
Abstract. Whether or not shallow groundwater affects skin temperature (the temperature of soil surface) is important to detect depth and extent of shallow groundwater by dint of re-mote sensing and important for land surface modelling stud-ies. Although few studies have been conducted to investigate that effect, they have yielded contradicting conclusions and they stopped in 1982. To determine that shallow groundwa-ter affects skin temperature, we measured soil temperature at two different depths (5 and 10 cm) in seven places with vari-able water tvari-able depths every ten minutes and for six days. After that, we correlated the minimum, maximum and av-erage daily temperatures to avav-erage groundwater depth. We also built a simple numerical model using a differential equa-tions solver, Flex PDE, to simulate heat transfer into soil pro-file and used it to simulate groundwater effect on skin tem-perature. We found quite high negative correlation between the maximum and average daily soil temperature and ground-water depth. Contrarily, we could hardly find any correlation between the daily minimum temperature and groundwater depth. Numerical simulations, though simple, were useful in showing that groundwater shifted skin temperature curves up in the winter and down in the summer without affecting the shape of the curve. We conclude that shallow groundwa-ter affects skin temperature directly by its distinctive thermal properties in the soil profile and indirectly by affecting soil moisture which in turn has many different and contradictory effects on skin temperature. This study recommends build-ing a comprehensive numerical model that simulates the ef-fect of shallow groundwater on skin temperature and on the different energy fluxes at land surface.
Correspondence to:F. Alkhaier ([email protected])
1 Introduction
Whether or not shallow groundwater affects skin temperature is important in many aspects. Skin temperature is a key factor in solving surface energy balance and affects all its compo-nents (i.e. latent, sensible and ground heat fluxes). Besides, skin temperature is the only means through which thermal remote sensing can detect the existence, depth and extent of groundwater perching at shallow depths.
In spite of the numerous studies which have dealt with heat transfer and temperature distribution within the soil pro-file and at land surface, a few have investigated the effect of shallow groundwater on the behaviour of surface soil tem-perature.
Although Kappelmeyer (1957) could successfully use temperature measurements conducted at shallow (1.5 m) depth to locate fissures carrying hot water from deep groundwater, pioneering studies to locate shallow aquifers by geothermal measurements were initiated by Cartwright (1968), who correlated soil temperature at 0.5 m depth to the groundwater depths. A year later, Birman (1969) found that shallow earth temperatures could be related to the occurrence of groundwater.
with the technology presented at that time. He explained that the minimum detectable temperature contrast using a ther-mal infrared scanner was in the order of 0.5◦
C, while the minimum detectable change of groundwater depth under the best conditions according to his model was in the same order of magnitude.
The most recent study investigating the effect of ground-water on skin temperature that could be found in the litera-ture was Heilman and Moore’s (1982 – four years after Hunt-ley’s). They showed again that radiometric temperature mea-surements could be correlated to depth to shallow ground-water if appropriate considerations were given to the effect of vegetation on the surface thermal regime. They also rec-ommended that techniques for distinguishing water table in-fluences from those of soil moisture should be developed to make the temperature method works for groundwater studies. The concern of many of the surveyed studies was the depth in the soil column (0.5–1.5 m) to investigate the effect of shallow groundwater on soil temperature. Other studies which focused on the effect of shallow groundwater on skin temperature were few and yielded contradicting results. And most importantly, they have ceased since 1982.
The objective of this paper is to show the effect of shal-low groundwater on skin temperature by field measurements and to examine the reason behind this effect with a simple numerical model. A detailed numerical model, that can sim-ulate the energy balance components and solve this balance for skin temperature and soil moisture, needs a very complex numerical modelling effort, and is beyond the scope of this paper.
In this study the relationship between soil temperature close to the surface (5 and 10 cm) and water table depth was investigated by correlating the daily minimum, maxi-mum and average soil temperature readings to water table depth. To simulate the effect of shallow groundwater on skin temperature, a one dimension transient heat transport model was built using Flex PDE (PDE Solutions, Inc.), a scripted fi-nite element model builder and numerical solver. This model turned out to be useful for explaining and justifying the
rea-n Eq. (2):
Rn=Kin−Kout+Lin−Lout (2)
Where Kin andKout (W m−2)are respectively the
incom-ing and outgoincom-ing short-wave radiation, and Lin and Lout
(W m−2)are the incoming and outgoing long-wave radiation,
respectively.
After subtracting the sensible and the latent heat fluxes from the net radiation the resultant is considered as ground heat flux: the flux that is of prime responsibility of control-ling soil temperature in the absence of inner energy sources (i.e. nuclear minerals, magma eruption, hot springs etc.), then we write:
G=Rn−H−LE (3)
DailyG can be described analytically under periodic forc-ing assumption (Horton and Wierenga, 1983; Santanello and Friedl, 2003) as:
Gdaily=k·A1·
s 2·π α·p1
·sin(2·π·t p1
+π
4) (4)
This can be extended to describe the yearlyGby:
Gyearly=k·
" A1·
s 2·π α·p1
·sin(2·π·t p1
+π
4)+A2· s
2·π α·p2
·sin(2·π·t p2
+π
4)
(5) Wherek (J m−1sec−1◦C−1)andα(m2sec−1)are the
aver-age soil thermal conductivity and thermal diffusivity.A1and
A2 (◦C), respectively, are the daily and yearly temperature
amplitudes at land surface respectively,p1is one day andp2
is one year expressed in the time unit of the equation (sec). As soon as heat penetrates the soil its transfer is well de-scribed by the heat diffusion equation:
∂(k·∂T )
∂2z =VHC·
∂T
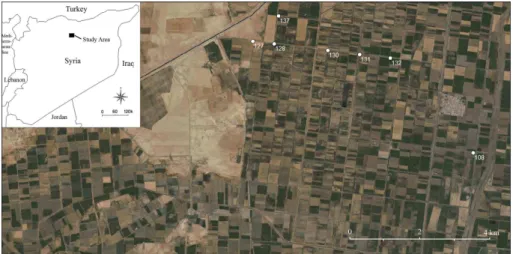
Fig. 1.Study area with observation sites (Google Earth image).
Wherek is the thermal conductivity (J m−1sec−1◦ C−1),T
is temperature (◦
C),zis depth (m),V H Cis the volumetric heat capacity (J m−3◦
C−1)andt is time (sec).
Values of thermal conductivity and volumetric heat capac-ity can be calculated by using the method of de Vries (de Vries, 1963; Wierenga and de Wit, 1970). According to this method and depending on the physical properties of the soil components (i.e. air, water, minerals and organic matter) thermal conductivity can be expressed as:
k=
n P
i=0
ki·Xi·φi
n P
i=0
ki·Xi
(7)
And volumetric heat capacity can be described as:
VHC=
n X
i=0
VHCi·Xi (8)
WhereXi (−) is the volumetric fraction of each soil com-ponent,ki (J m−1sec−1◦C−1)is its thermal conductivity,φi (−) is its shape factor, VHCi (J m−3◦C−1)is its volumetric
heat capacity andnis the number of the soil components. Groundwater existence within the soil profile is expressed by the distinctive values of both thermal conductivity and volumetric heat capacity of the saturated soil. Saturated soils naturally have high values of both.
2 Methods and materials
2.1 Field measurements
Field measurements were conducted in an agricultural area that lies within Euphrates basin in the north part of Syria (Fig. 1). The boundaries of this area stretch between lon-gitude 38◦
43′ to 39◦
03′
E and latitude 35◦ 55′
to 36◦ 13′
N.
The agricultural fields are equipped with irrigation canals and drainage conduits. Groundwater level has been monitored by means of a dense network of observation piezometers.
Arid conditions prevail in the region with an average an-nual rainfall less than 200 mm and average free water sur-face evaporation ranging between 1.4 mm/day in January and 14.3 mm/day in July (Alkhaier, 2003).
Pedological data show that silty clay soils cover most of the fields. The poor hydraulic permeability of these soils to-gether with existence of a heavy clay layer at approximately ten meters depth make the groundwater generally perch at shallow depths all year around.
In January 2008 (winter time) seven locations (Fig. 1) with dissimilar water table depths were chosen. In each location, two temperature loggers were deployed in the soil at two different depths (approximately 5 and 10 cm). The loggers recorded temperature every ten minutes for almost six days duration. However, taking into account only the full 24-h days restricted the data to five days.
Upon loggers’ deployment, water table depths were mea-sured, soil samples of the upper 5cm were taken to the labo-ratory for texture analysis and soil moisture determination.
To omit the effect of soil moisture difference on soil tem-perature among the measurement locations, soils at the log-gers’ locations were watered until saturated immediately be-fore the last day of the experiment. The temperature of the applied water was just above the freezing point, as it was taken from the nearby irrigation canals where water froze at the surface of these canals.
correlations. In addition, the maximum, minimum and aver-age daily temperatures at the different sites of measurement for two days (day 3, as a representative of the four dry days, and day 5, the wet day) were plotted against the average wa-ter table depths. Also, soil moisture values of the upper 5cm at the different locations were plotted against average water table depths.
2.2 Numerical simulations
Flex PDE, a scripted finite element model builder and partial differential equations numerical solver, has been utilized to simulate heat transfer (Eq. 6) in one dimension of the soil profile. Supposing that groundwater existence within the soil profile does not affect the energy balance at land surface, the sameG(Eq. 5) was applied as an upper boundary condition (Neumann boundary condition) at the top of two different profiles:
– The first has no groundwater. So, it has a single value of thermal conductivity and another single value for volu-metric heat capacity (please note that we simplify the simulation by assuming that the soil profile is homoge-nous with invariant soil thermal properties).
– But, the second profile has shallow groundwater perch-ing at different depths (one, two, three, four and five me-ters, respectively) from land surface downwards. There-fore, it has two different sections with different values of both thermal conductivity and volumetric heat capacity. Values of thermal conductivity and volumetric heat ca-pacity of the unsaturated part of the second profile were given exactly the same values of the first (dry) profile. The lower boundary condition at ten meters depth (approxi-mately the yearly penetration depth of heat) was set as a fixed temperature of 22◦C (Dirichlet boundary condition), which is the annual deep soil temperature of the region.
The two simulations were run for one year duration, after one year of pre-simulation to reach the actual initial
bound-files was then compared to each other.
3 Results
3.1 Results from field measurements
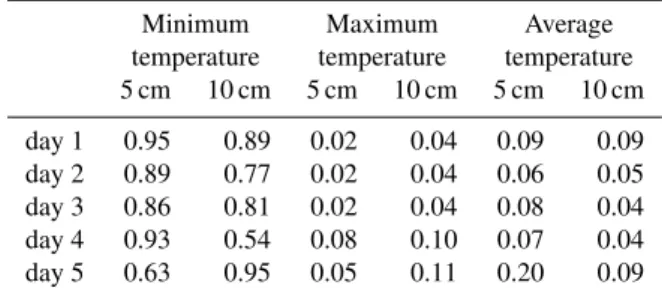
Table 1 contains the correlation coefficients between, on one hand, the maximum, minimum and average daily tempera-tures at the two depths (5 cm and 10 cm) and the average wa-ter table depths for a year before, on the other. And Table 2 contains the p-values corresponding to the correlation coeffi-cient of Table 1.
We can see that the correlation coefficients values of the minimum temperatures are very low and have contradicting signs (negative and positive) between 5 cm and 10 cm, while those for maximum and average temperatures are high and have negative sign. Another remark can be elicited here that the values of the correlation coefficients did not change sig-nificantly in the last day when the soils were saturated.
Studying the p-values in Table 2, we notice that the high correlation coefficients for the maximum and average tem-peratures have very small values of p-values. The observa-tion that most of these values are smaller than 0.10, and many are smaller than 0.05, indicates that those high values of cor-relation coefficients are statically significant. At the same time we notice that the p-values corresponding to the low val-ues of correlation coefficients for the minimum temperatures are large, which is understandable as there is no correlation for those minimum temperatures.
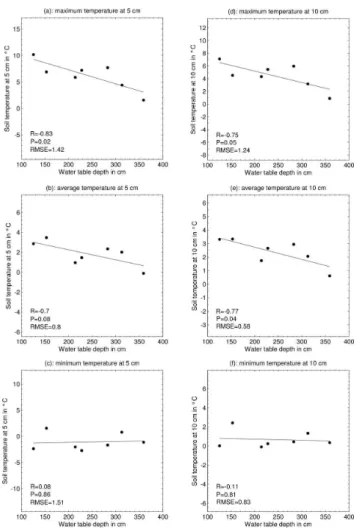
Fig. 2. Min, max and average temperature vs. water table depth of the third day for temperature measurements at 5 cm and 10 cm depth.
For both figures, it is clear that the maximum temperature has the highest correlation coefficient followed by the aver-age temperature, while the minimum temperature has very low correlation coefficient. Moreover, there is no drastic change in the correlation coefficients before and after wet-ting the soils.
Figure 4 shows the relationship between volumetric soil moisture of the upper 5 cm measured at the seven different locations and the average water table depth. It can be seen that soil moisture decreases when the depth to groundwater increases.
3.2 Results from numerical simulations
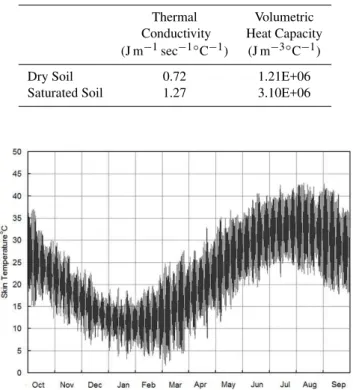
Values of thermal conductivity (J m−1sec−1◦
C−1)and
vol-umetric heat capacity (J m−3◦
C−1)of the dry and saturated
sections of the simulated profiles, calculated using Eqs. (7) and (8) are shown in Table 3.
To give the reader an impression of the range and the shape of the simulated skin temperature oscillation investigated in
Fig. 3.Min, max and average temperature vs. water table depth of the last day (wet soil) for temperature measurements at 5 cm and 10 cm depth.
Fig. 5.Skin temperature oscillations of the simulated year.
this hypothetical numerical experiment, we present in Fig. 5 the skin temperature of the dry profile for the simulated year which begins in October. We can observe that the lowest temperatures occur in February and the highest in August.
The difference between the simulated values (skin temper-ature of the profile with groundwater perching at one meter, minus the skin temperature of the dry profile) is shown in Fig. 6.
Several remarks can be elicited from this graph, firstly, there is no oscillation in the values of difference, mean-ing that the skin temperatures of the two simulations are shifting up or down without changing their daily ampli-tudes. Secondly, the difference is positive in months from January to May, and reaches its maximum value of 3◦C in March. Thirdly, the difference is negative in months from July to November and reaches its minimum value of−3◦
C in September, and finally there are two months (namely De-cember and June) when the difference is at lower values.
Values of maximum differences between the dry profile and the simulated profiles with different water tables are 1.5◦
C for 2 m depth, 0.8◦
C for 3 m depth, 0.4◦
C for 4 m depth and 0.2◦
C for 5 m depth. Naturally, these water depths in-clude the capillary rise value.
Fig. 6. The difference between the simulated skin temperatures of the two profiles (skin temperature of the profile with groundwater perching at one meter, minus the skin temperature of the dry pro-file).
4 Discussion and conclusions
In this study, we observe that shallow groundwater affects skin temperature. This is evidenced firstly, by the statistically significant high correlation between daily maximum and av-erage soil temperatures and water table depth (Tables 1 and 2, Figs. 2 and 3), and secondly, by the difference in simulated skin temperatures caused by groundwater perching within the relevant soil profile (Fig. 6).
It is difficult and expensive to measure skin temperature in situ for different locations simultaneously. However, in terms of the fact that the heat diffusion equation (Eq. 6) is the master governing equation of heat transfer in the soil, the recorded temperatures at 5 and 10 cm can be considered as filtered signals of the temperatures at land surface. Further on, the correlations we’ve obtained can be safely considered valid for skin temperature because of the homogeneity of the soil and meteorological conditions in the region.
There are still other potential factors behind these correla-tions. For instance, elevation difference can influence both soil temperature and groundwater depth and lower eleva-tion can be related to higher air temperature and shallower groundwater depth. However, the study area is flat and lim-ited. The difference in elevation among the seven locations is less than five meters, and the furthest distance among them is less than seven kilometres (Fig. 1). That is why we ignore any effect of the difference in elevation or air temperature.
of the curve, field measurements show that the amplitudes of temperature curves are affected by shallow groundwater. That is lucid from the different values of correlation coeffi-cients of the minimum, maximum and average daily temper-ature with water table depth (Table 1).
The dissimilarity between the two results is due to the sim-plicity of our numerical experiment. Firstly, it did not include and solve for the energy balance at land surface: instead, the same ground heat flux was applied as a boundary condition in both cases: with and without groundwater. In fact, when shallow groundwater affects skin temperature it affects all the components of the energy balance including ground heat flux. Secondly, it did not take into account the soil moisture effect: not only does shallow groundwater affect skin temper-ature directly by influencing heat flow within soil due to its distinctive thermal properties, but also it affects skin temper-ature indirectly by increasing soil moisture due to capillary rise and vapour transport within soil pores. This is apparent in Fig. 4, where soil moisture values increase with decreasing water table depth.
Soil moisture affects soil temperature in different and con-tradicting aspects. These effects fall into five categories: soil surface albedo, soil emissivity, evaporation, soil thermal con-ductivity and volumetric heat capacity. Firstly, increasing soil moisture decreases albedo which in turn increases the ab-sorbed radiation during day time; hence, this increases day-time temperature. Secondly, soil emissivity increases with increasing soil moisture, which in turn increases the upward emission thus decreases surface temperature. Thirdly, the in-crease of soil moisture inin-creases actual evaporation which accordingly decreases temperature. Fourthly, the increase of soil moisture increases soil thermal conductivity which eases heat transfer down and up within the surface soil and thereby decreases the absolute values of daily maximum and min-imum temperatures. Finally, the increase of soil moisture increases soil volumetric heat capacity which increases the energy required for raising or lowering soil temperature, and in a similar manner to that of the third effect, it decreases the absolute values of the daily maximum and minimum temper-atures.
On the last day of the experiment all locations were wetted until saturation. Consequently, the difference in soil moisture effects among the different locations was almost vanished. However, the relationship between soil temperature and wa-ter table depth (Tables 1 and 2, Figs. 2 and 3) was not affected considerably. This clarifies the direct effect of groundwater on skin temperature.
An unexpected phenomenon is worth mentioning here. Despite the general awareness that in daytime, wet soil must have lower temperature than dry one (due to its higher ac-tual evaporation and higher heat capacity), the correlation be-tween water table depth and maximum temperature was neg-ative (Figs. 2 and 3) and so was it for soil moisture (Fig. 4). That means the observed maximum temperature was higher in wetter soils. Although this is counterintuitive, this
obser-vation does agree with the simulation results in Fig. 6, which show warmer surface temperatures during the winter for the profile with shallow groundwater. This phenomenon would be sensible if we refer to evaporation and its cooling effect during winter as minimal.
In summary, we conclude that shallow groundwater affects skin temperature on yearly basis. As mentioned in many pre-vious studies it acts like a heat sink in summer and a heat source in winter. However, due to the complex processes that take place at land surface (radiations and fluxes interactions) its effect is not simple to describe. Many studies avoided this complexity by going with their measurements deep into the soil to correlate groundwater existence to soil temperature. And the other studies which dealt with skin temperature had different opinions and contradicting results. Through the re-sults of this study, we show that shallow groundwater has a clear impact on skin temperature. This impact will be useful in two fields: first, in utilizing thermal satellite remote sens-ing in groundwater studies and second, in land surface energy balance studies (land surface models and climate models).
In this study we show qualitatively that shallow ground-water affects skin temperature. Thus, we recommend setting a comprehensive numerical model that takes into account all the different factors which contribute to determining skin temperature and the exact magnitude of that effect.
Finally, we have noticed that the studies which utilized re-mote sensing for detecting depth to groundwater used a sin-gle scene (i.e. one reading). This study proves that a sinsin-gle scene/reading only is not sufficient, and recommends having a high temporal resolution of temperature measurements to detect shallow groundwater depth.
Acknowledgements. We are grateful to S. Salama, C. van der Tol, A. Gieske, Y. Zeng and W. Timmermans from the International Institute for Geo-information Science and Earth Observation, Enschede, the Netherlands, for helpful discussions. Also we appreciatively acknowledge the assistance in field measurements of T. Al Nayef and H. Al Eesa from the General Organization for Land Reclamation, Syria.
Edited by: J. Wen
References
AlKhaier, F.: Soil salinity detection using satellite remote sensing, M.S. thesis, International Institute for Geo-Information Science and Earth Observation, Enschede, The Netherlands, 70 pp., 2003. Birman, H.: Geothermal exploration for groundwater, Geol. Soc.
Am. Bull., 80(4), 617–630, 1969.
Cartwright, K.: Thermal prospecting for groundwater, Water Re-sour. Res., 4(2), 395–401, 1968.
Cartwright, K.: Tracing shallow groundwater systems by soil tem-peratures, Water Resour. Res., 10(4), 847–855, 1974.
physical Prospective, 5(3), 239–258, 1957.
Myers, V. I. and Moore, D. G.: Remote sensing for defining aquifers in glacial drift, Eighth International Symposium on Re-mote Sensing of Environment, volume 1, University of Michi-gan, 715–728, 1972.
Quiel, F.: Thermal/IR in geology, Photogram. Engi. Rem. Sens., 41(3), 341–346, 1975.
Wierenga, P. J. and Wit, C. T. De: Simulation of heat transfer in soils, Soil Sci. Soc. Am. J., 34, 845–848, 1970.