Brain Extraction and Fuzzy Tissue Segmentation in Cerebral
2D T1-Weigthed Magnetic Resonance Images
Bouchaib CHERRADI1, Omar BOUATTANE2, Mohamed YOUSSFI3 and Abdelhadi RAIHANI4
1
Faculty of Science and Technology, UFR: MCM&SCP, Hassan II University, Mohammedia, Morocco,
2
E.N.S.E.T Institute, Department of Informatics, Hassan II University, Mohammedia, Morocco,
3
Faculty of Science, Department of Information Processing, Mohammed V University, Rabat, Morocco.
4
Faculty of Science, Department of Information Processing, Hassan II University, Mohammedia, Morocco.
Abstract
In medical imaging, accurate segmentation of brain MR images is of interest for many brain manipulations. In this paper, we present a method for brain Extraction and tissues classification. An application of this method to the segmentation of simulated MRI cerebral images in three clusters will be made. The studied method is composed with different stages, first Brain Extraction from T1-weighted 2D MRI slices (TMBE) is performed as pre-processing procedure, then Histogram based centroids initialization is done, and finally the fuzzy c-means clustering algorithm is applied on the results to segment the image in three clusters. The introduction of this pre-processing procedure has been made in the goal to have a targeted segmentation method. The convergence speed for tissues classification has been considerably improved by avoiding a random initialization of the cluster centres and reduction of the volume of data processing.
Keywords: Clustering, Fuzzy c-means, histogram analysis, Brain Extraction, Image segmentation.
1. Introduction
Image segmentation is a key step toward image analysis and serves in the variety of applications including pattern recognition, object detection, and medical imaging [1], which is also regarded as one of the central challenges in image processing and computer vision. The task of image segmentation can be stated as the partition of an image into different meaningful regions with homogeneous characteristics using discontinuities or similarities of the image such as intensity, color, tone or texture, and so on [2]. Numerous techniques have been developed for image segmentation
IJCSI International Journal of Computer Science Issues, Vol. 8, Issue 3, No. 1, May 2011 ISSN (Online): 1694-0814
www.IJCSI.org 216
Intracranial segmentation commonly referred to as brain extraction or skull stripping, aims to segment the brain tissue (cortex and cerebellum) from the skull and non-brain intracranial tissues in magnetic resonance (MR) images of the brain. Brain extraction is an important pre-processing step in neuroimaging analyses because brain images must typically be skull stripped before other processing algorithms such as registration, or tissue classification can be applied. In practice, brain extraction is widely used in neuroimaging analyses such as multi-modality image fusion and inter-subject image comparisons [12]; examination of the progression of brain disorders such as Alzheimer’s Disease, multiple sclerosis and schizophrenia, monitoring the development or aging of the brain; and creating probabilistic atlases from large groups of subjects. Numerous automated skull-stripping methods have been proposed [13-18]. The rest of this paper is organised as follows: in the next section we describe our proposed method for Brain Extraction from 2D MRI slices as pre-processing procedure; in section 3 the standard clustering fuzzy c-means algorithm is sketched. Histogram based centroids initialization is presented in section 4. The global proposed method of segmentation is presented in section 5. In section 6 we present different results obtained with this method. Final conclusions and future works are discussed in section 7.
2. Pre-processing.
2.1. Filtering.
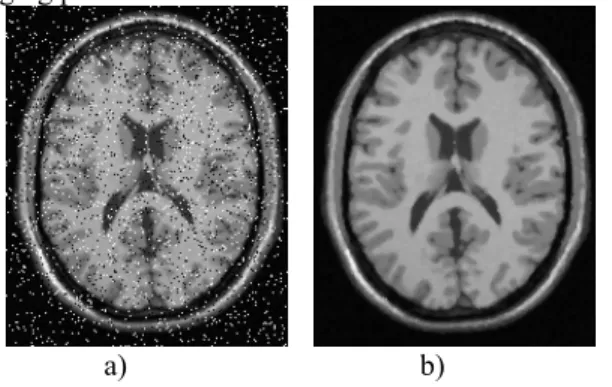
This pre-processing stage performs a non linear mapping of the grey level dynamics for the image. This transform consists in the application of a 3x3 median filter. The use of median filtering derives from the nature of the noise distribution in the MR images. The main source of noise in this kind of images is due to small density variations inside a single tissue which tend to locally modify the RF emission of the atomic nuclei during the imaging process.
a) b)
Figure 1: a) T1 MRI image with salt and paper noise, b) Median filtered image.
2.2. Brain Extraction: Threshold Morphologic Brain Extraction (TMBE).
The goal of this phase is to extract the brain from the acquired image: this will allow us to simplify the segmentation of the brain tissues. Our easy and effective method can be divided in five steps:
2.2.1 Thresholding.
This step is based on global binary image thresholding using Otsu's method [19]. Figure 2-b shows a result of this operation.
2.2.2 Greatest Connected Component Extraction.
A survey based on a statistical analysis of the existing connected components on the dilated image, permits to extract the region whose area is the biggest. Figure 2-c shows a result of this operation.
2.2.3 Filling the holes.
The remaining holes in the binary image obtained in step 2, containing the greatest connected component, are filled using morphologic operation consisting of filling holes in the binary image. A hole is a set of background pixels within connected component. The result of this operation is shown in figure 2-d.
2.2.4. Dilatation.
This morphologic operation consists of eliminating all remaining black spots on the white surface of the image. These spots are covered by the dilatation of the white parts. This carried out by moving a square structuring element of size (SxS) on binary image and applying logical OR operator on each of the (S2-1) neighbouring pixels (figure 2-e). In this paper we consider S=3.
2.2.5 ROI Extracting.
The region of interest is the brain tissues. To extract this region we use the AND operator between the original filtered image and the binary mask obtained in last step. The non-brain region is obtained by applying AND operator between the image in figure 2-a and the logical complement of mask image in figure 2-e.
a) b) c) d)
e) f) g) h)
Figure. 2: Brain Extraction steps on axial slice of number 84/181 in simulated data volume [21] with 5% uniform noise.
3. Standard FCM algorithm.
The fuzzy c-means (FCM) clustering algorithm was first introduced by DUNN [20] and later was extended by BEZDEK [8]. Fuzzy C-means (FCM) is a clustering technique that employs fuzzy partitioning such that a data point can belong to all classes with different membership grades between 0 and 1.
The aim of FCM is to find C cluster centers (centroids) in the data set X=x1x2xNRp that minimize the
following dissimilarity function:
c i n j x V m ij c i iFCM J u d i j
J 1 1 , 2 1 (1)
uij : Membership of data xj in the cluster Vi; Vi : Centroid of cluster i;
d(Vi,xj) : Euclidian distance between ith centroid (Vi) and jth
data point xj;
m є [1,∞] : Fuzzy weighting exponent (generally equals 2).
N: Number of data.
C: Number of clusters 2 ≤C < N. p: Number of features in each data.
With the constraints:
i j uij 0,1,, (2a)
C iij j N
u
1
,..., 1 ,
1 (2b)
C i N u N j
ij , 1,...,
0 1
(2c)To reach a minimum of dissimilarity function there are two conditions.
N j m ij N j j m ij iu
x
u
V
1 1 (3)
c k m kj ij ijd
d
u
1 ) 1 /( 21
(4)This iterative algorithm is in the following steps.
Step 0. Randomly initialize the membership matrix (U) according to the constraints of Equations 2a, 2b and 2c, Choose fuzzification parameter m
m
1
, Choose the number of clustersC, Choose the initial values of cluster centers
) 0 (
V
and threshold ε>0.At iteration Ni
{
Step 1. Calculate centroids vector (VNi) using
Equation (3).
Step 2. Compute dissimilarity function JNi using equation (1). If its improvement over previous iteration is below a threshold ε, Go to Step 4.
Step 3. Compute a new membership matrix (UNi)
IJCSI International Journal of Computer Science Issues, Vol. 8, Issue 3, No. 1, May 2011 ISSN (Online): 1694-0814
www.IJCSI.org 218
Step 4. Stop. }
4. Centroids initialization.
Clustering algorithms requires an initialisation of the clusters centres. Usually, this is randomly made. However, an adequate selection permits to improve the accuracy and reduces considerably the number of required iterations to the convergence of these algorithms.
The choice of the class number and initial correspondent centroids can be supervised or unsupervised. The supervised method consists in imposing a number and initial value of clusters according to the quantity of information that we want to extract from the image. The unsupervised method is based on the estimation of the number of clusters and initial cluster value in the image. Among the methods used in this domain we consider the histogram information analysis. This strategy consists in 4 stages:
Stage1: Histogram definition.
For image size S×T, at point (s, t), f (s, t) is the gray value with 0 ≤s ≤(S–1), 0≤t≤(T–1). Let H(g) denote the number of pixels having gray level g. Therefore, the histogram function can be written as:
10 1
0
)
)
,
(
(
H(g)
S
s T
t
g
t
s
f
(5)where g G, (g=0) = 1 and (g≠) = 0.
Stage 2: Histogram smoothing must be done to eliminate the parasitic peaks.
Stage 3: Detecting all local peaks.
Local peak at position g satisfy the condition H(g-1)<H(g) and H(g)>H(g+1).
Stage 4: Eliminating weak peaks.
Among the detected peaks, there are some ones with weak height, they represent small non significant regions, and to eliminate these peaks we introduce adaptedminimal amplitude Am.
The number of remaining peaks is the initial number of clusters C and correspondent’s gray levels gi are the initial centroids
V
(0)for the clustering algorithm.5. Proposed method.
The proposed segmentation method is summarized as follows:
Inputs : MRI Gray level image I (size S x T=N), minimal amplitude Am, fuzzification parameter m (
1
m
) and Threshold > 0.Outputs: Number of clusters C, Centroids of clusters vector V, correspondent fuzzy partition matrix U and segmented image Iseg.
Pre-processing:
Step 1. Noise removing: Median filter.
Step 2. Brain Extraction procedure (TMBE) (See section 2.2)
Step 3. Histogram computing for brain tissues using (5).
Step 4. Histogram Smoothing with appropriate 1D Gaussian filter.
Step 5. Detect all local peaks of the histogram. Step 6. Eliminate weak peaks. The peaks whose
the amplitude is < Am are eliminated. The number of remaining peaks is C and
correspondent gray levels are the initial centroids vector
V
(0).Fuzzy Clustering:
At iteration Ni do {
Step 7. Compute the membership function (UNi)
using (4).
Step 8. Compute the cluster centroids vector V(Ni) using (3).
Step 9. Compute objective function J(Ni) using (1).
Step 10. If abs(J(Ni)-J(Ni-1))< ε, go to step 11, otherwise, go to step 7.
}
Region Labelling:
Step 11: Defuzzification: Convert the final membership matrix U to crisp one using maximum procedure.
Step 12: Region labelling procedure to obtain Iseg.
6. Results and discussion.
The method was implemented in MATLAB 7.8, validated on synthesized images, and then several simulated cerebral MRI images of different modalities (T1, T2 and PD) from the classical simulated brain
database of McGill University [21] have been
experimented.
of different modalities of acquisition especially on healthy cerebral ones.
0 100 200 300 400 500 600 700 800 900
0 50 100 150 200 250
a)
0 50 100 150 200 250 300 0
100 200 300 400 500 600 700 800 900
b)
0 50 100 150 200 250 300 0
100 200 300 400 500 600 700 800 900
c)
0 50 100 150 200 250 300 0
100 200 300 400 500 600 700 800
d)
Figure. 3: Histogram analysis for centroids initialisation, a) Histogram of the image in figure 4-a, b) Smoothed histogram, c) Histogram of the extracted brain tissues in image of figure 4-d, d) Smoothed histogram.
a) b) c) d)
e) f) g) h)
k) l) m) n)
IJCSI International Journal of Computer Science Issues, Vol. 8, Issue 3, No. 1, May 2011 ISSN (Online): 1694-0814
www.IJCSI.org 220
e) Segmented image by the proposed method, f) Cerebrospinal fluid (CSF), g) Gray matter (GM) and h) White matter (WM). k) Truth Verity image, l), m) and n) Manual segmentation of the same brain tissues (Brainweb).
1 1.5 2 2.5 3 3.5 4 4.5 5 5.5 6
40 60 80 100 120 140 160 180
Ni
CSF GM WM
a)
1 1.5 2 2.5 3 3.5 4 4.5 5 5.5 6
2000 3000 4000 5000 6000 7000 8000 9000 10000
Ni
CSF GM WM
b)
1 1.5 2 2.5 3 3.5 4 4.5 5 5.5 6
1.76 1.78 1.8 1.82 1.84 1.86 1.88 1.9 1.92x 10
6
Ni
ObjFcn
c)
2 2.5 3 3.5 4 4.5 5 5.5 6
-14 -12 -10 -8 -6 -4 -2
0x 10 4
Ni
Err
d) Figure. 5: Dynamic of different clustering parameters for image in figure 4-d.
a) Centroids starting from (C1: CSF, C2: GM, C3: WM) = (53, 127, 173) as results of histogram analysis, b) Cardinality of each tissue, c) Values of objective function J(Ni), d) Values of Err (J(Ni)-J(Ni-1)).
The effectiveness of the method was tested on simulated MR images to extract the well known clusters (truth verity). Figure .3 shows the results of histogram analysis leading to a centroids initialisation of the extracted region of interest consisting of brain tissues that we want segment. It is about a sagital T1-weighted slice number 120/181 in sagital direction of TALAYRACH steriotaxic reference (volume of 181x217x181 voxels [21]).
Figure .4 shows an example of qualitative evaluation of our segmentation results with the provided manually segmentation results by the web site [21] corresponding to the same slice described above.
The segmentation aims to divide the image in three clusters: White matter (WM), gray matter (GM), and cerebrospinal fluid (CSF). The background pixels are removed from the image by thresholding (binarisation) before the clustering starts.
T1-weighted modality, that belong to the fastest MRI modalities available, are often preferred, since they offer
a good contrast between gray (GM) and white cerebral matter (WM) as well as between GM and cerebrospinal fluid (CSF). The advantages of using digital
simulated images rather than real image data for validating segmentation methods is that it include prior knowledge of the true tissues types.
pace of the curves present some anomalies that we have explain.
IJCSI International Journal of Computer Science Issues, Vol. 8, Issue 3, No. 1, May 2011 ISSN (Online): 1694-0814
www.IJCSI.org 222
0 5 10 15 20 25
60 80 100 120 140 160 180
Ni
CSF GM WM
a)
0 5 10 15 20 25
0 2000 4000 6000 8000 10000 12000
Ni
Card(CSF) Card(GM) Card(WM)
b)
0 5 10 15 20 25
1 2 3 4 5 6 7 8x 10
6
Ni
OblFcn
c)
2 4 6 8 10 12 14 16 18 20 22
-18 -16 -14 -12 -10 -8 -6 -4 -2
0x 10 5
Ni
Err
d)
Figure. 6: Dynamic of different clustering parametersfor image in figure 4-d.
a) Centroids starting from (C1:CSF, C2:GM, C3:WM) = (135.5, 136, 136.5) as manual initialisation, b) Cardinality of each tissue, c) Values of objective function J(Ni), d) Values of Err (J(Ni)-J(Ni-1)).
7. Conclusion and perspectives.
In this paper, we have presented a complete image classification method. This method was applied to the segmentation of the MRI images. The use of the histogram analysis instead of a random initialization leads to an important improvement in the choice of the centers of classes (70%).
Unlike other brain segmentation methods described in the literature, the one described in this dissertation is truly automatic because it does not require a user to determine image-specific parameters, thresholds, or regions of interest.
The automatic proposed method for extracting the brain from the T1-weighted MRI head scans is based on a hybrid processing techniques including the adaptive thresholding and morphology mathematical operators.
Qualitative evaluation of the obtained results for the proposed brain extraction method show that the proposed method achieves important performance with synthetic Brainweb data, however it will been experimented with real database and quantitatively
evaluated and compared with the well known brain extraction techniques in the literature.
In perspective we will also study and characterise the comportment of centroids dynamic, it will follows a mathematical function. In addition we will explain the comportment of the Err curve that is observed in many essays when the clusters initialisation is not adequately made (figure 6-d).
The robustness of the method up on the different artefacts usually present in magnetic resonance images such as noise and intensity inhomogeinity will be evaluated in future work. In other hand we are extending this method for 3D brain MRI and comparing it with some well known similar ones trough performance measure.
References
[1] J. Kim, J.W. Fisher, A. Yezzi, M.Cetin, A.S. Willsky, “A nonparametric statistical method for image segmentation using information theory and curve evolution”, IEEE Transactions on Image Processing
[2] G. Dong, M. Xie, “Color clustering and learning for image segmentation based on neural networks”, IEEE Transactions on Neural Networks 16(4), 2005, pp. 925–936.
[3] R.M. Haralick, L.G. Shapiro, “Image segmentation techniques”, Computer Vision, Graphics and Image Processing 29(1), 1985, pp. 100–132.
[4] N.R. Pal, S.K. Pal, “A review on image segmentation techniques”, Pattern Recognition
26(9), 1993, pp. 1277–1294.
[5] D.L. Pham, C. Xu, J.L. PRINCE, “Current methods in medical image segmentation”, Annual Review of Biomedical Engineering 2(1), 2000, pp. 315–338.
[6] WEINA WANG, YUNJIE ZHANG, YI LI,
XIAONA ZHANG, “The global fuzzy c-means clustering algorithm”, In Proceedings of the World Congress on Intelligent Control and Automation, Vol. 1, 2006, pp. 3604–3607.
[7] L.A. Zadeh, “Fuzzy sets” Information and Control, Vol. 8, 1965, pp. 338–353.
[8] J.C. Bezdek, “Pattern Recognition with Fuzzy Objective Function Algorithms”, Plenum Press, New York 1981.
[9] J.C. Bezdek, L.O. Hall, L.P. Clarke, “Review of MR image segmentation techniques using pattern recognition”, Medical Physics 20(4), 1993, pp. 1033–1048.
[10] N. Ferahta, A. Moussaoui, K. Benmahammed, V.Chen, “New fuzzy clustering algorithm applied to RMN image segmentation”, International Journal of Soft Computing 1(2), 2006, pp. 137–142.
[11] B.Cherradi and O.Bouattane. “Fast fuzzy segmentation method of noisy MRI images including special information”. In the proceeding of ICTIS’07 IEEE Morocco section, ISBN 9954-8577-0-2, Fez, 3-5 Mars 2007, p 461-464.
[12] R. P. Woods, M. Dapretto, N. L. Sicotte, A. W. Toga, and J. C. Mazziotta, “Creation and use of a Talairach-Compatible atlas for accurate, automated, nonlinear intersubject registration, and analysis of functional imaging data”, Human Brain Mapping, vol. 8, pp: 73-79, 1999.
[13] AM. Dale, B. Fischl, and MI. Sereno, “Cortical surface-based analysis. Segmentation and surface reconstruction”, NeuroImage, vol. 9, pp: 179-194, 1999.
[14] H. Hahn, and H-O. Peitgen, “The skull stripping problem in MRI solved by a single 3D watershed transform”, MICCAI, vol. 1935, pp: 134-143, 2000. [15] S. Sandor, and R. Leahy, “Surface-based labeling
of cortical anatomy using a deformable database”, IEEE Transactions on Medical Imaging, vol. 16, pp: 41-54, 1997.
[16] F. Segonne, A. M. Dale, E. Busa, M. Glessner, D. Salat, H. K. Hahn, and B. Fischl, “A hybrid approach to the skull stripping problem in MRI”, NeuroImage, vol. 22, pp :1060-75, 2004.
[17] S. M. Smith, “Fast robust automated brain extraction”, Human Brain Mapping, vol. 17, pp: 143-55, 2002.
[18] D.W. Shattuck, S.R. Sandor-Leahy, K.A. Shaper, D.A. Rottenberg, R.M. Leahy, “Magnetic resonance image tissue classification using a partial volume model”. NeuroImage. 13 (5), 856–876. 2001.
[19] N. Otsu, “A Threshold Selection Method from Gray-Level Histograms”. IEEE Transactions on Systems, Man, and Cybernetics, Vol. 9, No. 1, 1979, pp. 62-66.
[20] J.C. Dunn, “A fuzzy relative of the ISODATA process and its use in detecting compact well-separated clusters”, Journal of Cybernetics 3(3), 1973, pp. 32–57.
[21] http://www.bic.mni.mcgill.ca/brainweb
Bouchaib CHERRADI has born in 1970 at El JADIDA, Morocco. Received the B.S. degree in Electronics in 1990 and the M.S. degree in Applied Electronics in 1994 from the ENSET Institute, Mohammedia, Morocco. He received the DESA diploma in Instrumentation of Measure and Control from the University of EL JADIDA in 2004. He is now a Ph.D. student in MCM&SCP laboratory, Faculty of Science and Technology, Mohammedia. His research interests include Massively Parallel Architectures, Cluster Analysis, Pattern Recognition, Image Processing and Fuzzy Logic.
Omar BOUATTANE has born in 1962 at FIGUIG, south of Morocco. He has his Ph.D. degree in 2001 in Parallel Image Processing on Reconfigurable Computing Mesh from the Faculty of Science Ain Chock, CASABLANCA. He has published more than 30 research publications in various National, International conference proceedings and Journals. His research interests include Massively Parallel Architectures, cluster analysis, pattern recognition, image processing and fuzzy logic.
Mohamed YOUSSFI has born in 1970 at OUARZAZATE, Morocco. He is now a teacher of computer science and researcher at
the University Hassan II Mohammedia, ENSET Institute.
His research is focused on parallel and distributed computing technologies, Grid Computing and Middleware’s. Received the B.S. degree in Mechanics in 1989 and the M.S. degree in Applied Mechanics in 1993 from the ENSET Institute, Mohammedia, Morocco. He received the DEA diploma in Numeric Analysis from the University of RABAT in 1994. He received the Doctorate diploma in Computing and Numeric Analysis from the University MOHAMMED V of RABAT in 1996.
IJCSI International Journal of Computer Science Issues, Vol. 8, Issue 3, No. 1, May 2011 ISSN (Online): 1694-0814
www.IJCSI.org 224
![Figure .4 shows an example of qualitative evaluation of our segmentation results with the provided manually segmentation results by the web site [21] corresponding to the same slice described above](https://thumb-eu.123doks.com/thumbv2/123dok_br/18415632.360302/6.918.117.794.134.613/qualitative-evaluation-segmentation-provided-manually-segmentation-corresponding-described.webp)
