www.geosci-model-dev.net/3/205/2010/
© Author(s) 2010. This work is distributed under the Creative Commons Attribution 3.0 License.
Geoscientific
Model Development
Incremental testing of the Community Multiscale Air Quality
(CMAQ) modeling system version 4.7
K. M. Foley1, S. J. Roselle1, K. W. Appel1, P. V. Bhave1, J. E. Pleim1, T. L. Otte1, R. Mathur1, G. Sarwar1, J. O. Young1, R. C. Gilliam1, C. G. Nolte1, J. T. Kelly1,*, A. B. Gilliland1, and J. O. Bash1
1Atmospheric Modeling and Analysis Division, National Exposure Research Laboratory, Office of Research and
Development, US Environmental Protection Agency, RTP, NC, USA
*now at: Regional Air Quality Modeling Section, Planning and Technical Support Division, Air Resources Board,
California Environmental Protection Agency, Sacramento, CA, USA
Received: 29 September 2009 – Published in Geosci. Model Dev. Discuss.: 29 October 2009 Revised: 9 February 2010 – Accepted: 8 March 2010 – Published: 26 March 2010
Abstract. This paper describes the scientific and structural updates to the latest release of the Community Multiscale Air Quality (CMAQ) modeling system version 4.7 (v4.7) and points the reader to additional resources for further details. The model updates were evaluated relative to observations and results from previous model versions in a series of sim-ulations conducted to incrementally assess the effect of each change. The focus of this paper is on five major scientific up-grades: (a) updates to the heterogeneous N2O5
parameteriza-tion, (b) improvement in the treatment of secondary organic aerosol (SOA), (c) inclusion of dynamic mass transfer for coarse-mode aerosol, (d) revisions to the cloud model, and (e) new options for the calculation of photolysis rates. Incre-mental test simulations over the eastern United States during January and August 2006 are evaluated to assess the model response to each scientific improvement, providing explana-tions of differences in results between v4.7 and previously re-leased CMAQ model versions. Particulate sulfate predictions are improved across all monitoring networks during both sea-sons due to cloud module updates. Numerous updates to the SOA module improve the simulation of seasonal variability and decrease the bias in organic carbon predictions at urban sites in the winter. Bias in the total mass of fine particu-late matter (PM2.5) is dominated by overpredictions of
un-speciated PM2.5(PMother) in the winter and by
underpredic-tions of carbon in the summer. The CMAQv4.7 model re-sults show slightly worse performance for ozone predictions.
Correspondence to: K. M. Foley
However, changes to the meteorological inputs are found to have a much greater impact on ozone predictions compared to changes to the CMAQ modules described here. Model updates had little effect on existing biases in wet deposition predictions.
1 Introduction
As part of the regulatory decision-making process for air quality management, the United States Environmental Pro-tection Agency (USEPA) relies on numerical model simula-tions of the atmospheric chemistry and transport of airborne emissions and the resulting pollutant concentrations (Scheffe et al., 2007). Models, such as the Community Multiscale Air Quality (CMAQ) model (Byun and Schere, 2006), provide valuable information about the potential effects of emission control strategies (e.g., Fann et al., 2009) and changing cli-mate (e.g., Nolte et al., 2008b). Such modeling studies are used to facilitate air quality management decisions that po-tentially have an important impact on human and ecosystem health. Hence, the air quality modeling community needs to continually update operational modeling systems with state-of-the-science knowledge of the atmospheric processes af-fecting air pollution levels in the United States.
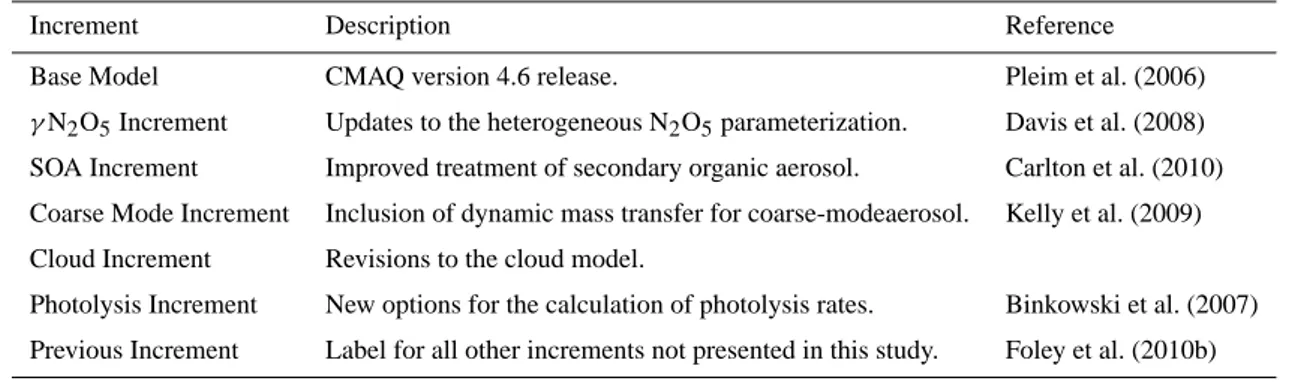
Table 1. Summary of 5 scientific and structural changes to CMAQv4.7 discussed in Sect. 4.
Increment Description Reference
Base Model CMAQ version 4.6 release. Pleim et al. (2006)
γN2O5Increment Updates to the heterogeneous N2O5parameterization. Davis et al. (2008)
SOA Increment Improved treatment of secondary organic aerosol. Carlton et al. (2010)
Coarse Mode Increment Inclusion of dynamic mass transfer for coarse-modeaerosol. Kelly et al. (2009)
Cloud Increment Revisions to the cloud model.
Photolysis Increment New options for the calculation of photolysis rates. Binkowski et al. (2007)
Previous Increment Label for all other increments not presented in this study. Foley et al. (2010b)
concentrations, each new release requires a comprehensive evaluation to establish model credibility for a wide range of applications (e.g. Mebust et al., 2003; Eder and Yu, 2006; Appel et al., 2007, 2008). Most recently, the CMAQ model-ing system version 4.7 (v4.7) has been tested and evaluated against observations and was publicly released in December 2008 (http://www.cmaq-model.org/).
The scientific upgrades in v4.7 include the added capa-bility to use meteorological input fields from the Weather Research and Forecasting (WRF; Skamarock et al., 2008) model, major changes to the treatment of aerosol, improve-ments in the resolved and convective cloud modules, updates to the chemistry modules based on recent field and modeling studies, and new options for processing emissions and calcu-lating dry deposition velocities during the model execution (i.e., “in-line”). Rather than updating the CMAQ modeling system with all of these changes at one time, each major sci-entific update in this release was incrementally tested for two month-long periods (January and August 2006) and evalu-ated against observations. This approach, although time and resource intensive, allowed for a diagnostic evaluation of the individual model updates. Incremental testing showed the ef-fect of each scientific improvement on the simulated fields of various pollutants and provided an opportunity for a clear ex-planation of differences between the results from current and previous model versions. This systematic approach also fa-cilitated quality assurance and quality control of model sim-ulations, input data, and implementation.
The following section provides a brief description of the major scientific and structural improvements included in CMAQv4.7. The model configuration and observational data sets used in the model evaluation are provided in Sect. 3. The evaluation is then presented in two parts. Section 4 docu-ments the evaluation of five specific changes that were iso-lated as part of the overall incremental testing of the model: (a) changes to the heterogeneous N2O5 parameterization,
(b) improvement in treatment of secondary organic aerosol (SOA), (c) inclusion of dynamic mass transfer for coarse-mode aerosol, (d) revisions to the cloud coarse-model, and (e) new
options for the calculation of photolysis rates. Table 1 lists these increments and the labeling scheme used throughout the paper to facilitate the discussion of the differences be-tween each model update. These five increments were cho-sen as the focus of this paper because they reprecho-sent a fun-damental change from the previously released model version and had the propensity to impact model performance for cri-teria pollutants. The second portion of the evaluation, pre-sented in Sect. 5, summarizes the overall change in model performance of CMAQv4.7 compared to the previously re-leased version. Finally, Sect. 6 provides a discussion of fu-ture model development needs.
2 Review of scientific and structural upgrades in CMAQv4.7
2.1 Meteorological input model
The CMAQ system generally relies upon meteorological fields that can be generated from well-tested, state-of-the-science, community-based meteorological models. Previ-ously released versions of CMAQ were tailored toward using the fifth-generation Pennsylvania State University/National Center for Atmospheric Research (NCAR) Mesoscale Model (MM5; Grell et al., 1994) as the source of input meteorolog-ical fields. In CMAQv4.7, the system was expanded to use meteorological fields from the WRF model. Although the WRF model has been available from NCAR as a “replace-ment” for MM5 for several years, scientific options that are critical for retrospective air quality simulations were lacking from the WRF model. For example, the use of continuous data assimilation via Newtonian relaxation (i.e., nudging) in the meteorological model has been shown to improve retro-spective simulations with the air quality model (Otte, 2008a, b). In addition, the Asymmetric Convective Model version 2 (ACM2) for the planetary boundary layer (PBL) addresses atmospheric issues that are particularly important for near-surface chemical transport modeling (Pleim, 2007), and it is used in both the meteorological and chemical transport mod-els to maximize physical consistency. Also, the Pleim-Xiu land-surface model (PX LSM) (Xiu and Pleim, 2001; Pleim and Xiu, 2003; Pleim and Gilliam, 2009) was developed to accurately model surface heat and moisture fluxes from soil and vegetation and provide key parameters for chemical dry deposition. Nudging, the ACM2, and the PX LSM have all been available in MM5 for several years and were deemed critical for CMAQ simulations. These three critical features are all available in the WRF public release beginning with version 3.0.
CMAQ’s Meteorology-Chemistry Interface Processor (MCIP; Otte and Pleim, 2009) was also upgraded to support output from the WRF model. MCIP’s functions are to ingest the meteorological model fields, recast information in forms conforming to CMAQ’s generalized coordinate formulation, diagnose additional atmospheric fields, and generate output in a format that can be used by the CMAQ system. Signif-icant changes were required to MCIP to ingest and prepare the WRF model output for the CMAQ system, since the WRF model uses different state equations, fields, file formats, and vertical coordinate systems than MM5. In addition, the com-putation of dry deposition velocities that was previously cal-culated in MCIP was moved to the CMAQ chemical transport model (CCTM) as part of the new “in-line” code structure for surface fluxes in CMAQ (see Sect. 2.5). MCIP version 3.4.1 was released as a companion to the CMAQv4.7 soft-ware package (http://www.cmaq-model.org).
In two companion studies, multiple MM5 and WRF model simulations were performed for winter and summer months to examine the sensitivity of CMAQ model predictions to the output from each meteorological model. Gilliam and Pleim (2009) compared MM5 and WRF predictions for
2-m temperature, 2-m mixing ratio, 10-m winds and PBL features to observed meteorological data. Appel et al. (2009) evaluated CMAQ output for ozone, PM2.5species, and wet
deposition using MM5-based and WRF-model-based mete-orology inputs. While MM5 and WRF error statistics that consider the entire model domain are comparable, there are regional differences in meteorology that are also reflected in the air quality model, as noted by Appel et al. (2009). Although MM5 and WRF do not produce the exact same model results, these studies demonstrated that the WRF-model-based simulations generated comparable quality me-teorological fields and air quality fields to the MM5-based simulations. The model evaluation provided confidence in the use of WRF model outputs for CMAQ simulations. In addition, the comparable performance of CMAQ when using either MM5-based or WRF-model-based meteorology fields demonstrated the versatility of the CMAQ system.
2.2 Scientific improvements in the CMAQv4.7 aerosol treatment
Changes within the CMAQ aerosol module can be divided into three main increments: updates to the heterogeneous N2O5 hydrolysis parameterization, improved treatment of
secondary organic aerosol (SOA) formation, and a new treat-ment of gas-to-particle mass transfer for coarse aerosol. Dur-ing winter months, model predictions of particulate nitrate are sensitive to the nighttime hydrolysis of N2O5on particle
surfaces (Dentener and Crutzen, 1993). The probability of this heterogeneous reaction (γN2O5)in CMAQv4.6 was pa-rameterized in part using a temperature- and RH-dependent equation published by Evans and Jacob (2005). Lab data in-dicate thatγN2O5 decreases with increased temperature; how-ever this relationship was rhow-eversed in the published formula due to a typographical error (M. Evans, personal communi-cation, 2006). After the release of v4.6, we discovered this typographical error had been copied directly into the CMAQ code (Davis et al., 2008). Correction of the error degraded the CMAQ predictions of wintertime nitrate, which subse-quently motivated the need for an improved treatment of
γN2O5. In CMAQv4.7,γN2O5 has been updated based on the parameterization given in Appendix A of Davis et al. (2008). This new parameterization is based on a more comprehen-sive set of laboratory data and is now a function of tempera-ture, RH and inorganic particle composition. See Davis et al. (2008) for a complete description of the parameteriza-tion and comparisons with laboratory and ambient data. The evaluation of this update (referred to asγN2O5Increment) is
given in Sect. 4.1.
formation pathways to CMAQ would mitigate this bias (Mor-ris et al., 2006). In addition, USEPA was keenly interested in quantifying the potential health benefit from reducing the aromatic content of gasoline through the use of ethanol blends (EPA, 2009). This motivated a need to incorporate the most up-to-date scientific information on aromatic SOA for-mation into CMAQ v4.7. The new pathways in v4.7 include SOA formation from isoprene, sesquiterpenes, benzene, gly-oxal, and methylglyoxal. The revised model treats the acid-catalyzed enhancement of SOA mass, oligomerization reac-tions, aqueous-phase SOA formation, and NOX-dependent
SOA yields from aromatic compounds. Enthalpies of va-porization for each SOA type and ratios of SOA mass to organic carbon have been revised based on recent labora-tory experiments (Offenberg et al., 2006; Kleindienst et al., 2007). Each gas-phase chemical mechanism released with the CMAQ model has been revised to include explicit reac-tions for the oxidation of benzene and sesquiterpenes. As part of this effort, the Biogenic Emissions Inventory System (BEIS) has been revised to compute emissions of sesquiter-penes as a function of temperature and plant functional type. New speciation files have been developed to distinguish the emissions of benzene from other aromatic VOCs, though fu-ture applications of the model may use benzene emissions directly from the hazardous air pollutants (HAPs) inventory. Detailed descriptions of the SOA updates are reported else-where (Carlton et al., 2008, 2009, 2010). Model results from this increment (SOA Increment) are evaluated in Sect. 4.2.
The third update to the aerosol module adds a new treat-ment of gas-to-particle mass transfer for coarse particles and updates the in-line treatment of sea-salt emissions. In ear-lier CMAQ model versions, the coarse particle mode was treated as chemically inert, with a fixed geometric standard deviation. Emission fluxes from the coastal surf zone were set equal to those from the open ocean. These simplifica-tions hindered our ability to simulate aerosol composition in coastal urban areas and nutrient deposition to sensitive ecosystems (Nolte et al., 2008a). The new coarse-particle treatment in CMAQv4.7 allows sulfuric acid to condense on the coarse mode and allows semi-volatile inorganic species (ammonia, nitric acid, and hydrochloric acid) to condense and evaporate from the coarse mode. The water content of coarse particles is now determined by equilibrium with am-bient RH and the size distribution of coarse particles is al-lowed to broaden and narrow as a result of microphysical processes. As in previous CMAQ model versions, the fine particle modes are assumed to reach equilibrium with the gas phase instantaneously. In contrast, dynamic mass trans-fer is simulated for the coarse mode because large particles are often out of equilibrium with the gas phase (Meng and Seinfeld, 1996). As a result, important aerosol processes such as the replacement of chloride by NO−3 in mixed ma-rine/urban air masses can now be simulated. In conjunc-tion with this update, the CMAQ input file OCEAN 1, has been enhanced to better allocate the fractions of each grid
cell that are covered by land, open ocean, and coastal surf zone (see Foley et al., 2010a for further details). Emissions of sea salt from the coastal surf zone are then calculated by scaling up the open-ocean source function to mimic the flux from an area that is covered entirely by whitecaps. De-tailed descriptions of these updates are provided by Kelly et al. (2009). Changes to coarse particle treatment are included in the Coarse Mode Increment and are evaluated in Sect. 4.3. 2.3 Improvements to the CMAQv4.7 cloud model
Updates were made to two components of the cloud model in CMAQ (cloud acm): the grid-resolved cloud model and the sub-grid convective cloud model. The main update to the resolved cloud model was a correction to the vertical alloca-tion of the precipitaalloca-tion flux. To compute wet deposialloca-tion of pollutants, the resolved cloud model estimates which model layers contributed to the precipitation. CMAQ uses a sim-ple algorithm to allocate precipitation amounts to individual layers based on a normalized profile of precipitating hydrom-eteors (rain, snow, and graupel). In the previously released versions of the CMAQ model, the precipitation flux was allo-cated into vertical model layers without consideration of the layer thickness. This had the effect of removing too much pollutant mass from thin layers and removing too little from the thick layers. In the CMAQv4.7 revised calculation, the precipitation flux for each layer is computed as a function of the non-convective precipitation rate, the sum of hydrometers and the layer thickness.
Sensitivity experiments identified several shortcomings in the sub-grid convective cloud model related to its application in areas with higher elevation (e.g., western United States) and in the selection of model vertical resolution. These is-sues were primarily a problem for SO24− predictions. One set of experiments using 14, 24, and 34 layers showed that the model produced less ground-level SO24−with increased vertical resolution during the summer. To address problems with the model in high elevation areas, the maximum al-lowable height for the source level of the convective parcel was changed from a fixed atmospheric pressure (650 hPa) to 3 km above ground level (a.g.l.). The change was made to account for lower surface pressure in regions of high eleva-tion. Another change was made to non-precipitating clouds by limiting their cloud tops to 3 km above cloud base rather than the previous 3 km a.g.l. This change affects cloud de-velopment in higher elevations where cloud bases are often much higher than in other areas.
erroneously assign the cloud top to the first layer above the cloud base. The result was unreasonably large differences in model simulations that used different vertical resolutions (e.g., 14 vs. 34). The perturbation temperature was removed from this calculation providing a greater degree of consis-tency among model runs using different vertical resolutions, which was confirmed by tests with 14, 24, and 34 vertical layers.
The treatment of sub-grid non-precipitating (NP) clouds was modified to allow NP clouds to exist only when the di-agnosed lifting condensation level (LCL) is within the PBL. Previously, NP clouds were permitted when the cloud base was below 1.5 km a.g.l. This change is consistent with the idea that NP convective clouds have their roots in a turbulent boundary layer where buoyant air parcels can originate. The effect of this change is to greatly limit the occurrence of NP convective clouds at night over land and to sometimes en-hance occurrence of NP convective clouds during afternoons when PBL heights can exceed 1.5 km a.g.l.
Another significant change was an improvement in pro-cess integration for convective clouds. Previously, convec-tive clouds were modeled using a fixed time-step of one hour, regardless of horizontal grid resolution. For coarse grid res-olutions (e.g.,∼80 km), the assumption of a sub-grid cloud parameterization on a one hour timescale may be reasonable, however, for finer grids (e.g., 12 km), horizontal advection may transport pollutants across several grid cells during the period of one hour, creating inconsistencies in how the cloud processes integrate with the other modeled processes. In ver-sion 4.7, the convective cloud model was revised to integrate convective clouds on the same process synchronization time-step used by the other process modules of emissions, advec-tion, turbulent mixing, and chemistry.
In addition to the cloud physics changes, cloud chemistry was also updated. Organic species and oxidation reactions were incorporated into the aqueous chemical mechanism (Carlton, et al., 2008). Henry’s Law constants for sev-eral species (O3, NO3, hexane, octane, nonane, isoprene
and methanol) were updated following an extensive litera-ture review that is summarized in the CMAQ v4.7 release notes (http://www.cmaq-model.org/). Although the multiple changes to the cloud module were tested over several incre-ments, they are evaluated in Sect. 4.4 as a single incremental change (Cloud Increment) in order to simplify the presenta-tion of the results.
2.4 Improvements in atmospheric chemistry
This section outlines changes in CMAQv4.7 chemistry as-sociated with nitrous acid (HONO), chlorine (Cl2) and
mer-cury (Hg). Earlier versions of CMAQ significantly under-estimated ambient HONO mixing ratios which also exhib-ited a diurnal profile opposite to that noted in limexhib-ited avail-able measurements. HONO is the largest source of OH rad-icals (which controls oxidation) during the morning hours.
Changes were made to the chemistry module and corre-sponding emissions inputs to CMAQ to improve the predic-tion of HONO in v4.7. The first change was in the specia-tion of NOxemissions from motor vehicles. An important
source of HONO in the atmosphere is mobile source emis-sions; however, in previous versions of the Sparse Matrix Operator Kernel Emission (SMOKE) processor, NOx
emis-sions from motor vehicles were speciated only into nitric ox-ide (NO) and nitrogen dioxox-ide (NO2). In SMOKE version
2.5, NOxemissions are speciated into NO, NO2, and HONO.
Emissions of NO2are appropriately reduced so that the sum
of NO, NO2, and HONO equals to NOx. The new speciation
uses a HONO/NOxratio of 0.008 based on measurements of
HONO emissions in a road tunnel study (Kurtenbach et al., 2001). Recent studies suggest that heterogeneous reactions (involving NO2 and H2O) on aerosol and ground surfaces
can produce HONO in the atmosphere. The incorporation of these emissions and production pathways in CMAQv4.7 now results in improved representation of both the diurnal variability and the magnitude of predicted ambient HONO mixing ratios and its impact on atmospheric photochemistry (Sarwar et al., 2008). Because HONO observations for the time period of this study were not readily available, and the relative impacts of this change on ozone and PM predictions were small, no increment is presented in the paper.
A chlorine mechanism was implemented in CMAQ for use with the 2005 version of the Carbon Bond (CB05) mecha-nism (Yarwood et al., 2005). Recent studies suggest that an-thropogenic and sea-salt derived chlorine emissions can af-fect O3in some areas in the United States (Simon et al., 2009;
Sarwar et al., 2007). The USEPA has developed a National Emissions Inventory (NEI) for HAPs that includes estimates of anthropogenic chlorine emissions. Chlorine chemistry has been combined with the CB05 mechanism and is used as a base mechanism in the CMAQ model. In addition to the base model, CMAQv4.7 also includes an optional multipollutant version (Roselle et al., 2007) that simulates O3, PM, Hg, and
other HAPs in a single model configuration. The multipollu-tant model replaces the stand-alone model versions for air toxics (Hutzell and Luecken, 2008; Luecken et al., 2006) and Hg (Bullock and Brehme, 2002) from previous model releases.
2.5 In-line processing options
component of a meteorology model (e.g., WRF), enabling direct emissions modulation by the most recently computed meteorological variables. Additionally, the in-line compu-tation of plume-rise, significantly reduces the disk space requirements during model execution because the large 3-D emission files can be substituted with 2-3-D files.
The new version of the CMAQ model now also calcu-lates dry deposition velocities in-line by default, obviating the need for the MCIP to provide these input data. As with the emissions, deposition velocities are meteorologically-modulated at the synchronization (chemistry) time-step rather than being linearly time-interpolated within each sim-ulation hour. More importantly, this approach now provides a means to consistently formulate and simulate bi-directional pollutant fluxes to and from the surface.
2.6 Research options
This section describes research options available in the CMAQv4.7 release. While these options are considered “beta” versions, they are being provided to the community for testing and experimentation. One option for calculating photochemical rate constants is included in the incremental tests as a demonstration of capability.
Within the standard CMAQ photolysis module, clear-sky photolysis rates at specific altitudes, latitudes, and hour an-gles are computed offline with the photolysis rate prepro-cessor JPROC and read into the model as a look-up table. The clear-sky photolysis rates are then interpolated to model grid cells at specified time-steps and also adjusted for the presence of cloud cover. Two new options were included in CMAQv4.7 for computing photochemical rate constants. One option utilizes satellite-derived cloud information to ad-just photolysis rates (Pour-Biazar et al., 2007). Predict-ing the location and amount of cloud cover has historically been one of the most difficult problems in numerical weather prediction and air quality modeling. Using cloud informa-tion derived from satellites should give a better represen-tation of the cloud fields. At present, data from the Geo-stationary Operational Environmental Satellite (GOES) are archived for a limited area and time periods and may be ob-tained from the National Aeronautics and Space Administra-tion (NASA)/NaAdministra-tional Space Science and Technology Cen-ter’s Satellite Assimilation website (http://satdas.nsstc.nasa. gov/data.html). In addition, the preprocessing software is also available from the NASA website. An updated version of the preprocessing software is being developed, which re-grids satellite data to the CMAQ modeling grid domain us-ing the Spatial Allocator Tool (available from the Commu-nity Modeling and Analysis (CMAS) center, http://www.ie. unc.edu/cempd/projects/mims/spatial/). An incremental test using the satellite data revealed problems in the satellite re-gridding/preprocessing software, which are currently being addressed. Because of this problem, no analysis of this in-crement is presented here.
The second option for photolysis rate calculation is an in-line module developed by Binkowski et al. (2007). The mod-ule computes photolysis rates using chemical/aerosol and meteorological information available for all modeled grid cells and layers; this enhancement allows for investigation of potentially important impacts of scattering and absorb-ing aerosols in modulatabsorb-ing photolysis rates and atmospheric photochemistry regulating the formation of secondary air pollutants (cf., Dickerson et al., 1997). Some additional work is needed to implement temperature variation of the ab-sorption cross section and quantum yield data for the CB05 and SAPRC99 (Carter, 2000) chemical mechanisms into the module. Evaluation of the CMAQ model using the in-line photolysis option is presented in Sect. 4.5 as the Photolysis Increment. Both photolysis options were released as “beta” versions because there is ongoing development to improve the software codes, and, therefore, neither option has been implemented in the default configuration of the model.
Research options were also included in CMAQv4.7 for bidirectional surface exchange of ammonia (NH3) and Hg.
Emissions of NH3 from natural and managed agricultural
surfaces and emissions of Hg through natural processes are controlled by environmental meteorological, physical and chemical parameters that can be meaningfully described in an air-surface exchange module (Sutton et al., 1998; Graydon et al., 2006). Mechanistic models of bidirectional exchange for NH3and Hg were developed based on the “canopy
com-pensation point” concept (Sutton et al., 1998). A “canopy compensation point” is defined as a function of the land cover type, ambient temperature, and partitioning of NH3
and Hg between atmospheric, apoplastic and vegetation sur-face compartments. Details of the implementation of the Hg bidirectional model are given in Bash (2010). The bidirec-tional mercury exchange option is available for the multi-pollutant version of CMAQ. Bidirectional surface exchange options are intended to replace NH3and Hg emissions from
natural surfaces, currently estimated a priori and included in the emissions inventory, and thus were not included in the incremental tests to avoid the double counting of inline emis-sion estimates.
The following two sections present the description of the case study used to evaluate the main scientific updates to the CMAQv4.7 model and the results from each model change. Evaluation results are based on comparisons to observations as well as previous model versions.
3 Modeling approach and observational data sets
(∼35 m thick) are used for comparison with observations. The CB05 chemical mechanism with chlorine chemistry was used in the model simulations. In order to test the model under seasonal extremes, a winter month (January) and sum-mer month (August) from 2006 were simulated; in each case a 3-day model spin-up was used. All of the CMAQ simu-lations described here use the meteorological fields derived from the WRF model. Specifics on the configuration options used for the WRF model simulation can be found in Appel et al. (2009) and Gilliam and Pleim (2010). Boundary and initial conditions were specified from the output of simula-tions with 36 km by 36 km horizontal grid spacing across the entire continental United States for the same two months.
Emission inputs for these simulations were based on the USEPA NEI for 2001 (http://www.epa.gov/ttn/chief/net/ critsummary.html) and then projected to 2006 for select sec-tors. The raw emissions data were processed to generate gridded, hourly emissions fields using the latest released version of the SMOKE processor, version 2.5 (http://www. smoke-model.org/version2.5/html/). To estimate emissions for January and August 2006, the 2001 NEI was updated with observed 2006 point source emissions from electric generat-ing units (EGUs) equipped with Continuous Emission Moni-toring Systems (CEMS). Biogenic emissions were processed using the BEIS version 3.13 (Vukovich and Pierce, 2002; Schwede et al., 2005) and supplemented with sesquiter-pene fluxes that were calculated using emission factors from the Model of Emission of Gases and Aerosols from Nature (MEGAN; Guenther et al., 2006) (see Foley et al., 2010a for further details). Mobile source emissions were estimated us-ing the Mobile6 emission model (http://www.epa.gov/otaq/ m6.htm) within SMOKE. Both biogenic and mobile emis-sions were modulated based on hourly meteorological inputs from WRF.
Simulations from the CMAQ model are paired in time and space with observations from several national monitoring networks. These data include observations of O3 obtained
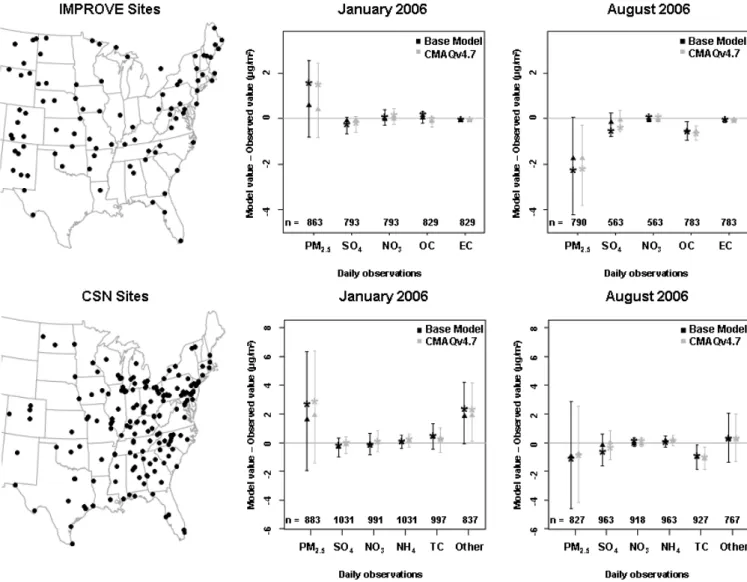
for EPA’s Air Quality System (AQS; http://www.epa.gov/ ttn/airs/airsaqs/); observations of aerosol particulate mat-ter from the Inmat-teragency Monitoring of PROtected Environ-ments (IMPROVE; http://vista.cira.colostate.edu/improve/) network, the Chemical Speciation Network (CSN; previ-ously called the Speciation Trends Network, STN), and the Clean Air Status and Trends Network (CASTNet; http: //www.epa.gov/castnet/); observations of coarse particulate matter from the Southern Aerosol Research and Character-ization Study (SEARCH; http://www.atmospheric-research. com/studies/SEARCH/index.html); and observations of pre-cipitation, SO24−, NO−3 and ammonium (NH+4) wet depo-sition from the National Atmospheric Depodepo-sition Program (NADP; http://nadp.sws.uiuc.edu/) network. Observations from the AQS are hourly values, observations from the SEARCH network are daily average values, CSN and IM-PROVE network observations are daily average values avail-able every third day, CASTNet observations are weekly
average values, and the NADP network observations are monthly accumulated values. Additional details about the observation networks and how the data are paired with the CMAQ model predictions are available in Appel et al. (2007, 2008).
4 Evaluation of major scientific increments
The following section presents model evaluation results from four of the major scientific upgrades and one research op-tion in CMAQv4.7 listed in Table 1. Addiop-tional incremental changes were tested that are not presented here. For clarity of presentation, “previous increment” is used as a label for some model-to-model comparisons to avoid additional nota-tion for changes that are not the focus of this analysis (see Foley et al., 2010b for further details). Evaluation of each increment involved screening the impact of the change on several primary and secondary pollutants for quality control purposes. Here, we focus on the pollutant changes that are most relevant to the individual increment, using available ob-servations and comparison to previous model versions. The concluding section provides a more general overview of the overall change in model performance for the set of pollutants most critical for informing air quality management decisions. 4.1 New parameterization for heterogeneous
reaction probability
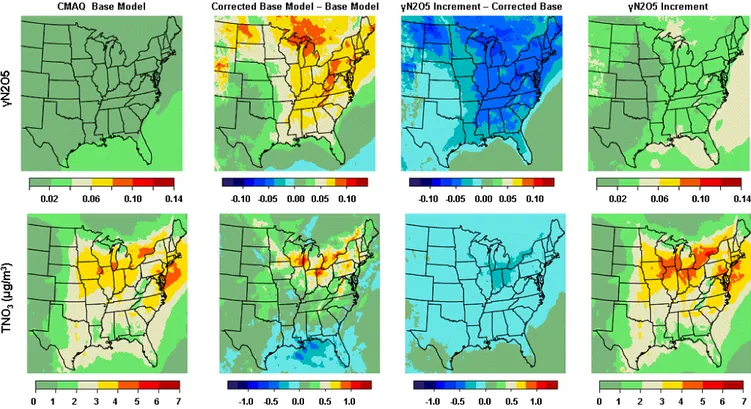
To understand the impact of correcting the error in the pa-rameterization of γN2O5 in the CMAQ aerosol model (see Sect. 2.2), the difference between model output from the base and the corrected base model has been included in Fig. 1. Average nighttimeγN2O5 values in January increase drasti-cally over much of the region, resulting in increases in TNO3
(NO−3 + nitric acid (HNO3)) concentrations up to 1.22 µg/m3,
particularly in the Northeast and Midwest regions (compare first and second column of Fig. 1).
The effect of revising theγN2O5 parameterization (γN2O5 Increment) has maximum impact in regions of high RH and very low temperature. Compared to the corrected base model, the largest average differences in total nitrate (TNO3)
concentrations in the updated model simulations are on the order of ±10% in January (on average, changes in TNO3
in August are<1%). Increases in γN2O5 values along the eastern seaboard and in the Southwest result in increases in monthly-average TNO3up to 0.16 µg/m3. In colder northern
areas,γN2O5 values are lower in the new model simulation, which results in a decrease in the TNO3 concentrations of
Fig. 1. Top row shows the average nighttime (04:00–09:00,GMT) values ofγN2O5 at the surface layer over the eastern United States during January 2006. (Daytime hours are not included because N2O5concentrations are negligible during the day). Bottom row shows the TNO3 concentrations (µg/m3) averaged across all hours in January 2006. The first and last columns show model output from the base model and theγN2O5Increment. The middle columns show the impact of correcting the error in the base CMAQ aerosol module and of using the new parameterization for the heterogeneous reaction probability.
In January, the γN2O5 incremental update slightly de-creases the average bias in TNO3 values compared to the
corrected base model. At 67 CASTNet sites, the normalized median bias in simulated TNO3concentrations is 16% in the
corrected base model and 12% in theγN2O5Increment. The
positive bias in predicted TNO3concentrations using the
up-dated model simulation is more evident in the Northeast in the winter time. TNO3concentrations in the summer time are
over predicted in all three of the simulations (the normalized median bias for the three increments is 43%), suggesting this bias is not sensitive to the change in theγ parameterization during warmer months. In the summer simulations, daytime production of TNO3 is very efficient so it compensates for
any changes in the night-time production. 4.2 SOA model enhancements
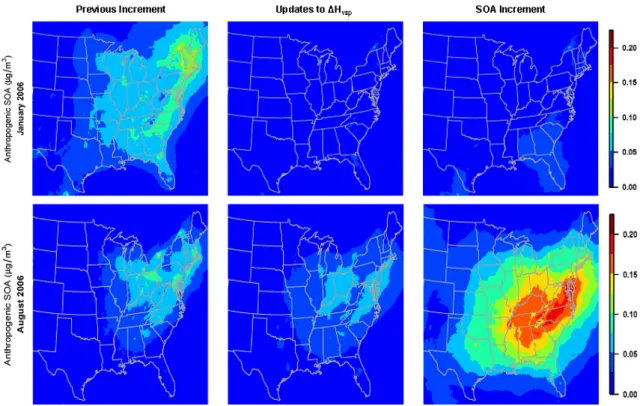
Of all of the changes made to the SOA module, the single most notable effect resulted from the updated enthalpies of vaporization (1Hvap). This parameter governs the
tempera-ture dependence of atmospheric SOA concentrations (Shee-han and Bowman, 2001). Due to its substantial impact, this update has been plotted separately in Figs. 2 and 3. In pre-vious versions, the 1Hvap value for each SOA type was
too large (156 kJ/mol), causing exaggerated wintertime SOA peaks and erroneous summertime minima (Yu et al., 2007). Reducing 1Hvap to within the 18–40 kJ/mol range in v4.7
results in a large decrease in both anthropogenic and bio-genic SOA concentrations during January and August (com-pare first and second columns of Figs. 2 and 3). In August, that decrease is offset by the addition of new SOA forma-tion pathways described in Sect. 2.2 (compare lower-center and lower-right plots in Figs. 2 and 3). The net effect of up-dating1Hvap and adding the new SOA formation pathways
leads to higher SOA concentrations in summer than in winter for both anthropogenic and biogenic SOA across the domain (third column of Figs. 2 and 3, respectively). Qualitatively, this seasonal pattern is in better agreement than v4.6 with ob-servational estimates of SOA (Kleindienst et al., 2007; Yu et al., 2007; Lewandowski et al., 2008).
Fig. 2. Monthly average anthropogenic SOA (µg/m3) for January (top row) and August (bottom row) 2006. The middle column shows the effect of reducing the enthalpies of vaporization (1Hvap) compared to the previous increment (left column). The right column shows results from the final SOA module in CMAQ v4.7 described in Sect. 2.2.
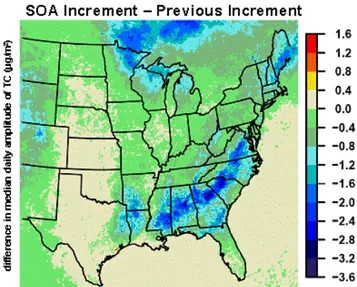
Fig. 4. Difference in the median of daily amplitudes (daily max – daily min) for TC (µg/m3) between the SOA module update and the previous model version for August 2006.
the Duke Forest, NC site, the median daily TC amplitude dropped from 4.3 µgC/m3 in the previous model version to 2.5 µgC/m3in the SOA Increment. The latter is consistent with the amplitude of 2.6 µgC/m3observed throughout Au-gust 2006 at the same location (Geron, 2009). A similar improvement was noted in Yorkville, GA (modeled TC am-plitude also dropped from 4.3 to 2.5 µg/m3), where observa-tions also indicate a median daily TC amplitude of 2.6 µg/m3 (based on 17 days in August 2003 with more than 75% data completeness; Edgerton et al., 2006).
As noted in Sect. 2.2, regulatory drivers motivated a need to incorporate the most up-to-date treatment of aromatic SOA formation into CMAQ v4.7. The inclusion of NOx-dependent yields increased anthropogenic SOA by more than a factor of three in the Southeast during summer (compare lower-left and lower-right plots in Fig. 2), bringing CMAQ results closer to the best-available observational estimates of aromatic SOA in the same region (Kleindienst et al., 2007 measured 0.8 µC/m3on highly-polluted days in July–August 2003). Efforts are underway to evaluate CMAQ v4.7 results directly against tracer-based estimates of precursor-specific SOA at times and locations where such detailed measure-ments were collected. In the present study, our evaluation of the modeled concentrations of carbonaceous PM2.5is limited
to the bulk measurements that are available at routine mon-itoring networks: TC, organic carbon (OC), and elemental carbon (EC).
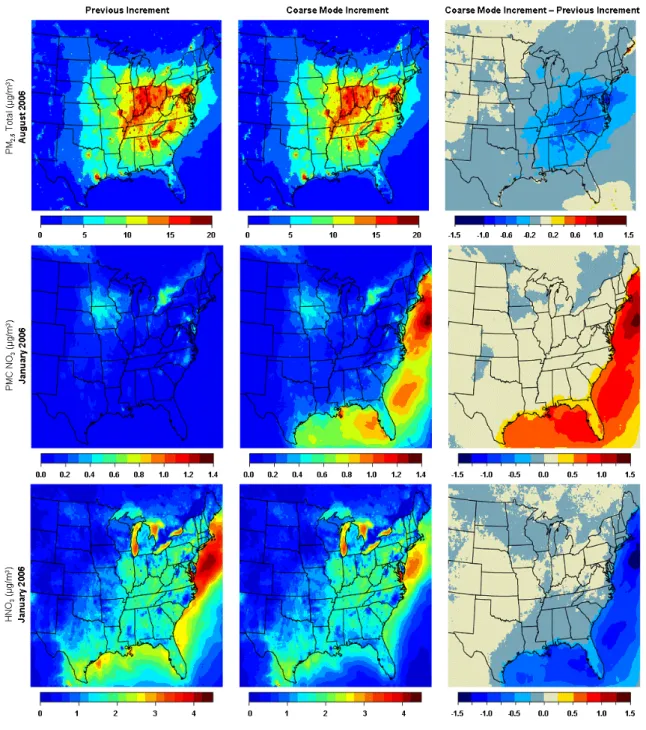
4.3 Coarse-particle chemistry
Chemical interactions between coarse particles and gas-phase pollutants were not treated in previous versions of CMAQ. The addition of such interactions causes modeled
PM2.5 concentrations to decline in August 2006, as shown
in the first row of Fig. 5. Lower modeled concentrations of PM2.5 are largely explained by changes in the distributions
of SO24−and NH+4 across the particle size spectrum, as these species now are allowed to condense on the coarse mode. Shifting mass to the coarse particles also increases the dry deposition of both SO24−and reduced nitrogen. During win-ter, the effects of coarse-particle chemistry on PM2.5are less
pronounced than in summer due to relatively low SO24− con-centrations.
The new coarse-particle treatment also impacts NO−3 pre-dictions during the winter. Over the ocean, coarse-particle NO−3 increases at the expense of HNO3(middle and bottom
rows of Fig. 5). Shifting NO−3 from the gas phase to coarse particles can affect the dry deposition of nitrogen in coastal ecosystems because the deposition velocity of HNO3differs
from that of coarse-mode NO−3 (Pryor and Sørensen, 2000). During summer, a similar effect was found. For further de-tails on these model changes and the impacts in coastal areas, see Kelly et al. (2009).
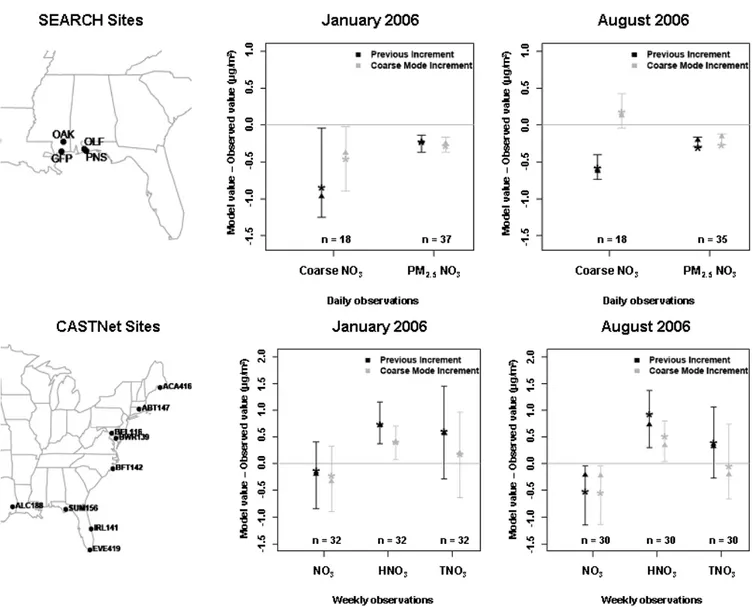
Observations from nine CASTNet sites near the coast show that model bias in TNO3 decreased both during
sum-mer and winter as a result of the updated coarse PM treatment and improved surf-zone emissions (bottom row of Fig. 6). These improvements are driven by decreases in modeled HNO3 concentrations. Four SEARCH monitors along the
Gulf Coast provide observations of both coarse and fine par-ticle NO−3. Prior to CMAQv4.7, the formation of coarse mode NO−3 was not treated (i.e., model predictions were 0.0 µg/m3), leading to the underestimation as shown in the top row of Fig. 6. The revised model improves the pre-dicted concentrations for coarse particles substantially, with-out degrading the performance for fine particle NO−3 at these locations.
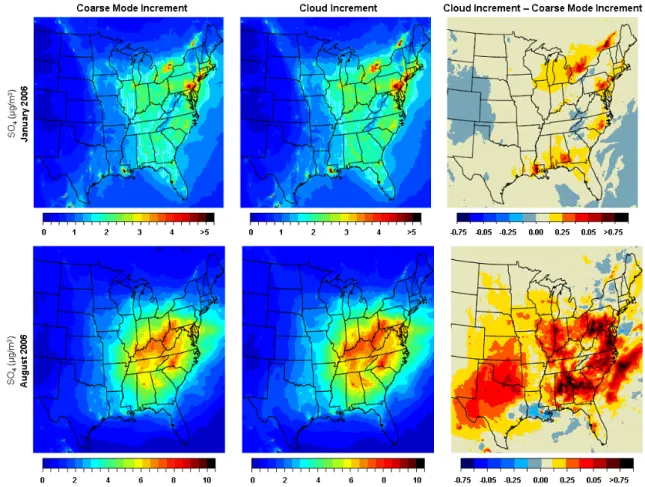
4.4 Cloud model improvements
Revisions to the cloud model produced the largest change in SO24−predictions. In general, modeled SO24−concentrations increase for the Cloud Increment in both January and August 2006 as shown in Fig. 7. The increase in concentrations in January is due to the correction of the vertical allocation of the precipitation flux in the resolved cloud model discussed in Sect. 2.3. Prior to this change, more SO24−was removed by wet deposition from layer 1. Concentrations of other PM species show a similar relative increase in the January simu-lation with the changes in the cloud model. The August sim-ulation shows a more significant increase in SO24− concentra-tions (ranging from 0.25 to 1.25 µg/m3 throughout much of the domain) because of changes made to the convective cloud model and the increased convective cloud activity during the summer.
Fig. 5. Monthly average concentrations (µg/m3) of PM2.5in August 2006 (top row), and coarse-particle NO−3 (middle row) and gas-phase HNO3(bottom row) in January 2006. Results are shown from the previous model increment (left column), the revised model (middle column) and their difference (right column).
The difference plot for January is much smoother than for August, reflecting the different cloud types and precipitation for each season (e.g., grid-resolved clouds in the winter and sub-grid convective clouds in the summer).
From an evaluation perspective, these changes made modest improvements to SO24− aerosol concentrations and smaller changes for wet deposition SO24−. In January, the normalized median bias at 174 CSN sites is –13.2% in the
Fig. 6. Mean (star), median (triangle), and inter-quartile ranges of model bias (model value – observed value) for multiple species measured at 9 coastal CASTNet sites and 4 SEARCH sites. The number of model/observation pairs for each species is shown above the x-axis.
4.5 In-line photolysis research option
The in-line photolysis module calculated lower decreases monthly average photolysis rates at the surface layer com-pared to the values interpolated from JPROC. The differences are most pronounced in areas of high elevation as shown in the difference plots in Fig. 9 for the NO2 and O3→O(1D)
photolysis reactions. Photolysis rates increase with height because there is less absorption of incoming direct radia-tion and more indirect radiaradia-tion from below (atmospheric scattering from below). The table interpolation method cal-culates higher photolysis rates in high elevation areas be-cause vertical interpolation of these rates to the grid cell terrain height overestimates the indirect radiation from be-low. The in-line module performs radiative transfer calcula-tions for every grid cell, directly accounting for the terrain
heights. Geographic differences are evident in both pan-els of Fig. 9, however, differences in the O3→O(1D)
pho-tolysis rates are much larger than for NO2. In addition to
the elevation affects noted above, the O3→O(1D)
photoly-sis rates are also influenced by the stratospheric ozone col-umn values used in each model. As noted by Binkowski et al. (2007), the stratospheric ozone column amount may be overestimated with the in-line photolysis module because the method (Van Heuklon, 1979) used to compute these val-ues does not account for stratospheric ozone depletion that occurred during the last 30 years. Satellite measurements of O3column (http://toms.gsfc.nasa.gov/ozone/ozone v8.html)
will replace this method in future model releases.
Fig. 7. Monthly average SO24−concentrations (µg/m3) for January (top row) and August (bottom row) 2006 for the previous model (left column), revised model (middle column) and their difference (right column).
slower oxidation of SO2to SO24−. Slower oxidation and
re-moval of VOC leads to increases of VOC by 1–7% through-out most of the domain. Decreased photolysis rates lead to less O3production in most of the eastern United States.
Along the southern coast, the monthly average of the daily maximum 8-h average O3increased by<1 ppb. Across the
rest of the domain, the new calculation of the photolysis rates tends to decrease the daily maximum 8-h average O3by 0.3–
2.2 pbb (0.4–3.7%) (Nolte et al., 2008c). 5 Evaluation of CMAQv4.7
The released model version, CMAQv4.7, includes the changes described above as well as other miscellaneous code updates documented in Sect. 2 and in the release notes avail-able from http://www.cmaq-model.org. Model performance under default settings is evaluated for the set of pollutants of primary interest for policy applications: total PM2.5mass,
PM2.5 species, O3, and wet deposition of SO24−, NO−3 and
NH+4. The impacts of optional model configurations, e.g., the two new options for calculating photolysis rate constants and the in-line processing option are not addressed in this section.
5.1 PM2.5
The net impact of all of the scientific updates on model per-formance for total PM2.5mass and its components is shown
in Fig. 10. (Additional performance statistics for the bias and error of these species at IMPROVE, CSN and CAST-Net sites are provided in Tables 3 and 4.) In January at the rural IMPROVE sites, there is a slight improvement in the median bias for total PM2.5 mass (+0.57 µg/m3in the base
model versus +0.40 µg/m3in v4.7). This is mainly a result of the updated1Hvapvalues in the SOA module which
de-crease the OC predictions in winter (see top rows of Figs. 2 and 3).
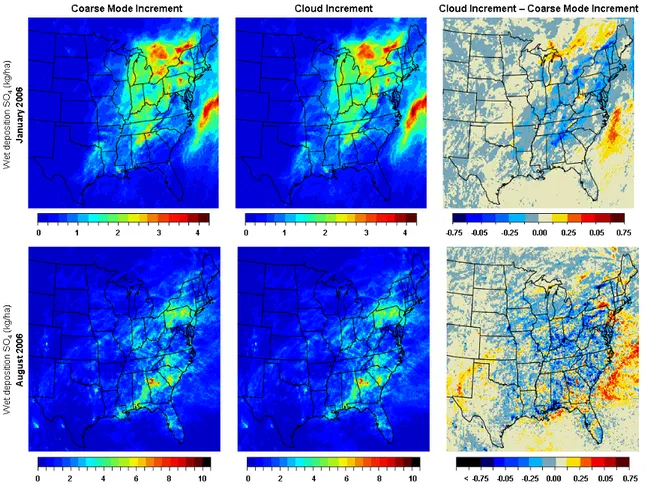
Fig. 8. Monthly total SO24−wet deposition (kg/ha) for January (top row) and August (bottom row) 2006 for the previous model (left column), revised model (middle column) and their difference (right column).
Fig. 9. Percent change in monthly averaged photolysis rates over daytime hours (14:00–24:00 Z) for NO2 (left) and O3→O(1D) (right).
in v4.7. Increased CMAQ predictions of both SO24− and NO−3 lead to a small bias in NH+4 of +0.15 µg/m3, but this is acceptable because the measurements of NH+4 on denuded nylon filters are believed to have a negative bias (Frank, 2006). In contrast to the inorganic ions, TC predictions
de-crease between the base model and v4.7. This dede-crease can be attributed to improvements in the SOA module, which slightly mitigate the median bias for TC (+0.43 µg/m3in the base model versus +0.27 µg/m3 in v4.7). The net effect of improving the predictions of SO24−, NO−3, and TC in Jan-uary at the CSN sites is a degradation in model performance for total PM2.5 mass (+1.61 µg/m3 in the base model
ver-sus +1.92 µg/m3 in v4.7), because we have removed some compensating errors from the predictions of individual PM2.5
components.
However, the improvements in model performance in Jan-uary for individual constituents are dwarfed by the large overprediction of unspeciated PM2.5 (PMother), which was
unaffected by the scientific updates described in this pa-per (median bias is +1.9 µg/m3in both the base model and v4.7). As seen in the lower center panel of Fig. 10, the v4.7 model bias for total PM2.5mass is explained almost entirely
by the bias in PMother. Similar bias in wintertime PMother
Fig. 10. Mean (star), median (triangle), and inter-quartile ranges of model bias (model value – observed value) for multiple fine-particle species measured at IMPROVE and CSN sites in the 12 km domain. IMPROVE and CSN observations are daily averages. The number of model/observation pairs for each species is shown above the x-axis.
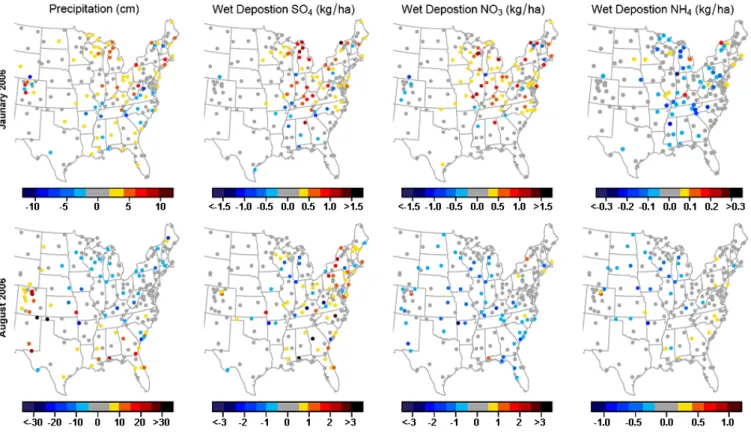
Fig. 12. Difference in monthly total precipitation (cm), wet deposition SO24−(kg/ha), wet deposition NO−3 (kg/ha), and wet deposition NH+4 (kg/ha) between the CMAQv4.7 model values and the NADP observations for January (top row) and August (bottom row). January totals are for 3–31 January; August totals are for 1–29 August 2006.
Table 2. Definition of statistical metrics used to compare observed and simulated O3, aerosol species and wet deposition species.
Metric Definition
Observed Concentration Co
Modeled Concentration Cm
Median Bias MdnB=medianCM−CO)N
Median Error MdnE=median|CM−CO|N
Normalized Median Bias NMdnB=median(CM−CO)N
median(CO)N ·100%
Normalized Median Error NMdnE=median|CM−CO|N
median(CO)N ·100%
In August at the IMPROVE sites, there is very little change in the median bias between the base model and v4.7 for to-tal PM2.5 mass. Although SO24− underpredictions are
re-duced by a factor of three at these sites due to the cloud module updates in v4.7, much of that improvement is off-set by a small degradation in the OC predictions (see Ta-ble 4). At the CSN sites, the PM2.5 bias is improved due
to the increase in SO24−. However PM2.5 is still
underpre-dicted (median bias = –0.78 µg/m3) and this bias in August is dominated by the underprediction in TC concentrations
(median bias = –1.11 µg/m3). Future efforts to improve the summertime PM2.5underpredictions at both IMPROVE and
CSN sites will require improvements to the treatment of or-ganic aerosol in CMAQ (see Sect. 6).
5.2 Ozone
Appel et al. (2009) discuss how the change from MM5 to WRF meteorological input fields had a significant impact on O3, increasing the modeled monthly-average mixing ratios in
August by up to 10 ppb along the Gulf of Mexico. In contrast, updates to the CMAQ chemistry and cloud modules resulted in a much smaller change in the monthly-average simulated values of daily maximum 8-h O3(<±3 ppb). Model biases
noted in previously released versions are still present. Spe-cifically, relative to the AQS observations, low O3 mixing
ratios are overpredicted and higher O3mixing ratios tend to
be underpredicted as shown in the binned boxplots in Fig. 11. The bias and absolute bias values are slightly worse in the up-per and lower tail of the observed O3distribution compared
to the base model.
Updates to HONO chemistry described in Sect. 2.4 had a smaller impact on O3 compared to other changes in the
Table 3. RMSE, NMdnB, NMdnE, MdnB and MdnE for O3(ppb), fine-particulate mass and species (µg/m3), precipitation (cm) and wet deposition species (kg/ha) for January 2006. These metrics are defined in Table 2.
Species Network # of Obs Mdn of Obs NMdnB (%) NMdnE (%) MdnB MdnE
Base v4.7 Base v4.7 Base v4.7 Base v4.7
O3(8-h Max) AQS 10 534 32.5 3.4 3.9 13.3 13.2 1.12 1.27 4.33 4.29
IMPROVE 793 1.17 –8.4 –5.9 27.4 26.5 –0.10 –0.07 .32 .31
SO24− CSN 1031 2.21 –13.6 –5.9 31.5 27.9 –0.30 –0.13 0.70 0.62
CASTNet 247 1.99 –20.4 –16.0 21.9 21.2 –0.41 –0.32 0.44 0.42
NO−3 IMPROVE 793 0.39 –8.4 –4.6 86.5 82.1 –0.03 –0.02 0.34 0.32
CSN 991 1.42 –7.1 0.8 51.2 49.9 –0.10 0.01 0.73 0.71
TNO3 CASTNet 247 2.27 3.5 19.5 18.3 25.8 0.08 0.44 0.42 0.59
NH+4 CSN 1031 1.09 4.6 14.1 43.2 42.6 0.05 0.15 0.47 0.46
CASTNet 247 0.69 7.3 13.4 20.7 23.6 0.05 0.09 0.14 0.16
OC IMPROVE 829 0.65 4.5 –19.8 39.0 43.6 0.03 –0.13 0.25 0.28
EC IMPROVE 829 0.20 –25.7 –24.5 40.3 39.9 –0.05 –0.05 0.08 0.08
TC IMPROVE 829 0.85 –1.5 –21.1 38.2 41.9 –0.01 –0.18 0.33 0.36
CSN 997 1.89 22.6 14.3 53.4 48.7 0.43 0.27 1.01 0.92
PMother CSN 837 2.37 77.7 80.1 96.0 95.6 1.85 1.90 2.27 2.26
PM2.5
IMPROVE 863 4.16 13.8 9.5 40.3 39.7 0.57 0.40 1.68 1.65
CSN 883 10.00 16.05 19.1 41.3 39.1 1.61 1.91 4.13 3.91
Precipitation
NADP
181 5.51 18.7 35.3 1.03 1.94
WetD Sulf. 176 0.54 8.7 10.9 27.9 29.7 0.05 0.06 0.15 0.16
WetD Amm. 176 0.09 –13.1 –14.3 42.8 40.1 –0.01 –0.01 0.04 0.04
WetD Nitr. 176 0.47 32.2 34.9 51.9 49.1 0.15 0.16 0.24 0.23
in the sub-grid cloud model. The occurrence of NP clouds in-creased during the afternoon hours, venting more pollutants from the boundary layer to the free troposphere. Across the entire range of O3mixing ratios, the performance statistics
for the bias and error of CMAQv4.7 predictions at these sites are very similar to the metrics for the base model as shown in Tables 3 and 4. Possible sources of persistent errors in O3
prediction are discussed in Sect. 6. 5.3 Wet deposition
Atmospheric deposition is an important sink process and its representation can impact simulated tropospheric pollutant budgets. As discussed in Sect. 4.4, changes to the resolved cloud model tend to decrease monthly SO24−wet deposition. This decrease is counteracted, however, by an increase in wet deposition of SO24−due to the changes in coarse parti-cle treatment (i.e., the increase in surf-zone emissions and the addition of gas-to-particle mass transfer for coarse parti-cles). The impact of all of the model changes is a slight in-crease in the model bias for SO24−wet deposition in January
and August. Changes in NO−3 and NH+4 wet deposition are also very small in both months. (Performance statistics for model predicted values at NADP sites are given in Tables 3 and 4.) Nitrate wet deposition is overestimated in the winter (median bias = +0.16 kg/ha) and underestimated in the sum-mer (median bias = –0.22 kg/ha) compared to observations. The median bias in SO24−wet deposition is positive but rel-atively small (+.06 kg/ha in January and +.10 kg/ha in Au-gust). There is also a large degree of error associated with all three wet deposition species in both seasons (normalized median error ranges from 30–49%).
Table 4. RMSE, NMdnB, NMdnE, MdnB and MdnE for O3(ppb), fine-particulate mass and species (µg/m3), precipitation (cm) and wet deposition species (kg/ha) for August 2006. These metrics are defined in Table 2.
Species Network # of Obs Mdn of Obs NMdnB (%) NMdnE (%) MdnB MdnE
Base v4.7 Base v4.7 Base v4.7 Base v4.7
O3(8-h Max) AQS 25920 48.4 6.9 6.9 14.7 14.5 3.32 3.35 7.13 7.02
SO24− IMPROVE 563 1.32 –12.7 –4.8 34.7 35.0 –0.17 –0.06 0.46 0.46
CSN 963 3.51 –5.0 –0.2 28.3 28.0 –0.18 –0.01 0.99 0.98
CASTNet 255 4.75 –21.3 –18.6 21.7 19.0 –1.01 –0.89 1.03 0.90
NO−3 IMPROVE 563 0.14 –44.9 –43.5 80.6 76.0 –0.06 –0.06 0.11 0.10
CSN 918 0.39 –22.0 –23.8 66.6 69.4 –0.09 –0.09 0.26 0.27
TNO3 CASTNet 255 1.64 42.3 42.3 48.5 51.1 0.69 0.69 0.79 0.84
NH+4 CSN 963 1.07 11.0 15.4 36.7 36.4 0.12 0.17 0.39 0.39
CASTNet 255 1.43 –9.0 –6.3 16.2 16.2 –0.13 –0.09 0.23 0.23
OC IMPROVE 783 1.18 –45.3 –48.5 50.3 51.7 –0.53 –0.57 0.59 0.61
EC IMPROVE 783 0.24 –30.7 –31.9 39.9 40.6 –0.07 –0.08 0.09 0.10
TC IMPROVE 783 1.47 –40.5 –45.2 46.5 46.9 –0.60 –0.66 0.68 0.69
CSN 927 3.12 –31.9 –35.5 39.0 40.1 –1.00 –1.11 1.22 1.25
PMother CSN 767 3.32 8.64 7.93 52.2 51.2 0.29 0.26 1.73 1.70
PM2.5
IMPROVE 790 6.16 –28.6 –28.4 37.3 37.0 –1.76 –1.75 2.30 2.29
CSN 827 12.10 –7.9 –6.4 30.1 29.1 –0.95 –0.78 3.64 3.53
Precipitation
NADP
193 7.24 –0.6 47.2 –0.04 3.42
WetD Sulf. 190 1.09 8.0 8.8 32.9 34.2 0.09 0.10 0.36 0.37
WetD Amm. 190 0.22 3.4 –1.7 39.2 39.3 0.01 0.00 0.09 0.09
WetD Nitr. 190 0.83 –30.2 –27.1 40.9 39.7 –0.25 –0.22 0.34 0.33
too much SO24−production aloft in the CMAQ model during summer. This bias was identified by Mathur et al. (2008b) based on aircraft measurements of airborne SO24−levels col-lected during the ICARTT field experiment in 2004.
6 Discussion
Incremental testing of the CMAQv4.7 model updates al-lowed for a thorough diagnosis of the causes for changes in model outputs. This is the first time an evaluation of a new CMAQ model version has been approached in this sys-tematic manner. After evaluating each set of model results against ambient measurements collected at several national networks, a number of conclusions have become clear. First, the major inorganic ions in PM2.5(SO24−, NO−3 and NH+4)
which have been the focus of air quality model development efforts over the past several decades are relatively unbiased on a network-wide and monthly-averaged basis. Whereas model developments have historically focused on improv-ing the simulation of summertime air quality, scientific up-dates in v4.7 also have improved wintertime predictions of
the inorganic ions by a noticeable amount. Given the lack of systematic bias in the model performance for inorganic ions shown in Fig. 10, Tables 3 and 4, future evaluation efforts should test the model results for these species in regional sub-domains (e.g., Fig. 4 by Appel et al., 2008) and during shorter time periods (e.g., episodic high-PM events). Such evaluations may identify areas of poor performance where further model development is warranted.
Third, it has become apparent that the model biases for total PM2.5 mass during winter are dominated by
overpre-dictions of PMother. On an absolute scale, the PMothermodel
bias greatly exceeds the bias for any other PM2.5component.
None of the scientific updates in v4.7 were aimed at improv-ing the PMother predictions, so it is not surprising that the
model predictions show little change between the base model and v4.7. Previous investigators have suggested at least five hypotheses to explain the wintertime PMotheroverpredictions
(Appel et al., 2008; Mathur et al., 2008b), and efforts are un-derway to test them. For example, Reff et al. (2009) recently developed an anthropogenic emissions inventory for PM2.5
trace elements (e.g., Fe, Ni, Zn) for the US. The CMAQ model will be modified to track several of those trace ele-ments so that the resulting modeled values can be compared against measurements at the national monitoring networks. Such comparisons should shed light on which specific ele-ments or emission sources are contributing most to the win-tertime PMotherbias.
Fourth, we find that the overpredictions of low O3mixing
ratios persist in CMAQv4.7. The tightening of the maximum 8-h O3National Ambient Air Quality Standard (NAAQS) to
a lower threshold value has increased the importance of re-ducing errors in prediction of these low-moderate O3
mix-ing ratios. The overprediction of the low end of the O3
range is related to the simulated background concentration, which is largely determined by lateral boundary conditions (LBCs) used in limited area models. Generally, the con-ditions when low maximum daily 8-h average O3 occurs
are cloudy with strong winds, particularly directed from re-gions with relatively low O3 mixing ratios, such as oceans
or sparsely populated areas, which are often along the model domain boundaries. The nesting of regional and mesoscale model grids within coarser grid resolution global or hemi-spheric model grids, increased vertical resolution in the low-est model layers, and improvements in representation of exchange processes between the boundary-layer and free-troposphere (cf., Mathur et al., 2005) could help reduce this source of error.
Fifth, errors also persist in prediction of the highest O3
mixing ratios. Conditions for high O3are generally
charac-terized by high pressure systems that maintain mostly clear skies and inhibit boundary layer growth due to subsidence. Subtle errors in surface conditions (e.g. soil moisture, vege-tation type and growth state, or albedo) can lead to errors in PBL depth. Errors in cloud development can cause er-roneous PBL development and venting as well as errors in photolysis rates. Errors in wind speed will cause errors in di-lution, while errors in wind direction can displace O3plume
maxima. Further improvements in meteorology modeling should reduce many of these errors that contribute to errors in O3concentration predictions. For example, improved
tech-niques and additional data sources for meteorological data assimilation will reduce errors in wind speed and direction. More accurate high resolution land-use data are being used
for the land-surface modeling in WRF and the dry deposition modeling CMAQ. This new database should reduce tempature and humidity errors which will reduce PBL height er-rors. Updated, more sophisticated microphysics and radia-tion schemes are now available in the WRF system that re-duce errors associated with cloud cover. These efforts will help diagnose the cause of O3underpredictions at the
high-est mixing ratios so that the model can be improved and used with greater confidence in developing air quality manage-ment plans for peak O3.
Sixth, predictions of the wet deposition species in v4.7 did not change significantly from the previous version of the model. Predictions of the wet deposition species are highly dependent on the predictions of the aerosol and gas species, as well as to the timing and intensity of precipitation predic-tions from the meteorological model. Improvements in the predictions of the aerosol and gas species, as well as any im-provements in the precipitation and cloud predictions should naturally translate into improved wet deposition predictions. Therefore, the focus in the future will be on improving these predictions first, and then shift to improving the specific wet deposition mechanisms within CMAQ.
Finally, of the five incremental updates discussed here, the changes to the cloud model had the most wide-spread impact on model results, affecting the prediction of O3, PM2.5
com-ponents and wet deposition. Development of the cloud mod-ule will continue to play a critical role in improving these pre-dictions. For example, the current subgrid convective cloud parameterization (included in CMAQv4.7) uses an adapta-tion of the Asymmetric Convective Model (ACM) (Pleim and Chang, 1992) to mix pollutants vertically in the cloud column. A drawback to this mixing algorithm is that the downdraft is not explicitly simulated. An alternative convec-tive cloud scheme (Grell, 1993) is being incorporated into CMAQ, which will more closely replicate the Grell convec-tive cloud scheme used in WRF. This cloud scheme simulates updrafts, downdrafts, and compensating subsidence/uplifting using a mass-flux scheme and should provide a better repre-sentation of the cloud mixing process. Future evaluation of different cloud parameterizations will require vertical pro-files of pollutant concentrations from aircraft measurements as well as satellite and radar data on the location and vertical extent of cloud predictions.
performance for the western United States. Simulations over longer time periods will demonstrate the sensitivity of these model performance results to different meteorological con-ditions across different seasons.
Acknowledgements. The authors would like to recognize the many contributions of others in the development, testing, and evalua-tion of CMAQv4.7: Bill Benjey, Russ Bullock, Ann Marie Carl-ton, Ellen Cooter, Robin Dennis, Steve Howard, Bill Hutzell, Deb-orah Luecken, Sergey Napelenok, Rob Pinder, George Pouliot, Ken Schere, Donna Schwede, Jenise Swall, Gary Walter, and David Wong (EPA/ORD/NERL/AMAD); Frank Binkowski, Uma Shankar, and Aijun Xiu (University of North Carolina, Institute of the Environment); and Arastoo Pour Biazar (University of Al-abama, Huntsville). In addition, we want to thank Lucille Bender, Charles Chang, Ryan Cleary, Allan Huffman, Nancy Hwang, and Lara Reynolds (Computer Sciences Corporation) for their support in processing emissions, performing CMAQ model simulations, and post-processing data for the evaluation.
Disclaimer. The United States Environmental Protection Agency through its Office of Research and Development funded and
managed the research described here. It has been subjected to
Agency’s administrative review and approved for publication.
Edited by: A. Sandu
References
Aiyyer, A., Cohan, D., Russell, A., Stockwell, W., Tanrikulu, S., Vizuete, W., and Wilczak, J.: Final report: Third peer review of the CMAQ model, online available at: http://www.cmascenter. org/r and d/cmaq review process.cfm, 2007.
Appel, K. W., Bhave, P. V., Gilliland, A. B., Sarwar, G., and Roselle, S. J.: Evaluation of the Community Multiscale Air Qual-ity (CMAQ) model version 4.5: Sensitivities impacting model performance; Part II – particulate matter, Atmos. Environ., 42, 6057–6066, 2008.
Appel, K. W., Gilliand, A. B., Sarwar, G., and Gilliam, R. C.: Eval-uation of the Community Multiscale Air Quality (CMAQ) model version 4.5: Sensitivities impacting model performance, Atmos. Environ., 41, 9603–9615, 2007.
Appel, K. W., Roselle, S. J., Gilliam, R. C., and Pleim, J. E.: Sensi-tivity of the Community Multiscale Air Quality (CMAQ) model v4.7 results for the eastern United States to MM5 and WRF me-teorological drivers, Geosci. Model Dev., 3, 169–188, 2010. Bash, J. O.: Description and initial simulation of a dynamic
bi-directional air-surface exchange model for mercury in CMAQ, J. Geophys. Res., doi:10.1029/2009JD012834, in press, 2010. Bhave, P. V., Pouliot, G. A., and Zheng, M.: Diagnostic model
eval-uation for carbonaceous PM2.5using organic markers measured in the southeastern U.S., Environ. Sci. Technol., 41, 1577–1583, 2007.
Binkowski, F. S., Aranachalam, S., Adelman, Z., and Pinto, J. P.: Examining photolysis rates with a prototype online photolysis
module in CMAQ, J. Appl. Meteor. Climatol., 46, 1252–1256, 2007.
Bullock, O. R. and Brehme, K. A.: Atmospheric mercury simula-tion using the CMAQ model: formulasimula-tion descripsimula-tion and anal-ysis of wet deposition results, Atmos. Environ., 36, 2135–2146, 2002.
Byun, D. and Schere, K. L.: Review of the Governing Equa-tions, Computational Algorithms, and Other Components of the Models-3 Community Multiscale Air Quality (CMAQ) Model-ing System, Appl. Mech. Rev., 59, 51–77, 2006.
Carlton, A. G., Bhave, P. V., Napelenok, S. L., Pinder, R. W., Sar-war, G., Pouliot, G. A., and Edney, E. O.: Improved treatment of secondary organic aerosol in CMAQ, Environ. Sci. Technol., in review, 2010.
Carlton, A. G., Turpin, B. J., Altieri, K. E., Seitzinger, S. P., Mathur, R., Roselle, S. J., and Weber, R. J.: CMAQ model per-formance enhanced when in-cloud secondary organic aerosol is included: comparisons of organic carbon predictions with mea-surements, Environ. Sci. Technol., 42, 8798–8892, 2008. Carter, W. P. L.: Implementation of the SAPRC-99 Chemical
Mech-anism into the Models-3 Framework, Report to the United States Environmental Protection Agency, online available at: http:// www.cert.ucr.edu/∼carter/absts.htm#s99mod3, 2000.
Davis, J. M., Bhave, P. V., and Foley, K. M.: Parameterization of N2O5reaction probabilities on the surface of particles containing ammonium, sulfate, and nitrate, Atmos. Chem. Phys., 8, 5295– 5311, 2008,
http://www.atmos-chem-phys.net/8/5295/2008/.
Dentener, F. J. and Crutzen, P. J.: Reaction of N2O5on tropospheric aerosols: Impact on the global distributions of NOx, O3, and OH, J. Geophys. Res., 98(D4), 7149–7163, 1993.
Dickerson, R. R., Kondragunta, S., Stenchikov, G., Civerolo, K. L., Dodderidge, B. G., and Holben, B.: The impact of aerosols on solar UV radiation and photochemical smog, Science, 278, 827– 830, 1997.
Eder, B. and Yu, S.: A performance evaluation of the 2004 release of Models-3 CMAQ, Atmos. Environ., 40, 4811–4824, 2006. Edgerton, E. S., Hartsell, B. E., Saylor, R. D., Jansen, J. J.,
Hansen, D. A., and Hidy, G. M.: The Southeastern Aerosol Research and Characterization Study, part 3: Continuous mea-surements of fine particulate matter mass and composition, J. Air Waste Manage. Assoc., 56, 1325–1341, 2006.
Environmental Protection Agency: Draft regulatory impact analy-sis: Changes to renewable fuel standard program, EPA-420-D-09-001, 2009.
Evans, M. J. and Jacob, D. J.: Impact of new laboratory studies of N2O5hydrolysis on global model budgets of tropospheric ni-trogen oxides, ozone and OH, Geophys. Res. Lett., 32, L09813, doi:10.1029/2005GL022469, 2005.
Fann, N., Fulcher, C. M., and Hubbell, B. J.: The influence of location, source, and emission type in estimates of the human health benefits of reducing a ton of air pollution, Air Qual. At-mos. Health, 2, 169–176, 2009.