www.the-cryosphere.net/3/125/2009/
© Author(s) 2009. This work is distributed under the Creative Commons Attribution 3.0 License.
The Cryosphere
Increased rate of acceleration on Pine Island Glacier strongly
coupled to changes in gravitational driving stress
J. B. T. Scott, G. H. Gudmundsson, A. M. Smith, R. G. Bingham, H. D. Pritchard, and D. G. Vaughan
British Antarctic Survey, Cambridge, UK
Received: 16 January 2009 – Published in The Cryosphere Discuss.: 24 February 2009 Revised: 23 April 2009 – Accepted: 7 May 2009 – Published: 13 May 2009
Abstract. Pine Island Glacier, Antarctica, has been un-dergoing several related changes for at least two decades; these include acceleration, thinning and grounding line re-treat. During the first major ground-based study between 2006 and 2008, GPS receivers were used to monitor ice flow from 55 km to 171 km inland, along the central flowline. At four sites both acceleration and thinning rates over the last two years exceeded rates observed at any other time over the last two decades. At the downstream site acceleration was 6.4% over 2007 and thinning was 3.5±0.5 ma−1. Ac-celeration and thinning have spread rapidly inland with the acceleration 171 km inland at 4.1% over 2007, greater than any measured annual flow increase along the whole glacier prior to 2006. Increases in surface slope, and hence gravita-tional driving stress, correlate well with the acceleration and no sustained change in longitudinal stress gradient is needed to explain the force balance. There is no indication that the glacier is approaching a new steady state.
1 Introduction
In recent decades Pine Island Glacier (PIG) has shown sev-eral changes including grounding line retreat, acceleration and thinning (Rignot, 1998; Shepherd et al., 2002; Rignot et al., 2002). The PIG basin, which comprises 10% of the West Antarctic Ice Sheet, is getting increasingly out of balance, with an estimated rate of net mass loss of 46 Gt a−1in 2007 (Rignot, 2008), the greatest imbalance of any ice stream in the world. These changes may indicate the start of a period of major retreat. This could occur if the thinning causes un-grounding of the weakly grounded “ice plain” at the down-stream end of PIG (Payne et al., 2004), reducing the basal
Correspondence to:J. B. T. Scott ([email protected])
resistance to flow and creating a positive feedback. It is thus important to determine precisely how thinning and acceler-ation are linked, how they propagate upstream, and whether there is any indication that PIG is stabilising.
Table 1.Velocities and rates of acceleration measured at the GPS stations.
Station Mean velocity Mean acceleration Mean acceleration Mean acceleration u (2007/2008 between seasons during 2006/2007 during 2007/2008 season) (2006/2007 and season season
2007/2008)
PC55 2075±2 ma−1 115±2 ma−2 137±20 ma−2 131±20 ma−2 (26 Dec–15 Jan) (21 Nov–31 Jan) PC111 907±2 ma−1 41.5±2 ma−2 49±10 ma−2 51±10 ma−2
(14 Dec–5 Feb) (11 Nov–4 Feb) PC171 325±2 ma−1 12.7±2 ma−2 11.6±2 ma−2 No value
(19 Dec–3 Feb) (30 Nov–20 Dec)
PS169 319±2 ma−1 Not deployed No value
(1 Dec–30 Dec)
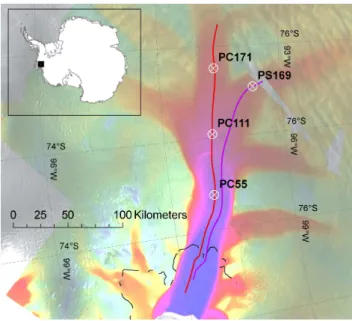
Fig. 1. Map of Pine Island Glacier. Flowlines in red and purple; grounding line (2000) in black. Background is velocity magnitude from ERS-1/-2 data overlaid on a RADARSAT-1 mosaic (Rignot, 2006).
2 Observations
Between early-December 2006 and early-February 2007, three GPS receivers were sited close to the central flowline of PIG (Fig. 1) at sites 55, 111, and 171 km upstream from the grounding line (the 2000 flexing limit determined from InSAR, E. Rignot, personal communication, 2007). The same geographic sites (hereafter PC55, PC111 and PC171 respectively), were reoccupied between mid-November 2007 and early-February 2008, and a further GPS station, PS169, was placed on a tributary to PIG, 169 km upstream from the grounding line (Fig. 1).
GPS data were recorded at 10 s intervals and processed to give kinematic precise point position solutions every 30 s. This processing used the Bernese software and was the same as that used by Gudmundsson (2007). With this method it is possible to detect variations in horizontal position to around 0.01 m. A more detailed analysis of this processing method and the associated uncertainties is given by Dach et al. (2009).
At the beginning and end of the 2007/2008 season, further GPS measurements were made to derive the strain rates in a 1 km radius around each site. The surface profile along the central flowline was also measured by kinematic GPS, along with net snow accumulation at PC55 and PC111.
3 Mean velocity and acceleration
We can only compare the GPS velocity directly with a re-cent InSAR measurement at PC55, where an InSAR veloc-ity estimate is available 124 days before the midpoint of the 2006/2007 GPS occupation (E. Rignot, personal communi-cation, 2007). The GPS velocity can be corrected for the time difference between these measurements, using the acceler-ation measured by the GPS. This gives a velocity of 2.7% greater than the InSAR velocity. InSAR velocities can have errors up to 3% in areas of high slope, which tend to can-cel out when comparing several InSAR data sets with simi-lar imaging geometry (I. Joughin, personal communication, 2007). This error and changes in acceleration could account for the difference between the GPS and InSAR.
For all GPS sites, velocity estimates for the year 1996 are available from InSAR (Joughin et al., 2003). Compared to these earlier estimates, velocities have increased signif-icantly. The increases over the 12-year period from early 1996 to mid-season 2007/2008 at PC55, PC111, PC171 and PS169 are 42%, 36%, 34% and 26% respectively, approx-imately a 2 to 3% annual increase. The velocity increases at PC55, PC111 and PC171 during 2007 were 6.4, 4.8 and 4.1% respectively. Thus, over the entire length of PIG, ac-celeration during 2007 was considerably larger than over the 12-year period from 1996 to 2008.
The velocity increase of 42% over 12 years at PC55 is identical to that reported by Rignot (2008), from InSAR mea-surements alone, for the area close to the grounding line (around 40 km downstream from PC55). The 2007 rate of ac-celeration at PC55, of 6.4 over 12 months, is slightly higher than that reported by Rignot (2008), of 8% over 16 months, but this is likely to be due to the difference in time period. This demonstrates that where the GPS measurements and In-SAR overlap they are in good agreement despite the differ-ence in spatial scales. However, the GPS results also demon-strate velocity increases further upstream than has been pos-sible using the available InSAR data, which, apart from in 1996, do not have the spatial coverage to give velocity esti-mates further than around 100 km inland on PIG.
4 Elevation change
At each GPS site, we calculated a thinning rate (∂th) for the
continuous measurement periods, from the speed in the di-rection of flow (u), the vertical speed (w), the surface gradi-ent in the direction of flow (∂xh) and the rate of accumulation
(a) using the kinematic boundary condition
∂th+u∂xh−w=a. (1)
Contributions to uncertainty in the calculated thinning rates arise from GPS measurements ofuandw(±1%); the stan-dard error in the surface gradient measurement (from the GPS profiles±7–9%) and the variation in the accumulation rate. Accumulation was measured against snow stakes at PC55 and PC111, giving 0.99 and 1.06 ma−1 respectively.
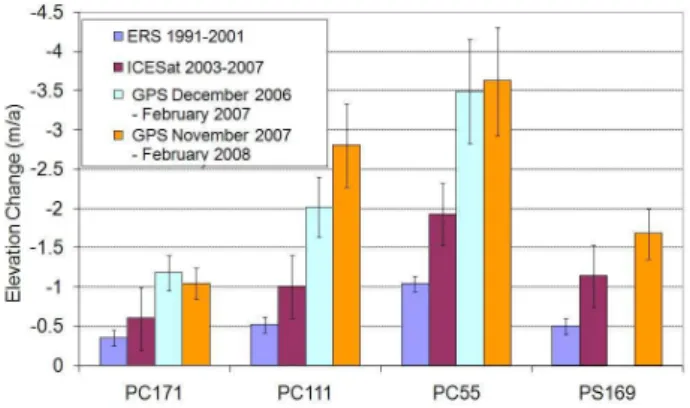
Fig. 2. Rates of elevation change from GPS measurements, laser altimetry (Appendix A) and radar altimetry (Shepherd et al., 2002).
These accumulation measurements agree closely with mean values from five 20 m ice cores taken at PC111, PC171 and sites in between during the 2006/2007 and 2007/2008 sea-sons. From these cores we calculate a standard deviation in the annual accumulation rate of±20%.
There is a decrease in surface elevation during both sea-sons at all the GPS sites. This can be compared with ele-vation change derived for the same sites using satellite laser altimetry, calculated by us from ICESat data (Appendix A), for the period 2003–2007 (Fig. 2). For the ICESat elevation changes we have calculated errors due to the measurements not being at the same location as the GPS stations, using the standard deviation in the ICESat estimates over a 10 km ra-dius. Taking ICESat elevation change values along a 10 km profile, perpendicular to, and crossing, the ice stream cen-terline shows that there is no significant elevation change bias due to the GPS points being located along this center-line. We compare these ICESat elevation changes to those derived from satellite radar altimetry for the period 1991– 2001 (Shepherd et al., 2002) (Fig. 2). Figure 2 shows that the thinning is increasing, and that it is strongest close to the grounding line. Our analysis of ICESat data is consis-tent with the earlier ICESat results presented by Thomas et al. (2004b) which showed that during 2004 thinning was ap-proximately double that of the 1990s. Current rates of thin-ning (late 2006 to early 2008) from GPS are even higher at around three times greater than in the 1990s.
5 Relationship between thinning and acceleration
acceleration we use a force balance for the glacier where the centerline velocity (u) is given by (van der Veen, 1999)
u= 2A
n+1H τˆd n
W
2H n+1
, (2)
where,His ice thickness,W is ice-stream width, andAand nare material properties describing ice flow. Here,τˆd, is the
effective driving stress which is a combination of the gravi-tational driving stress,τd, the basal drag,τb, and the gradient
in longitudinal stress. Implicitly, we have assumed that basal shear stress is independent of width and that horizontal stress gradients are small compared to both side and basal drag. These assumptions are made to provide a first order analy-sis and are a starting point for evaluating the potential effects of slope changes on centerline velocity. A similar model was applied by Joughin et al. (2003) and by Thomas et al. (2004a) for estimation of basal stress.
We apply Eq. (2) to the average geometry over the 116-km central flowline of PIG between PC55 and PC171, calcu-lating the gravitational driving stress from the surface slope (α=−0.00135), ice density (ρ=917 kg m−3), gravitational ac-celeration (g=9.81 ms−2)and ice thickness (H=1860 m) us-ing
τd = −ρgHsinα, (3)
to give, τd=22.6 kPa. From our strain rate measurements
at PC55 and PC171 we calculate the longitudinal stresses, giving a net stress due to longitudinal stress gradients of
−1.5 kPa for this region, approximately 7% of the magnitude of the gravitational driving stress and acting in the opposite direction. We usen=3 andA=2.9×10⁻¹⁶s−1kPa−3, corre-sponding to a depth-averaged temperature of−15◦C (Pater-son, 1994), and estimate an averageW=44 km. From the speed at PC111, approximately the midpoint of this section of flowline, accounting for the additional resistance from the longitudinal stress gradient, from Eq. (2) we calculate a basal drag of 3.6 kPa. This is low compared to the driving stress and therefore our use of Eq. (2) as a first order model is fur-ther justified.
With an initial assumption that basal drag and longitudinal stress gradients do not change, we analyse the sensitivity of velocity to changes in gravitational driving stress alone. We also assume ice thickness (H) to be constant. This approxi-mation works because changes in absolute thickness have an order of magnitude less effect on the driving stress than the surface slope changes over this period. These assumptions are made only in order to assess whether these changes in driving stress are sufficient to account for the rates of accel-eration observed over this portion of the ice stream. Substi-tuting Eqs. (3) into (2), differentiating with respect to time, and noting thatα≪1, we find
∂tu=D.u((n−1)/n).(∂tα), (4)
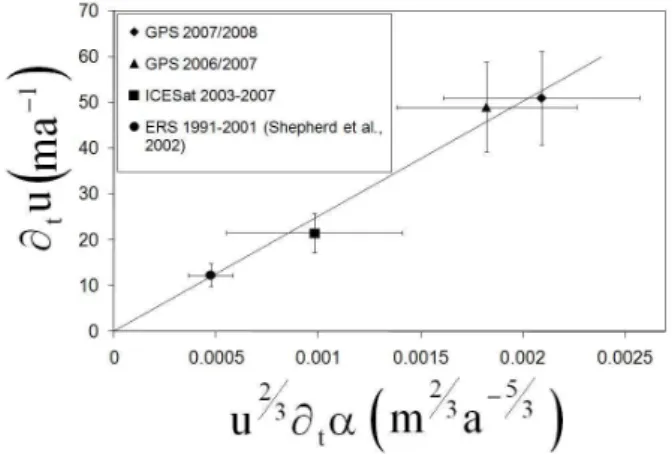
Fig. 3. Graph of ∂tu against u2/3∂tα. Average slope changes
for 1991-2001 from Shepherd et al. (2002) and for 2003–2007 from ICESat (Appendix A). With December 2006–February 2007 and November 2007–February 2008 calculated from GPS measure-ments. The black line is the best fit to the data.
where the constant,
D=n 2A
n+1(ρg)
n
W
2 n+1!
1
n
. (5)
The average rate of slope increase (∂tα)between the same
points for 1991–2001 was 0.60×10⁻⁵a−1 (from satellite radar altimetry: Shepherd et al., 2002) and for 2003–2007 was 1.15×10⁻⁵a−1(calculated by us from ICESat laser al-timetry data). For the periods over which we have GPS mea-surements, the directly calculated values of∂tuanducan be
used. For earlier periods the average rate of velocity increase (∂tu) can be estimated for the central point (PC111). This is
done by subtracting the annual percentage accelerations esti-mated by InSAR (Joughin et al., 2003; Rignot, 2006), and ac-counting for the fact that PC111 has had a lower percentage increase, at 6% less than PC55 over the 12-year period from 1996. Figure 3 shows the data, paired values of∂tu
plot-ted againstu2/3∂tα. The best fit givesD=25 400 (ma2)1/3
with anR2coefficient of determination of 0.99. When calcu-lated using the estimated values for ice stream width and the material parameters given above,D=27 600 (ma2)1/3. How-ever, this small difference is within the uncertainties in the parameters and could be achieved simply by changing W from 44 km to 41 km in Eqs. (4) and (5). The strength of the correlation with the acceleration (Fig. 3) is entirely due to the slope changes, and hence changes in gravitational driving stress, this is becauseu2/3increases by only 19% over this time period, which would not give a significant correlation, whilst∂tαincreases by 271%. We conclude that available
not need additional force balance changes from longitudi-nal stress gradients or basal drag. However, we cannot ne-glect the effect of perturbations in these stresses, particularly from the downstream end of PIG, which models have shown may initiate the related velocity changes and inland thinning (Payne et al., 2004; Thomas et al., 2004a).
6 Short term variations
Tidal analysis of horizontal and vertical displacements was performed using the software t tide (Pawlowicz et al., 2002) but, despite 2–3 months high-precision GPS records, no mea-surable tidally-induced variation in flow could be detected at any of the sites, including nearest to the grounding line at PC55. The lack of tidal velocity modulation gives more con-fidence in velocities estimated from InSAR processing and increases confidence that comparison of InSAR and GPS ve-locities is reasonable.
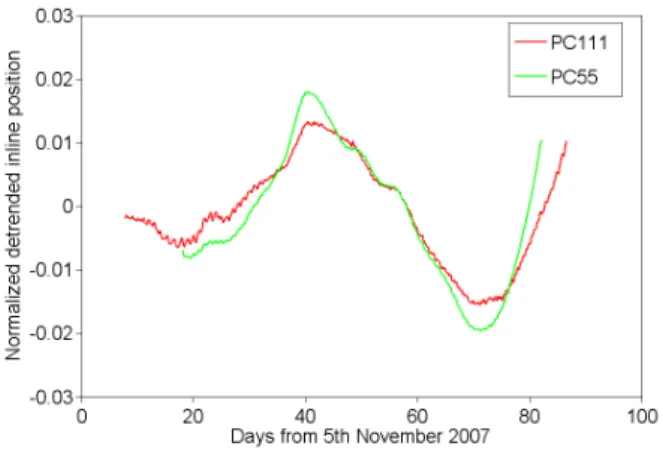
For the 2006/2007 season the accelerations at all sites were approximately constant; that is, after removing a constant ac-celeration component from the flow-direction displacements the residual displacements were around GPS error levels. However, for the 2007/2008 season, after removing a con-stant acceleration component, significant residuals remained at PC55 and PC111. Residuals at PC171 and PS169 were smaller than those at PC111 by a factor of 5, and than those at PC55 by a factor of 15. These residuals were therefore close to noise level, and along with the shorter observation periods at PC171, and PS169, meant that analysis was not possible. For easy comparison between PC55 and PC111, the residuals have been normalized by the total horizontal displacement at each station and are displayed in Fig. 4.
The short term changes at PC55 and PC111 are closely matched (Fig. 4). We cannot identify a phase-shift between the two curves due to GPS noise, hence the response effec-tively appears instantaneous. However, we estimate an un-certainty of two days. These short-term acceleration changes observed at PC55 and PC111 were not accompanied by any fluctuations in the vertical positions of the stations, signify-ing no coincident fluctuations in gravitational drivsignify-ing stress. However, there were fluctuations in the strain rate, and hence changes in the longitudinal stress gradient between the two stations, with the same time period as the fluctuations in ac-celeration observed individually at each station. Therefore these changes in acceleration have been transmitted instan-taneously by longitudinal stresses. The perturbations may originate from the grounding line, ice shelf or from changes in the basal conditions, including the movement of subglacial water. However, these fluctuations in the longitudinal stress gradient are at a lower order of magnitude than the longer term increases in driving stress.
Fig. 4. Horizontal inline flow-direction positions for PC55 and PC111 de-trended by a quadratic (constant acceleration component removed) and normalized by dividing by the total distance travelled in one day at each location.
7 Discussion
The GPS measurements reveal that the rates of acceleration experienced in 2007, which are higher than any previous measurements have shown on PIG, extend far inland. At the downstream end of PIG, the acceleration reached at least 6.4% a−1 in 2007, but it was also 4.8 and 4.1% a−1 at dis-tances of 111 and 171 km, from the grounding line, respec-tively. This upstream acceleration is at a greater percentage rate than any estimates prior to 2006 for the downstream end of the glacier (Rignot, 2006). The current high acceleration phase of PIG may have started in 2002, there is little accel-eration from 2001 to 2002 followed by very high accelera-tion from 2002 onwards (Rignot, 2006). But even if it started around 1996 (Joughin et al., 2003) and the perturbation caus-ing this acceleration originated at the downstream end of the glacier it is likely that it has been transmitted rapidly up-stream, by a diffusion process, faster than the 10 years per 100 km suggested by the model of Payne et al. (2004). The reduction in the percentage velocity increases, with distance upstream, suggests that the perturbation could originate at the downstream end of the glacier, but modelling is needed to verify this.
changes in the longitudinal stress gradients that are transmit-ted rapidly along the glacier causing fluctuations in the ac-celeration over short periods at sites 56 km apart. It is likely that perturbations transmitted initially by longitudinal stress gradients cause the acceleration inland (Payne et al., 2004; Thomas et al., 2004a).
8 Conclusions
The GPS measurements on PIG augment those obtained from remote sensing. They demonstrate that rates of thinning and acceleration are both increasing and that this extends at least 171 km inland. Acceleration is highly correlated to slope in-crease and no sustained inin-crease in longitudinal stress gradi-ent, or decrease in basal drag, is needed to explain the force balance. Transmission of the acceleration inland has been exceptionally fast at around 200 km per decade, or possibly even quicker. The results are consistent with the hypothesis that changes in PIG result from changes at the downstream end, including the grounding area and floating ice shelf. It appears that PIG is not only out of balance but continues to move further out of balance. If there is a feedback process, where downstream thinning causes further ungrounding and acceleration, then this could result in a major retreat of the ice stream.
Appendix A
Brief summary of ICESat processing
We use a 10 km radius around the GPS location to calculate the errors in the ICESat elevation change presented in this pa-per. This in every case incorporates several hundred ICESat elevation change values over the period 2003–2007 to give an average rate of change for this period. It makes the ICESat measurements more comparable with the previous ERS ele-vation change measurements, which have a much lower spa-tial resolution. Over this spaspa-tial range there is no bias caused by moving away from the glacier centerline. Therefore the errors are also valid when comparing the ICESat measure-ment to the current GPS measuremeasure-ments which are taken along the centerline.
We used ICESat GLA12 Release 28 data (Zwally et al., 2007) from 2003 up to November 2007. We fitted planar sur-faces to parallel tracks of point height and date measurements that are close in space (300 m) and time (2 years). We then differenced the height and date of later point measurements that overlap these interpolated surfaces, giving us1h/1t. We repeated this process for all possible combinations of in-terpolated and overlapping tracks that fit our criteria. We estimate the uncertainty in our1h/1t to be±0.07 ma−1at the 1-sigma level.
A1 Methods
A1.1 Interpolation
We used ICESat GLA12 Release 28 data (Zwally et al., 2007) (at the highest calibration level 4), for all available years from 2003 up to November 2007. To quantify elevation change, we began by grouping ICESat height measurements into two-year epochs (2003–2004, 2004–2005, 2005–2006 or 2006–2007). We interpolated surfaces between all ele-vation measurements in an epoch that have two neighbours lying within 300 m distance, using triangular irregular net-works (TINs). This ensures an interpolation distance never greater than 260 m, typically much shorter. For compari-son, crossover analysis interpolates over∼172 m and uses four points rather than our three. Our scheme produces long, ribbon-like, linearly-interpolated surfaces between closely-spaced, near-parallel tracks representing surface height for each epoch. To account for the difference in timing of the measurements, we performed the same interpolation on ac-quisition date.
Where these ribbon TINs were crossed by ground-track footprints from a later or earlier epoch, we extracted the interpolated elevation and acquisition date from the TIN at the new sample-point. This yields comparable elevation measurements: one interpolated, one measured precisely (crossover analysis compares pairs of interpolated heights), from which we calculated1h/1t. We repeated this for all possible date combinations forwards and backwards in time. The interval,1t, ranges from 1 to 4.5 years, mean 728 days over Antarctica. Within a given epoch, this approach as-sumes linear elevation change both spatially between adja-cent points, and through time. It sacrifices temporal resolu-tion to gain spatial coverage.
A1.2 Uncertainty estimate
Acknowledgements. This work was supported by the Natural Environment Research Council, Geophysical Equipment Facility (Loan 847). We thank Feargal Buckley, Chris Griffiths, Rob Smith and Roger Stilwell for assistance with the fieldwork.
Edited by: J. L. Bamber
References
Anandakrishnan, S., Voigt, D. E., Alley, R. B., and King, M. A.: Ice stream D flow speed is strongly modulated by the tide beneath the Ross Ice Shelf, Geophys. Res. Lett., 30, 1361, doi:10.1029/2002GL016329, 2003.
Bindschadler, R. A., King, M. A., Alley, R. B., Anandakrish-nan, S., and Padman, L.: Tidally controlled stick-slip dis-charge of a West Antarctic ice stream, Science, 301, 1087, doi:10.1126/science.1087231, 2003.
Dach, R., Beutler, G., and Gudmundsson, G. H.: Analysis of GPS data from an Antarctic ice stream, in: International Associa-tion of Geodesy Symposia, 133, Observing our Changing Earth, edited by: Sideris, M. G., Springer, Berlin Heidelberg, Germany, 569–579, doi:10.1007/978-3-540-85426-5 67, 2009.
Gudmundsson, G. H.: Tides and the flow of Rutford Ice Stream, West Antarctica, J. Geophys. Res., 112, F04007, doi:10.1029/2006JF000731, 2007.
Joughin, I., Rignot, E., Rosanova, C. E., Lucchitta, B. K., and Bohlander, J.: Timing of recent accelerations of Pine Island Glacier, Antarctica, Geophys. Res. Lett., 30, 1706, doi:10.1029/2003GL017609, 2003.
Paterson, W. S. B.: The Physics of Glaciers, Third Edition, Butterworth-Heinemann, Oxford, Great Britain, 1994.
Payne, A. J., Vieli. A., Shepherd, A. P., Wingham, D. J., and Rig-not, E.: Recent dramatic thinning of largest West Antarctic ice stream triggered by oceans, Geophys. Res. Lett., 31, L23401, doi:10.1029/2004GL021284, 2004.
Pawlowicz, R., Beardsley, B., and Lentz, S.: Harmonic analysis including error estimates in MATLAB using T TIDE, Comput. Geosci., 28, 929–937, 2002.
Rignot, E.: Fast recession of a West Antarctic Glacier, Science, 281, 549–551, 1998.
Rignot, E.: Changes in ice dynamics and mass balance of the Antarctic ice sheet, Phil. Trans. R. Soc. A, 364, 1637–1655, doi:10.1098/rsta.2006.1793, 2006.
Rignot, E.: Changes in West Antarctic ice stream dynamics ob-served with ALOS PALSAR data, Geophys. Res. Lett., 35, L12505, doi:10.1029/2008GL033365, 2008.
Rignot, E., Vaughan, D. G., Schmeltz, M., Dupont, T., and MacAyeal, D.: Acceleration of Pine Island and Thwaites Glaciers, West Antarctica, Ann. Glaciol., 34, 189–193, 2002. Shepherd, A., Wingham, D. J., and Mansley, J. A. D.: Inland
thin-ning of the Amundsen Sea sector, West Antarctica, Geophys. Res. Lett., 29, 1364, doi:10.1029/2001GL014183, 2002. Thomas, R., Rignot, E., Kanagaratnam, P., Krabill, W., and Casassa,
G.: Force-peturbation analysis of Pine Island Glacier, Antarctica, suggests cause for recent acceleration, Ann. Glaciol., 39, 133– 138, 2004a.
Thomas, R., Rignot, E., Casassa, G., Kanagaratnam, P., Acu˜na, C., Akins, T., Brecher, H., Frederick, E., Gogineni, P., Krabill, W., Manizade, S., Ramamoorthy, H., Rivera, A., Russell, R., Sonntag, J., Swift, R., Yungel, J., and Zwally, J.: Accelerated Sea-Level Rise from West Antarctica, Science, 306, 255–258, doi:10.1126/science.1099650, 2004b.
Van der Veen, C. J.: Fundamentals of Glacier Dynamics, A. A. Balkema, Rotterdam, Netherlands, 1999.