This article analyses characteris-tics of 25 rivers of the Gulf of Fin-land basin where the monitoring of the streamflow chemical composition was performed. The authors consider the dynamics of biogenic element content in the streamflow, the rela-tion of the drainage areas to certain landscapes, the share of agricultural lands and tillage in the drainage are-as, the forest-land percentage, a ru-ral population density, and the forest age and type.
Key words: drainage area, land-scape composition, share of agricul-tural lands, percentage of tillage, forest-land percentage, density of rural population, forest age and type, biogenic element concentration dy-namics
An important feature of the Baltic Sea basin is the abundance of flowing water body systems connected by watercourses. The ecosystem of flowing water bodies transforms the chemical composition of the river flow.
The anthropogenic discharge of biogenic elements combines with the bi-ogenic element inflow from natural landscapes. Thus, in order to indentify the ecologically justified norms of anthropogenic pressure on water bodies, one should take into account the intra-annual natural dynamics of biogenic element discharge. To this effect, we will focus on the dynamics of dis-charge composition and the structure of drainage basins.
We used the data of the Federal Service for Hydrometeorology and Environmental Monitoring for the 1950s—1980s. The monitoring sites were chosen according to the following criteria:
— the absence of anthropogenic regulation of the river;
— maximum homogeneity of a landscape drainage basin structure; — a small degree of anthropogenic transformation of the drainage basin;
— continuous monitoring over at least ten years. We chose 25 out of 115 possible monitoring sites.
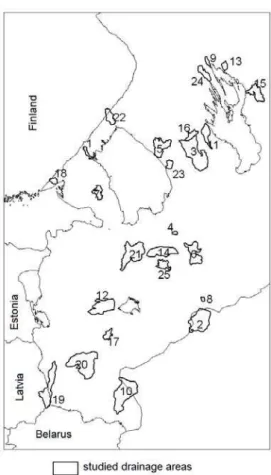
The scheme of drainage area locations and the monitoring sites is pre-sented in figure 1.
Viktor Tretyakov
Denis Seleznev
THE CHARACTERISTICS OF THE BIOGENIC ELEMENT OF THE RUNOFF FROM THE DRAINAGE AREAS OF THE GULF
OF FINLAND BASIN
Fig. 1. A scheme of the drainage basins of the rivers studied:
1 — Asilankoji; 2 — Berezaika; 3 — Vazhina; 4 — Valya; 5 — Vidlitsa;
6 — Volozhba; 7 — Volchya; 8 — Golokhovka; 9 — Kumsa; 10 — Kunya;
11 — Lososinka; 12 — Mshaga; 13 — Nemina; 14 — Pchyvzha; 15 — Pyalma;
16 — Svyatreka; 17 — Severka; 18 — Seleznyovka; 19 — Sinyaya; 20 — Sorot;
21 — Tigoda; 22 — Tohmajoki; 23 — Tuksa; 24 — Unitsa; 25 — Sharya
Year
a
Year
b
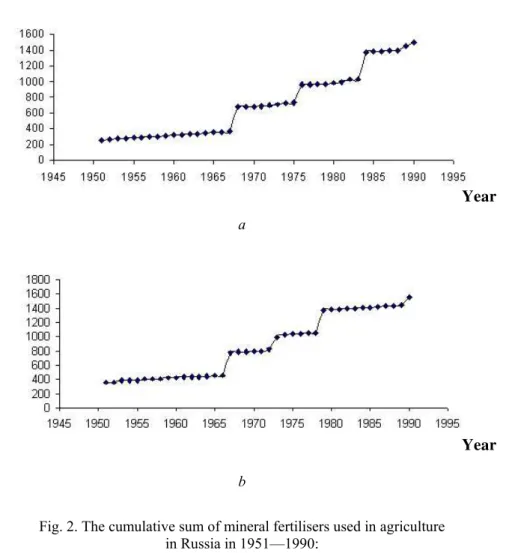
Fig. 2. The cumulative sum of mineral fertilisers used in agriculture in Russia in 1951—1990:
a — nitrogen fertilisers, b — phosphorus fertiliser
In order to prove this assumption, we calculated the values of coeffi-cients of pair correlations between the average annual content of biogenic elements in the river flow for the given year and the amount of fertilisers used in agriculture during that particular year and the previous ones. In most cases a pair correlation coefficient module of less than 0.5 indicated weak connection between the amount of fertiliser and the content of biogenic ele-ments of the rivers studied.
Year
a
Year
b
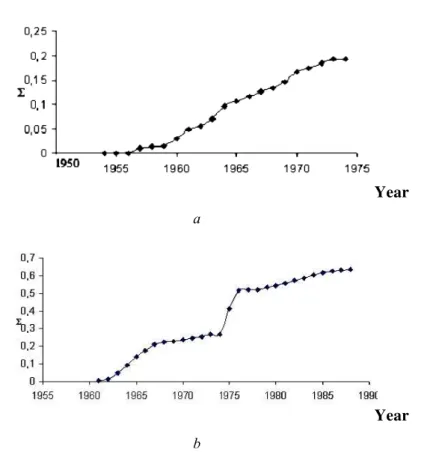
Fig. 3. The examples of charts based on the cumulative sum method for the cases of stable and significantly altered average annual content (the Lososinka (a)
and the Sharya (b) riversrespectively)
Consequently, no changes in the concentration of biogenic elements in the waters of the studied rivers over the period under consideration have been detected. The shifts in the charts of cumulative sums of the average an-nual biogenic element concentrations took place only in those years when only a couple of measurements were performed in the high-water period.
In order to determine the degree of anthropogenic pressure on the drain-age basin territory, we calculated the coefficient of anthropogenic pressure according to the formula devised by Prof. G.T. Frumin [7; 8]. The results are given in the table below.
The coefficient of anthropogenic pressure on the drainage areas
River Population density, people/km2
Anthropogenic pressure coefficient
Asilankoji 5 0.46
Berezaika 5 0.46
Vazhina 5 0.46
End of the table
River Population density, people/km2
Anthropogenic pressure coefficient
Vidlitsa 5 0.46
Volozhba 7 0.62
Volchya 10 0.85
Golokhovka 5 0.46
Kumsa 5 0.46
Kunya 10 0.85
Lososinka 5 0.46
Mshaga 5 0.46
Nemina 5 0.46
Pchyvzha 7 0.62
Pyalma 5 0.46
Svyatreka 5 0.46
Severka 10 0.85
Seleznyovka 5 0.46
Sinyaya 10 0.85
Sorot 10 0.85
Tigoda 7 0.62
Tohmajoki 5 0.46
Tuksa 5 0.46
Unitsa 5 0.46
Sharya 5 0.46
In most cases, the coefficient of anthropogenic pressure is less than 0.5 and in all cases it is below 1.0. It means that the anthropogenic pressure on the drainage areas is below and, in most cases, 1.5—2 times less the world average. We compared the concentrations of biogenic elements in the rivers under consideration and the rivers which drainage areas are exposed to significant anthropogenic stress: the Velikaya and the Luga rivers. The law of biogenic element distribution in the waters of these rivers is close to nor-mal. Applying the Student's distribution, the Fisher's exact test, and the Siegel-Tukey and Mann—Whitney—Wilcoxon test, we compared the bio-genic element content in all 25 rivers with that of the Velikaya and the Luga. In all cases we detected a significant difference in the content of biogenic elements between each of the studied rivers, and the Velikaya and the Luga rivers. Thus, one can assume that the anthropogenic pressure on the chosen drainage areas is much lower than the pressure on the drainage areas of the Velikaya and the Luga.
In order to identify the anthropogenic component of the studied river flow, we used the values of background concentrations from the following sources [2; 3; 5]. The concentration of biogenic elements in the rivers stud-ied does not exceed the background levels. There are several exceptions re-lating the samples taken during flood periods, when the inflow of biogenic elements increases within all, including unimpaired, drainage areas.
software on the maps of landscape provinces of the North-West, the share of agricultural lands, the share of tillage areas, the forest land percentage by geographical mesoregions and timber industry facilities, and the forest age and type [1].
We identified the following features of the drainage areas. The Karelian south taiga subprovince includes the drainage areas of the Seleznyovka, the Asilanjoki, and the Volchya rivers; the Karelian middle taiga subprovince — the drainage areas of the Vidlitsa, the Nemina, the Kumsa, the Lososinka, the Pchyovzha, the Tohmajoki, the Unitsa, the Tuksa, the Pyalma, and the Svyatreka rivers; the north-western south taiga subprovince — the drainage areas of the Mshaga, the Volozhba, the Tigoda, the Sharya, the Vazhina, the Valya, and the Golokhvka rivers; the north-western sub-taiga subprovince — of the Sorot, the Severka, the Sinyaya, the Berezaika, and the Kunya rivers.
In most cases, the drainage basins are characterised by an insignificant degree of agricultural cultivation (not more than 20%), except the drainage basins of the Kunya, the Sinyaya, the Sorot, the Severka, and, partially, the Mshaga rivers. The volume of the biogenic elements discharge is in direct proportion to the share of agricultural lands [6]. The share of agricultural lands does not exceed 40% in the studied drainage basins.
The cartographical analysis of the forest land percentage of the drainage areas was carried out on the basis of the forest land maps by mesoregions and on the basis of timber industry enterprises [1]. The greater part of the drainage basins is characterised by a high percentage of forest lands — not less than 50%. Exceptions are the drainage basins of the Sorot, the Sinyaya, the Kunya, and, partially, the Severka rivers.
The share of tillage lands does not exceed 10% in most studied drain-age areas, except those of the Sorot, the Sinyaya, the Severka, the Kunya, and, partially, the Mshaga rivers, where the share of tillage lands does not exceed 20%.
Young or mature coniferous species prevail in most drainage basins, ex-cept those of the Mshaga, the Severka, the Berezaika, the Golokhovka, the Tigoda, and, partially, the Sorot and the Pchyovzha rivers.
We divided the drainage basins into several groups according to the fol-lowing parameters: 1) association with one landscape province; 2) forest land percentage; 3) the share of agricultural lands; 4) the share of tillage lands; 5) the density of rural population; 6) the age of forests; 7) the prevail-ing tree species.
References
1. Isachenko, A. G. 1995. Jekologicheskaja geografija Severo-Zapada. Part. 2. St. Petersburg.
2. Kondratiev, S. A. 2007. Formirovanie vneshnej nagruzki na vodoemy: prob-lemy modelirovanija. St. Petersburg.
3. Kondratiev, S. A. 2008. Matematicheskoe modelirovanie formirovanija na-gruzki na Finskij zaliv: Materialy IX mezhdunarodnoj konferencii «Dni Baltijskogo morja». St. Petersburg.
4. Nikanorov, A. M. 2001. Gidrohimija. St. Petersburg.
5. Primak, E. A. 2009. Integral'naja ocenka ustojchivosti i jekologicheskogo blagopoluchija vodnyh obektov: dis. … kand. geogr. nauk. St. Petersburg.
6. Hrisanov, N. I., Osipov, G. K. 1993. Upravlenie jevtrofirovaniem vodoemov. St. Petersburg.
7. Frumin, G. T., Obrazcova, A. B. 2004. Antropogennye nagruzki na vodosbory Baltijskogo morja: Materialy nauchnoj konferencii «AkvaTerra-2004». St. Peters-burg.
8. Frumin, G. T., Stepanova, E. V. 2009. Fonovye koncentracii biogennyh jele¬mentov v rekah bassejna Baltijskogo morja: Materialy V mezhdunarodnoj kon-ferencii «Jekologicheskie i gidrometeorologicheskie problemy gorodov i pro-myshlennyh zon», 7—9 ijunja 2009 goda. St. Petersburg.
About authors
Dr Viktor Tretyakov, Associate Professor, Department of Geoecology and Na-ture Management, St. Petersburg State University, Department of Applied Ecology, Russian State Hydrometeorological University.
E-mail: v_yu_tretyakov@mail. ru