ACPD
15, 21095–21132, 2015Carbonyl sulfide exchange in soils for
better estimates of ecosystem carbon
uptake
M. E. Whelan et al.
Title Page
Abstract Introduction
Conclusions References
Tables Figures
◭ ◮
◭ ◮
Back Close
Full Screen / Esc
Printer-friendly Version
Interactive Discussion
Discussion
P
a
per
|
Discussion
P
a
per
|
Discussion
P
a
per
|
Discussion
P
a
per
|
Atmos. Chem. Phys. Discuss., 15, 21095–21132, 2015 www.atmos-chem-phys-discuss.net/15/21095/2015/ doi:10.5194/acpd-15-21095-2015
© Author(s) 2015. CC Attribution 3.0 License.
This discussion paper is/has been under review for the journal Atmospheric Chemistry and Physics (ACP). Please refer to the corresponding final paper in ACP if available.
Carbonyl sulfide exchange in soils for
better estimates of ecosystem carbon
uptake
M. E. Whelan1,2, T. W. Hilton1, J. A. Berry2, M. Berkelhammer3, A. R. Desai4, and
J. E. Campbell1
1
University of California, Merced, Merced, CA, USA
2
Carnegie Institution for Science, Stanford, CA, USA
3
University of Illinois Chicago, Chicago, IL, USA
4
University of Wisconsin, Madison, WI, USA
Received: 7 June 2015 – Accepted: 29 June 2015 – Published: 6 August 2015
Correspondence to: M. E. Whelan ([email protected])
ACPD
15, 21095–21132, 2015Carbonyl sulfide exchange in soils for
better estimates of ecosystem carbon
uptake
M. E. Whelan et al.
Title Page
Abstract Introduction
Conclusions References
Tables Figures
◭ ◮
◭ ◮
Back Close
Full Screen / Esc
Printer-friendly Version
Interactive Discussion
Discussion
P
a
per
|
Discussion
P
a
per
|
Discussion
P
a
per
|
Discussion
P
a
per
|
Abstract
Carbonyl sulfide (COS) measurements are one of the emerging tools to better quantify gross primary production (GPP), the largest flux in the global carbon cycle. COS is a gas with a similar structure to CO2; COS uptake is thought to be a proxy for GPP. However, soils are a potential source or sink of COS. This study presents a framework
5
for understanding soil-COS interactions. Excluding wetlands, most of the few observa-tions of isolated soils that have been made show small uptake of atmospheric COS. Recently, a series of studies at an agricultural site in the central United States found soil COS production under hot conditions an order of magnitude greater than fluxes at other sites. To investigate the extent of this phenomenon, soils were collected from 5
10
new sites and incubated in a variety of soil moisture and temperature states. We found that soils from a desert, an oak savannah, a deciduous forest, and a rainforest exhibited small COS fluxes, behavior resembling previous studies. However, soil from an agricul-tural site in Illinois,>800 km away from the initial central US study site, demonstrated comparably large soil fluxes under similar conditions. These new data suggest that, for
15
the most part, soil COS interaction is negligible compared to plant uptake of COS. We present a model that anticipates the large agricultural soil fluxes so that they may be taken into account. While COS air-monitoring data are consistent with the dominance of plant uptake, improved interpretation of these data should incorporate the soil flux parameterizations suggested here.
20
1 Introduction
As anthropogenic CO2 emissions continue increasing, it is necessary to character-ize the partitioning of carbon exchange between atmospheric and terrestrial ecosys-tem reservoirs to predict future CO2concentrations in the atmosphere (Wofsy, 2001).
Large uncertainties remain in estimates of the amount of carbon removed from the
25
ACPD
15, 21095–21132, 2015Carbonyl sulfide exchange in soils for
better estimates of ecosystem carbon
uptake
M. E. Whelan et al.
Title Page
Abstract Introduction
Conclusions References
Tables Figures
◭ ◮
◭ ◮
Back Close
Full Screen / Esc
Printer-friendly Version
Interactive Discussion
Discussion
P
a
per
|
Discussion
P
a
per
|
Discussion
P
a
per
|
Discussion
P
a
per
|
(GPP). This quantity is essential for describing carbon-climate feedbacks and assess-ing ecosystem-based CO2capture and storage projects. Using measurements of
car-bonyl sulfide is one of several emerging approaches to address large uncertainties in GPP estimates (Berry et al., 2013; Campbell et al., 2008; Commane et al., 2013; Montzka et al., 2007; Seibt et al., 2010; Stimler et al., 2011; Suntharalingam et al.,
5
2008). With a globally averaged tropospheric concentration of 500±100
parts-per-trillion (ppt) (Montzka et al., 2007), COS is the most abundant sulfur-containing gas in Earth’s atmosphere. Both COS and CO2enter a plant through leaf stomata. Whereas
some CO2is released again in back-diffusion or in respiration, COS is irreversibly
de-stroyed by the enzyme carbonic anhydrase (Protoschill-Krebs et al., 1996; Schenk
10
et al., 2004). Soil COS fluxes potentially introduce large uncertainties in estimating the COS leaf uptake flux from atmospheric COS measurements (Maseyk et al., 2014). To date only three published studies have attempted to use COS concentrations to calculate GPP over individual ecosystems (Asaf et al., 2013; Billesbach et al., 2014; Blonquist et al., 2011). The calculation is performed using this relationship:
15
FCOS,leaf=GPP[COS][CO2]−1v(p,i,w) (1)
FCOS,leaf is the one-way flux of COS into plant leaves in pmol m−2s−1, GPP is the CO
2
assimilation by plants in µmol m−2s−1, [COS] and [CO2] are ambient gas concentra-tions in parts-per-trillion (ppt) and parts-per-million (ppm) respectively, and the factor
v is the experimentally determined ratio of deposition velocities for COS and CO2, 20
a function of plant typep, radiationi, and water stressw.
Many of the plant physiological requirements involved in using COS fluxes as a GPP proxy have been empirically investigated. Stimler et al. (2010) confirmed the assump-tions about in-leaf processes and COS : CO2 exchange that need to be met to use COS as a tracer for GPP, i.e. COS co-diffuses with CO2via the same pathway in plant 25
leaves, COS and CO2 do not inhibit one another at reaction sites with carbonic
ACPD
15, 21095–21132, 2015Carbonyl sulfide exchange in soils for
better estimates of ecosystem carbon
uptake
M. E. Whelan et al.
Title Page
Abstract Introduction
Conclusions References
Tables Figures
◭ ◮
◭ ◮
Back Close
Full Screen / Esc
Printer-friendly Version
Interactive Discussion
Discussion
P
a
per
|
Discussion
P
a
per
|
Discussion
P
a
per
|
Discussion
P
a
per
|
For the most part, using COS to predict GPP on the leaf-level was comparable to other methods like C18OO exchange (Seibt et al., 2010; Stimler et al., 2011).
However, a problem arises when the COS : CO2 scheme is applied to an
ecosys-tem beyond the leaf scale. The uptake ratio is called an ecosysecosys-tem relative uptake (ERU) when the observation scale encompasses plants and soils (Campbell et al.,
5
2008) or a soil relative uptake (SRU) when soils are observed or modeled apart from plant systems (Berkelhammer et al., 2014). Empirical measurements of ERU deviate from the value of 3 (Sandoval-Soto et al., 2005) when processes other than photosyn-thesis dominate trace gas exchange over an ecosystem (Seibt et al., 2010). In these cases, it is assumed that a missing source or sink of COS or CO2exchange is present
10
in the system. At continental scales, anthropogenic sources must be taken into ac-count (Campbell et al., 2015). In many natural ecosystems, COS exchange by soils contributes to variations in ERU.
Soils in terrestrial biomes usually exhibit low COS exchanges compared to uptake by plants (see review in Whelan et al., 2013). Uncoordinated, individual studies have
15
been undertaken that incidentally quantified soil COS exchange in a limited number of biomes, often with few soil-focused measurements.
The characterization of soil COS exchange should improve the use of COS observa-tions as a GPP proxy. Here, to better understand soil COS exchange, we collected soil samples from multiple biomes and assessed their COS fluxes in a controlled setting
20
using dynamic incubation chambers. We further develop a framework for interpreting and anticipating soil COS fluxes based on empirical data and gas exchange theory. This model can inform the design of much needed future field experiments.
2 Methods
Soil samples were acquired from agricultural, forest, desert, and savannah sites
(Ta-25
ACPD
15, 21095–21132, 2015Carbonyl sulfide exchange in soils for
better estimates of ecosystem carbon
uptake
M. E. Whelan et al.
Title Page
Abstract Introduction
Conclusions References
Tables Figures
◭ ◮
◭ ◮
Back Close
Full Screen / Esc
Printer-friendly Version
Interactive Discussion
Discussion
P
a
per
|
Discussion
P
a
per
|
Discussion
P
a
per
|
Discussion
P
a
per
|
0.0225 m2 representative sites were selected, one adjacent to the biome’s predomi-nant vegetation, the other a meter away. The litter layer was removed and reserved separately. Soil was then excavated from the top 0.05 m of a 0.01 m2 area, double bagged, and shipped overnight to the Carnegie Institution for Science in Stanford, CA for analysis. The Peruvian rainforest sample was an amalgamation of soils from the
5
top 0.05 m of several sites, collected by auger from the Los Amigos Biological Station in Peru. These soils were air dried, then combined before analysis. Bulk density and soil moisture content for all soils were determined by gravimetric methods. Soil pH was measured with a Corning Pinnacle 530 pH meter (Xylem Inc. White Plains, NY). Locations of sites are shown in Fig. 2.
10
Sites were selected to capture variability between biomes and address data needs. The Bondville site is an agricultural research station that was rotated between soybean and corn crops; at the time of sampling, soybeans were planted, but soil contained corn litter. The Stunt Ranch Fluxnet site, an oak savannah, and the Boyd Deep Canyon Reserve, to our knowledge the first desert soil investigated for COS exchange, are
15
both located within and managed by the University of California Reserve System. The Willow Creek mature forest, Bondville Fluxnet and Southern Great Plains ARM sites are within the footprints of COS air-monitoring sites that include tall tower and airborne platforms (Montzka et al., 2007). Soil temperature and soil moisture variability for all sites is presented in Fig. 1.
20
Soil subsamples were placed in individual solid PFA 1 L chambers (Savillex) and weighed. Following Van Diest and Kesselmeier (2008), 75 to 80 g soil samples were used to reduce the presence of concentration gradients in the soil profile during dy-namic incubation experiments. One soil subsample from the agricultural site was wet filtered through a 53 µm sieve to remove the sand-sized soil fraction before incubation.
25
ACPD
15, 21095–21132, 2015Carbonyl sulfide exchange in soils for
better estimates of ecosystem carbon
uptake
M. E. Whelan et al.
Title Page
Abstract Introduction
Conclusions References
Tables Figures
◭ ◮
◭ ◮
Back Close
Full Screen / Esc
Printer-friendly Version
Interactive Discussion
Discussion
P
a
per
|
Discussion
P
a
per
|
Discussion
P
a
per
|
Discussion
P
a
per
|
2.1 Determination of soil COS exchange
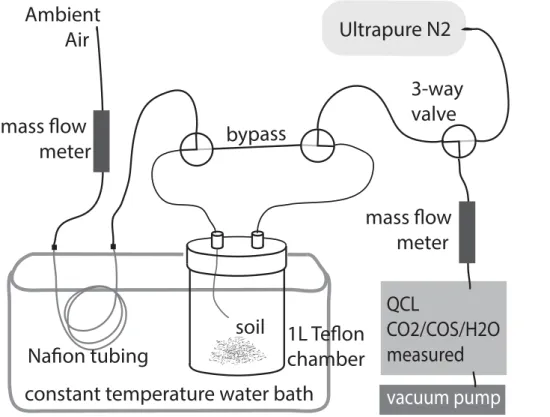
Soil fluxes of COS were determined using a dynamic, flow-through chamber ap-proach. A commercially-available Aerodyne quantum cascade laser (QCL, Aerodyne Research, Inc., Billerica, MA, US) was used to quantify COS and CO2concentrations in the effluent of a laboratory-based apparatus (Fig. 3). Fluxes were calculated using
5
an equation adapted from de Mello and Hines (1994):
F =V(Cf−Ci)m− 1
soil (2)
F is the COS or CO2 exchange rate in pmol gas min−1g dry soil−1. Ci is the mixing ratio of the compound entering the chamber, determined by analyzing the gas stream bypassing the chamber headspace. Cf is the concentration of the compound exiting 10
the 1 L PFA chamber headspace.V represents the sweep rate of the total air through the chamber, measured by the mass flow meter upstream of the QCL and converted to pmol min−1. The valuemsoilis the amount of dry soil enclosed inside the chamber in
g. The flow of the system was driven by a vacuum pump downstream of the QCL. The instrument also measured H2O and applied a correction for water vapor. Some of the
15
CO2fluxes were uninterpretable because of variations in ambient CO2concentrations,
Ci. CO2fluxes that could not be distinguished from 0 are graphically presented at 0.
EachF quantification is generated from 80 min of 1 Hz air analysis. To promote soil equilibration within a dynamic headspace, air flow was directed through the chamber and the effluent analyzed for 40 min. Before and after each chamber measurement,
20
ambient air and nitrogen gas were each analyzed for 10 min to check for baseline stability. The average COS reported over the last several minutes of chamber flow-through and bypass were corrected for instrument drift using the drift in the nitrogen (COS-free) signal, then used as Cf and Ci, respectively, in Eq. (2). COS fluxes are reported in pmol COS per gram of dry weight soil per minute (pmol COS g−1min−1);
25
ACPD
15, 21095–21132, 2015Carbonyl sulfide exchange in soils for
better estimates of ecosystem carbon
uptake
M. E. Whelan et al.
Title Page
Abstract Introduction
Conclusions References
Tables Figures
◭ ◮
◭ ◮
Back Close
Full Screen / Esc
Printer-friendly Version
Interactive Discussion
Discussion
P
a
per
|
Discussion
P
a
per
|
Discussion
P
a
per
|
Discussion
P
a
per
|
The temperature of the chamber was manipulated from 10 to 40◦C with a constant
temperature water bath. For higher temperature observations of soil fluxes from the soy field soil, the incubation chamber was placed in a container of water on a hotplate. The actual soil temperature was recorded by a small, self-contained temperature data logger with a stainless steel outer casing (iButtons, Maxim Integrated, San Jose, CA,
5
US). In order to prevent the soil from drying out during the analysis, a length of Nafion tubing was placed upstream of the chamber inside a container of distilled water in the same water bath. Even with this precaution, soil samples still dried slightly during the experiment. Samples were weighed daily, and soil moisture content was altered or maintained by adding distilled water. When water content was changed, soil samples
10
were held at 20◦C and COS flux observations continued for at least 12 h.
2.2 Scaling laboratory COS measurements to compare to field observations
Performing soil incubation experiments allowed for precise manipulation of environ-mental variables to reveal underlying patterns in soil COS exchange. Soil in situ has an important dimension not represented by these laboratory experiments: depth.
15
Nonetheless, it would be enlightening to compare controlled experiments to data col-lected in the field, despite that data from this study could represent COS exchange from only the top layer of soil.
A further experiment was performed to estimate the relationship between laboratory, per-gram measurements and field, per-area measurements. Soy field soil was
gradu-20
ally added to a 20◦C incubation chamber, starting with 50 g and increasing to 300 g. While the total COS emissions increased with every soil addition, the flux per gram soil increased linearly between 50 and 100 g, then demonstrated saturation behavior with samples greater than 100 g. Thus, all fluxes were scaled up to 100 g and assumed to represent a soil footprint equal to the area of the incubation chamber base, 0.00779 m2.
25
In short, fluxes were multiplied by a factor of (100 g) (0.00779 m−2) (60 s min−1)−1 or
ACPD
15, 21095–21132, 2015Carbonyl sulfide exchange in soils for
better estimates of ecosystem carbon
uptake
M. E. Whelan et al.
Title Page
Abstract Introduction
Conclusions References
Tables Figures
◭ ◮
◭ ◮
Back Close
Full Screen / Esc
Printer-friendly Version
Interactive Discussion
Discussion
P
a
per
|
Discussion
P
a
per
|
Discussion
P
a
per
|
Discussion
P
a
per
|
2.3 Modeling patterns in COS soil fluxes
The total net COS flux observed from the soils is thought to be the combination of abiotic and biotic fluxes.
FCOS,soil=FCOS,biotic+FCOS,abiotic (3)
FCOSis the net flux of COS, whereasFCOS,bioticandFCOS,abioticrepresent the contribution
5
of biotic and abiotic processes, respectively. The flux units used here were transformed as described in Sect. 2.2 from pmol COS min−1g dry soil−1 to pmol COS m−2s−1. Two models were fitted to soy field COS soil flux observations to explain FCOS,biotic and
FCOS,abiotic separately. First, dry agricultural soil COS measurements were described
using an exponential equation, as in Maseyk et al. (2014).
10
FCOS,abiotic=αexp(βTsoil) (4)
whereTsoil was the temperature of the soil in ◦C, and α and β were parameters
de-termined using the least-squares fitting approach. These driest measurements were assumed to represent the observable fluxes with the least influence from microbial up-take of COS while keeping the soil in tact. The abiotic flux contribution expressed by
15
Eq. (4) was calculated for all soy field soil incubation experiments, then subtracted from their respectiveFCOS,soilobservations to yieldFCOS,biotic, as in Eq. (3).
To explain FCOS,biotic, we used a model that was originally developed for soil NO
production in Behrendt et al. (2014). Previous work (Van Diest and Kesselmeier, 2008) had used a similar NO soil flux model. The overall form of the equation is the product
20
of a power function and an exponential function, Eqs. (5) and (6).
a=ln Fopt
Fθg !
ln θopt
θg !
+ θg
θopt
−1
!!−1
(5)
FCOS,biotic=Fopt
θi
θopt
!a
exp −a θi θopt−1
!!
ACPD
15, 21095–21132, 2015Carbonyl sulfide exchange in soils for
better estimates of ecosystem carbon
uptake
M. E. Whelan et al.
Title Page
Abstract Introduction
Conclusions References
Tables Figures
◭ ◮
◭ ◮
Back Close
Full Screen / Esc
Printer-friendly Version
Interactive Discussion
Discussion
P
a
per
|
Discussion
P
a
per
|
Discussion
P
a
per
|
Discussion
P
a
per
|
Here a was the curve shape constant,Fopt andFθg were the COS fluxes (pmol COS m−2s−1) at soil moisturesθoptandθg (percent volumetric water content, % VWC),Fopt
was the maximum biotic COS uptake, andθopt> θg.FCOS,biotic is the COS uptake for a given soil moistureθi after subtracting FCOS,abiotic within the specified temperature
range. The two models forFCOS,bioticand FCOS,abiotic could then be used to predict soil 5
COS fluxes for a given temperature and soil moisture condition.
2.4 Assessing the importance of soil COS fluxes to the GPP proxy
Ecosystem COS flux,FCOS,ecosystem, is the sum of leaf COS uptake, FCOS,leaf and soil
COS exchangeFCOS,soil. Two approaches were used to explore the error introduced by
calculating GPP from ecosystem COS exchange without correcting forFCOS,soil.
10
The first method sought to calculate temporal variability in the relative importance ofFCOS,soil. We used GPP estimates for the soy field FLUXNET site (US-Bo1) based
on half-hourly CO2 eddy flux covariance measurements and a respiration model (Re-ichstein et al., 2005), restricted to values greater than 25 µmol CO2m−
2
s−1. FCOS,leaf
was anticipated from these reported GPP values, using Eq. (1) with relative uptake
15
of 1.8 (Stimler et al., 2011), ambient concentration of CO2 at 380 ppm and of COS at 500 ppt. The model described in Sect. 2.3 was used to generateFCOS,soilestimates
from field soil moisture and temperature data collected at the site. Estimates ofFCOS,leaf
and FCOS,soil were then added together and used to calculate new GPP estimates with Eq. (1). The difference between the reported GPP estimates and estimates
us-20
ingFCOS,ecosystem instead ofFCOS,leafin Eq. (1) was then evaluated.
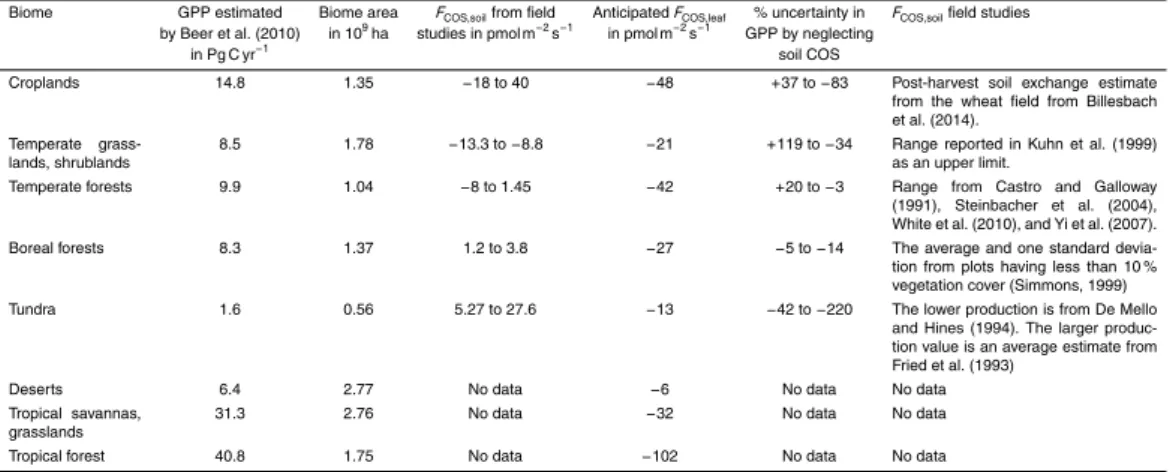
Secondly, we examined the spatial importance of reported FCOS,soil from the few values reported in the literature, relying on a similar conceit as the global calculation above. Using the biome GPP estimates from Beer et al. (2010), we back calculated anticipated estimates ofFCOS,leafusing Eq. (1). For this purposefully simple calculation, 25
ACPD
15, 21095–21132, 2015Carbonyl sulfide exchange in soils for
better estimates of ecosystem carbon
uptake
M. E. Whelan et al.
Title Page
Abstract Introduction
Conclusions References
Tables Figures
◭ ◮
◭ ◮
Back Close
Full Screen / Esc
Printer-friendly Version
Interactive Discussion
Discussion
P
a
per
|
Discussion
P
a
per
|
Discussion
P
a
per
|
Discussion
P
a
per
|
obviously does not represent the diversity of biome carbon assimilation patterns. For each biome where data existed, a range of FCOS,ecosystem was calculated as the
esti-matedFCOS,leaf added to the range of reportedFCOS,soil from previous studies. A GPP
estimate was then made using Eq. (1) withFCOS,ecosystemin place ofFCOS,leaf. The per-centage difference between the GPP estimate in Beer et al. (2010) and this new GPP
5
estimate was then evaluated.
3 Results
With the exception of the soy field sample, soils investigated here exhibited net COS exchange rates constrained near 0, ranging from −8 to +8 pmol COS m−2s−1,
com-pared to leaf uptake rates of−27 to−42 pmol COS m−2s−1(Stimler et al., 2011). The
10
overall patterns of COS exchange over temperature and soil moisture gradients are de-scribed in Sect. 3.1. The soil samples from the soy field had the highest overall fluxes: the biotic and abiotic components of these fluxes are investigated in Sect. 3.2.
3.1 COS soil flux observations
Overall, desert and rainforest samples had the smallest magnitude net COS exchange
15
rates. The temperate forest samples showed the largest net uptake during the first trials, when the soil sample was at field soil moisture, 41 % VWC. Of the small fluxes presented in Fig. 4, temperate forest soils also had the largest net production when the soil sample was in its hottest and driest state (Fig. 4b, 38◦C and 5 % VWC). Samples from the oak savannah displayed variable fluxes (Fig. 4c). Observations with the soy
20
field soil generated mostly net production of COS, often 10 times greater than fluxes from other soil samples (Fig. 5).
Regardless of sign, COS fluxes increased with temperature (Figs. 4 and 5). Soils incubated at 40◦C exhibited net COS production while incubations at 10◦C yielded net COS consumption in a majority of cases. Except for the desert site, the areas where
ACPD
15, 21095–21132, 2015Carbonyl sulfide exchange in soils for
better estimates of ecosystem carbon
uptake
M. E. Whelan et al.
Title Page
Abstract Introduction
Conclusions References
Tables Figures
◭ ◮
◭ ◮
Back Close
Full Screen / Esc
Printer-friendly Version
Interactive Discussion
Discussion
P
a
per
|
Discussion
P
a
per
|
Discussion
P
a
per
|
Discussion
P
a
per
|
these soils were collected rarely experienced such high maximum soil temperatures, if at all (Fig. 1).
The temperate forest showed the highest CO2 fluxes, with increasing fluxes for
in-creasing temperatures and soil moisture (Fig. 4e), contrasted by the small fluxes from the rainforest and desert soils (Fig. 4d). The savannah soils exhibited an optimum
tem-5
perature for CO2fluxes near approximately 30◦C (Fig. 4f).
The soybean agricultural soil incubations yielded net COS emissions for the majority of trials, with a larger range than the other soils investigated: −0.04 to
0.09 pmol COS g−1min−1 when incubated between 10 and 40◦C. When samples of the agricultural soil were heated further, COS net production persisted. To determine
10
the contribution of soil organic matter in the sand-sized fraction (SSF), coarse litter
>53 µm was removed from one subsample and incubated as before. COS net emis-sions were higher compared to non-sieved samples at similar temperature and water content (Fig. 5).
Soil COS fluxes had a more complicated relationship with soil moisture. When soil
15
samples were waterlogged, net COS exchange shifted towards zero compared to drier trials. For the most part, drier soils have net emissions of COS, except in the case of the varied fluxes from the oak savannah soil (Figs. 4 and 5). In oak savannah soil, increases in soil moisture led to increases in COS uptake. When soil moisture was increased further to near 40 % VWC, COS exchange returned to near zero. The savannah site
20
was expected to experience this range of soil moisture (Fig. 1). In contrast, where dry rainforest soil experienced an increase in net COS production, rainforest soil rarely experiences near 0 soil moisture (Fig. 1). Increasing water content to field levels, the rainforest soil COS exchange returned to near zero. This does not take into account the fluctuations in soil moisture and redox potential experienced in a rainforest in situ.
25
Temperate forest soils appear to experience net COS uptake except under very dry or unusually hot conditions (Fig. 4b).
ACPD
15, 21095–21132, 2015Carbonyl sulfide exchange in soils for
better estimates of ecosystem carbon
uptake
M. E. Whelan et al.
Title Page
Abstract Introduction
Conclusions References
Tables Figures
◭ ◮
◭ ◮
Back Close
Full Screen / Esc
Printer-friendly Version
Interactive Discussion
Discussion
P
a
per
|
Discussion
P
a
per
|
Discussion
P
a
per
|
Discussion
P
a
per
|
soil moisture was changed during the course of the experiment (Fig. 6). The rainforest and savannah fluxes showed no discernible pattern in fluxes after water additions. For one series of observations with rainforest soil, the Nafion tubing was removed and the soil dried slowly over time, continuing to show little variability. In contrast, the temperate forest and soy field soils (Fig. 6a) responded with a large variability in COS fluxes after
5
soil moisture manipulation, taking several hours to reach a consistent flux value. There was an overall negative relationship between soil moisture and net COS production for the soy field soil samples, but the link between soil moisture and COS fluxes for soils collected at other sites is not as clear.
The pattern of COS fluxes over time after a change in soil water content was not
10
consistent for given changes in soil moisture. However, when water was added to dry soil (<10 % VWC), many soil subsamples exhibited the pattern in Fig. 7b: CO2fluxes
remained consistent while COS fluxes increased immediately after water addition, then slowly decreased over many hours. This is contrasted by Fig. 7a, where both COS and CO2fluxes demonstrate some variability after changes in water content.
15
3.2 Modeling soil COS production and consumption
Net COS fluxes were a balance of abiotic and biotic processes. If we assume that incubations of air-dried soils were representative of an abiotic COS production or des-orption (less some physical limitations), we can calculate the relationship between abi-otic COS production and temperature for agricultural soil (plotted in Fig. 8a). We fitted
20
Eq. (4) to the data using a least squares approach, much like in Maseyk et al. (2014) (plotted in Fig. 8a). The resulting Eq. (7) had anr2value of 0.9.
FCOS,abiotic=0.437 exp(0.0984Tsoil) (7)
There were more cold (<15◦C) incubations performed than hot (>35◦C) incubations,
and some of the coldest incubations were excluded from the fit to give appropriate
25
ACPD
15, 21095–21132, 2015Carbonyl sulfide exchange in soils for
better estimates of ecosystem carbon
uptake
M. E. Whelan et al.
Title Page
Abstract Introduction
Conclusions References
Tables Figures
◭ ◮
◭ ◮
Back Close
Full Screen / Esc
Printer-friendly Version
Interactive Discussion
Discussion
P
a
per
|
Discussion
P
a
per
|
Discussion
P
a
per
|
Discussion
P
a
per
|
Subtracting the dry soil signal component from all other COS incubation results, we found the biotic and physically limited flux component (Fig. 8b). The COS incubation observations were converted to pmol m−2s−1units, binned by incubation temperatures as <20, 20–30, and >30◦C, fitted to Eq. (4) and plotted in Fig. 8b. The resulting parameters are shown in Table 2. For the purposes of generalizing the equation to any
5
temperature and moisture content pairing,θgwas held constant at 35 % VWC; then the
data was binned by different temperature increments to discern howFopt,Fθg, andθopt
in Eqs. (5) and (6) change with temperature. More data needs to be collected to create a robust model; however, we think this is a worthwhile attempt at capturing variability.
Fopt=−0.00986Tsoil2 +0.197Tsoil+−9.32 (8) 10
θopt=0.287Tsoil+14.5 (9)
Fθg=−0.0119Tsoil2 +0.110Tsoil+−1.18 (10)
The total fluxFCOS,soil can be calculated as the sum of fluxes generated by biotic and abiotic processes.
Using this framework of equations, we estimate the influence of large soil COS fluxes
15
on GPP estimates. We used data reported for the Bondville FLUXNET site, US-Bo1. The model shown in Fig. 8 and described in Eqs. (3)–(10) was based on flux observa-tions from soil collected at this site. There are well known uncertainties associated with reported GPP from flux towers (Desai et al., 2008). However, since we have no in situ measurements of COS from the site, this data is used as a starting point for calculating
20
theoretical error potentials.
Two GPP estimates are presented in Fig. 9a: the first represents GPP estimates with COS leaf uptake fluxes alone, the second was based on theoretical net COS fluxes, including both leaf and soil COS exchange calculated with Eq. (3). The difference be-tween the 1 day moving averages (Fig. 9b) signifies how GPP could have been over- or
25
ACPD
15, 21095–21132, 2015Carbonyl sulfide exchange in soils for
better estimates of ecosystem carbon
uptake
M. E. Whelan et al.
Title Page
Abstract Introduction
Conclusions References
Tables Figures
◭ ◮
◭ ◮
Back Close
Full Screen / Esc
Printer-friendly Version
Interactive Discussion
Discussion
P
a
per
|
Discussion
P
a
per
|
Discussion
P
a
per
|
Discussion
P
a
per
|
To explore the possible spatial variation in soil COS exchange influence on the GPP proxy, we perform a similar calculation (described in Sect. 2.4) using in situ soil fluxes from previous studies (Table 3). The potential error in GPP estimates based on these sparse measurements ranges from−220 to+119 %. More observations and modeling
soil COS exchange for different ecosystems could ameliorate this large error.
5
4 Discussion
Generally, non-wetland soils are thought to have a small COS exchange rate compared to uptake by plant leaves. This assumption is based on few chamber measurements, often by severely altering the ecosystem, e.g. extracting plants beforehand (see review in Whelan et al., 2013). During a campaign to measure COS by eddy flux covariance
10
in Oklahoma, Billesbach et al. (2014) noticed that hot soil and particularly hot and dry soil yielded emissions of COS to the atmosphere. This is believed to be a breakdown product from thermal decomposition of soil organic matter (Maseyk et al., 2014; Whe-lan and Rhew, 2015). This study sought to investigate the ubiquity of this phenomenon by incubating soils from a broad range of ecosystems and under a matrix of controlled
15
conditions. Here we have found that, as assumed previously, most soils have small COS fluxes relative to anticipated plant uptake. However, large emissions like those re-ported by Billesbach et al. (2014) were generated in incubations of another agricultural soil from a soy field over 800 km away (Figs. 2 and 5).
4.1 Mechanisms of soil COS exchange
20
Multiple mechanisms determined the net COS exchange from soil, which were af-fected by soil water content and temperature. There are three proposed abiotic pro-cesses: COS production from abiotic degradation of soil organic matter (Whelan and Rhew, 2015), the physical limitations of water restricting air exchange between soil pore spaces and the chamber headspace (Van Diest and Kesselmeier, 2008), and
ACPD
15, 21095–21132, 2015Carbonyl sulfide exchange in soils for
better estimates of ecosystem carbon
uptake
M. E. Whelan et al.
Title Page
Abstract Introduction
Conclusions References
Tables Figures
◭ ◮
◭ ◮
Back Close
Full Screen / Esc
Printer-friendly Version
Interactive Discussion
Discussion
P
a
per
|
Discussion
P
a
per
|
Discussion
P
a
per
|
Discussion
P
a
per
|
tion/desorption of COS onto soil grains. The biotic uptake of COS by soils is theorized to be via enzymes present in the microbial community that are similarly responsible for COS uptake in plants (Kesselmeier et al., 1999; Protoschill-Krebs et al., 1996). There is no known biotic COS production mechanism in soils.
Taking these routes of COS exchange into account, we can explain qualitatively the
5
fluxes observed here. For example, hot, dry soil appeared to produce the highest net COS emissions. Dry soil has a smaller active microbial community (Manzoni et al., 2011), and biotic uptake would be small. Higher temperatures should yield more ther-mal degradation of organic matter, resulting in higher COS production. In this study, when soy field soils were heated from 40 to 68◦C, COS net emissions continued,
sug-10
gesting that the trace gas production here had no optimum temperature and was most likely abiotic (Conrad, 1996). Simultaneously, COS within the soil would exchange with the chamber air without the added tortuosity of water-filled pore space. The overall result is more COS produced abiotically, less COS consumed biotically, and the re-sulting COS excess diffusing quickly out of the soil. After wet up, the temperature
re-15
sponse curve shifts towards a COS sink, though often retains a similar shape. When soil moisture is increased further, soil pore spaces are effectively cut offfrom the cham-ber headspace. Waterlogged, the soil exhibits COS fluxes nearer to 0 regardless of temperature. This reasoning evidently holds across the temperate forest, savannah, and agricultural soil investigated here.
20
The desert soil samples, however, demonstrated near zero COS exchange at field moisture and COS uptake when wetted. Since these soils are frequently hot and dry, it could be that there is not sufficient remaining organic material to abiotically degrade into COS, or there are not enough clay or silt surfaces for COS to adsorb/desorb. The behavior of the desert soil resembles the soil COS exchange observed in Van Diest and
25
ACPD
15, 21095–21132, 2015Carbonyl sulfide exchange in soils for
better estimates of ecosystem carbon
uptake
M. E. Whelan et al.
Title Page
Abstract Introduction
Conclusions References
Tables Figures
◭ ◮
◭ ◮
Back Close
Full Screen / Esc
Printer-friendly Version
Interactive Discussion
Discussion
P
a
per
|
Discussion
P
a
per
|
Discussion
P
a
per
|
Discussion
P
a
per
|
4.2 More COS generated from agricultural soil
For the agricultural soils studied here, it appears that some soil interaction produced much more COS than other soils investigated. Large COS emissions were also ob-served from a wheat field soil in China (Liu et al., 2010), the previously mentioned wheat field in Oklahoma (Billesbach et al., 2014; Maseyk et al., 2014; Whelan and
5
Rhew, 2015), but not from the sandy arable soil in Germany, Finland, and China (Van Diest and Kesselmeier, 2008) where only net COS uptake was observed. While Melillo and Steudler (1989) found increases in forest soil COS production coincident with ni-trogen fertilizer application, the composition of fertilizer used at the sites discussed above is unknown to us. It is unclear what is particular about the agricultural soils in
10
the study by Van Diest and Kesselmeier (2008) that should result in only soil COS net consumption.
Two hypotheses emerge from the theoretical framework detailed above. The first is that all soils experience large COS production from thermal degradation of soil organic matter or desorption from soil surfaces, but most or all COS generated is usually
con-15
sumed by in situ microbial communities. The agricultural soils collected in Oklahoma and Illinois undergo pesticide/herbicide applications and irrigation during the course of their management that may limit the diversity and size of the microbial community (Griffiths and Philippot, 2013) and the magnitude of the microbial COS sink. This idea is partially supported by Whelan and Rhew (2015), where autoclaved agricultural soils
20
only experienced net COS production.
The second hypothesis suggests that the accessibility of the agricultural soil organic matter allowed more abiotic COS production than in forest or savannah soils. This could also be due to agricultural land management practices, which tend to break down soil aggregates and destabilize soil organic matter (Sollins et al., 1996). Accessibility, rather
25
ACPD
15, 21095–21132, 2015Carbonyl sulfide exchange in soils for
better estimates of ecosystem carbon
uptake
M. E. Whelan et al.
Title Page
Abstract Introduction
Conclusions References
Tables Figures
◭ ◮
◭ ◮
Back Close
Full Screen / Esc
Printer-friendly Version
Interactive Discussion
Discussion
P
a
per
|
Discussion
P
a
per
|
Discussion
P
a
per
|
Discussion
P
a
per
|
COS uptake patterns found in arable soils by Van Diest and Kesselmeier (2008) and Kesselmeier et al. (1999) which report COS fluxes that resemble more the desert soil fluxes investigated here.
These two hypothesis may both influence COS exchange simultaneously. When the course litter and sand (>53 µm) fraction was removed from a soy field soil sample,
5
COS production increased per gram of incubated sample (Fig. 5). This implies that the origin of the COS emissions resides in the silt and clay-associated fraction of organic matter, which has been shown to consist of plant matter that has undergone some mi-crobial processing (Six et al., 2001, 2002). The combination of mimi-crobial activities and increased accessibility of organic matter to degradation may lead to large COS
emis-10
sions from soils. While these mechanisms may explain differences between managed and non-managed soil COS exchange, we still lack a hypothesis for the difference be-tween the small sinks in European arable soils and the temperature-driven sources in US and Chinese arable soils.
4.3 Comparison to field observations
15
The draw down of COS over North America has been observed from aircraft vertical profiles, appearing to scale with GPP-based uptake of COS by plants (Campbell et al., 2008). Data presented here indicate soil COS emission was maximum during high tem-perature incubations, coincident with some surface temtem-peratures observed during the North American growing season. We generated a model in Sects. 2.3 and 3.2 to
cal-20
culate COS fluxes for US agricultural soils, taking these large emissions into account. Relating laboratory measurements to in situ observations has inherent problems, so we present this as a theoretical exercise investigating the possible magnitudes of soil COS exchange on broader scales.
We plotted our equation with one developed by Maseyk et al. (2014) from fluxes
25
con-ACPD
15, 21095–21132, 2015Carbonyl sulfide exchange in soils for
better estimates of ecosystem carbon
uptake
M. E. Whelan et al.
Title Page
Abstract Introduction
Conclusions References
Tables Figures
◭ ◮
◭ ◮
Back Close
Full Screen / Esc
Printer-friendly Version
Interactive Discussion
Discussion
P
a
per
|
Discussion
P
a
per
|
Discussion
P
a
per
|
Discussion
P
a
per
|
stant ambient COS concentration of 500 ppt and a standard flux of 75.3 pmol m−2s−1 (Fig. 10b). This last equation can only predict COS soil uptake and has been used to model soil COS exchange globally (Kettle et al., 2002).
Key patterns emerged from examining differences between the observations and predictions over the course of the campaign in Maseyk et al. (2014) (Fig. 10), noting
5
first that the model presented by Kesselmeier et al. (1999) and the model presented here were not parameterized using soil from this site. The fact that there are any sim-ilarities at all between the model outputs and observations is encouraging for future modeling efforts. None of the three models captured the large emissions observed before day of year (DOY) 130 when wheat was present in the field and higher soil
10
moisture occurred. None of the models captured the large swings from COS source to sink found during large temperature fluctuations between 110 and 115 DOY. After DOY 130, the wheat senesced and was harvested, resulting in hot and dry soils. The simple model from Maseyk et al. (2014) reproduced the COS soil flux variability better under these conditions. The Kesselmeier et al. (1999) model generated some variability, but
15
could not predict any soil COS emissions. This study’s model overlapped both the up-take model’s variability during wheat senescence and the high emissions predicted by Maseyk et al. (2014) after wheat harvest.
There are several explanations for the discrepancies between models and flux ob-servations. Both this study and the Kesselmeier et al. (1999) model were based on
20
idealized laboratory conditions, not taking into account interactions with soil COS ex-change at different depths. No doubt COS is produced or consumed in all layers of soil, not just at the surface, but soil incubations were purposefully designed to avoid these issues. Additionally, there is variability in both soil moisture and temperature even over the area of the soil plot: a heterogeneous soil may experience variations in these
pa-25
be-ACPD
15, 21095–21132, 2015Carbonyl sulfide exchange in soils for
better estimates of ecosystem carbon
uptake
M. E. Whelan et al.
Title Page
Abstract Introduction
Conclusions References
Tables Figures
◭ ◮
◭ ◮
Back Close
Full Screen / Esc
Printer-friendly Version
Interactive Discussion
Discussion
P
a
per
|
Discussion
P
a
per
|
Discussion
P
a
per
|
Discussion
P
a
per
|
lieve the hybrid model presented here will lead to new investigations that close the gap between lab-based COS observations and COS exchange at larger scales.
4.4 Discussion: implications for uncertainty in COS-based GPP estimates
The main motivation of this work was to make progress towards better estimates of GPP. The draw down of COS over the continents appears to be associated with the
5
uptake of carbon dioxide (Campbell et al., 2008). For some of the biomes explored here, like deserts, soil COS exchange under field conditions may actually be negligible compared to plant uptake. On the other hand, recent work has suggested that soil COS fluxes in agricultural areas might be large and need to be taken into account (Billesbach et al., 2014; Maseyk et al., 2014). The model presented in this study anticipates these
10
agricultural soil COS fluxes using commonly measured variables. With such a correc-tion, applying the COS-GPP tracer will be more feasible to constrain GPP estimates on regional scales.
Taking COS soil fluxes into account when estimating GPP can avoid over- and un-derestimations of carbon fluxes presented in Table 3 and Fig. 9. Observations are still
15
scarce: despite a plea for data from desert soils in 2002 by Kettle et al., we were not able to find such a study in the literature over ten years later. Boreal forest soil COS ex-change estimates are represented by a single study performed at a single site in Swe-den over the course of two months in 1993 (Simmons, 1999). Modeling efforts suggest large COS fluxes in the tropics (Berry et al., 2013; Suntharalingam et al., 2008) and
20
tropical forests and savannas are associated with 60 % of global terrestrial GPP (Beer et al., 2010). However, there remains a dearth of observations in tropical latitudes.
This magnitude of avoidable error suggests that soil fluxes are not negligible; how-ever, the uncertainty of GPP at regional to global scales is much larger. The er-ror introduced by large soil emissions from cropland soils to COS-GPP estimates
25
ACPD
15, 21095–21132, 2015Carbonyl sulfide exchange in soils for
better estimates of ecosystem carbon
uptake
M. E. Whelan et al.
Title Page
Abstract Introduction
Conclusions References
Tables Figures
◭ ◮
◭ ◮
Back Close
Full Screen / Esc
Printer-friendly Version
Interactive Discussion
Discussion
P
a
per
|
Discussion
P
a
per
|
Discussion
P
a
per
|
Discussion
P
a
per
|
et al. (2014) and the small uptake rates observed in sandy soils by Van Diest and Kesselmeier (2008).
5 Conclusion
The amount of data in Table 3 suggested a dire need for more information about soil COS exchange. Here we presented a controlled study using soil from multiple
ecosys-5
tems and cohesive theory for how to interpret observed soil COS fluxes. This study confirms that soil from many biomes exhibited small COS fluxes compared to esti-mated plant sinks. However, field studies must be conducted to determine the extent of the larger magnitude US agricultural soil COS exchange in order to quantify and cor-rect for soil effects in GPP proxy models. The difference in COS flux behavior between
10
soils investigated in the US and Europe also remains an open question.
A final complication arises from water stress: changes in soil moisture can cause the release of pulses of COS to the atmosphere (Fig. 7) while affecting photosynthesis and associated plant COS uptake. Additionally, COS exchange during freeze/thaw events will shed light on conditions that no field or laboratory study has yet determined. If the
15
COS soil sink is indeed overwhelmingly microbial, water stresses will play an important role in their community diversity and function (Schimel et al., 2007), which may control the balance of COS over ecosystems.
Acknowledgements. The authors thank D. Chadwick, J. Thom, L. Meredith, J. Chalfant, and
W. Sun for sample collection; K. MacFarlane, T. Guilderson, S. Biraud, and K. Maseyk for
sam-20
pling advice and data sharing; M. Zahniser and A. Kornfeld for QCL technical support; and G. Badgley, K. Caldeira and R. Commane for data analysis suggestions. Equipment was pur-chased through NSF DBI grant #1 040 106. Funding for the US-WCr AmeriFlux ChEAS cluster core site was provided by the U.S. Department of Energy’s Office of Science. The CFSR data was developed by NOAA’s National Centers for Environmental Prediction (NCEP). The data
25
ACPD
15, 21095–21132, 2015Carbonyl sulfide exchange in soils for
better estimates of ecosystem carbon
uptake
M. E. Whelan et al.
Title Page
Abstract Introduction
Conclusions References
Tables Figures
◭ ◮
◭ ◮
Back Close
Full Screen / Esc
Printer-friendly Version
Interactive Discussion
Discussion
P
a
per
|
Discussion
P
a
per
|
Discussion
P
a
per
|
Discussion
P
a
per
|
Level 1 on T382 Gaussian Grid) and soil temperature (soilt1.gdas.*.grb2 files; Soil Temperature Level 1 on T382 Gaussian Grid). The data used to generate Fig. 10 used eddy covariance data acquired by the FLUXNET community and in particular AmeriFlux (U.S. Department of Energy, Biological and Environmental Research, Terrestrial Carbon Program (DE-FG02-04ER63917 and DE-FG02-04ER63911)). We acknowledge the financial support to the eddy covariance
5
data harmonization provided by CarboEuropeIP, FAO-GTOS-TCO, iLEAPS, Max Planck Insti-tute for Biogeochemistry, National Science Foundation, University of Tuscia, Université Laval and Environment Canada and US Department of Energy and the database development and technical support from Berkeley Water Center, Lawrence Berkeley National Laboratory, Mi-crosoft Research eScience, Oak Ridge National Laboratory, University of California – Berkeley,
10
and University of Virginia.
References
Anderson, R. G. and Goulden, M. L.: Relationships between climate, vegetation, and en-ergy exchange across a montane gradient, J. Geophys. Res.-Biogeo., 116, G01026, doi:10.1029/2010JG001476, 2011.
15
Asaf, D., Rotenberg, E., Tatarinov, F., Dicken, U., Montzka, S. A., and Yakir, D.: Ecosystem photosynthesis inferred from measurements of carbonyl sulphide flux, Nat. Geosci., 6, 186– 190, doi:10.1038/ngeo1730, 2013.
Beer, C., Reichstein, M., Tomelleri, E., Ciais, P., Jung, M., Carvalhais, N., Röden-beck, C., Arain, M. A., Baldocchi, D., and Bonan, G. B.: Terrestrial gross carbon
diox-20
ide uptake: global distribution and covariation with climate, Science, 329, 834–838, doi:10.1126/science.1184984, 2010.
Behrendt, T., Veres, P. R., Ashuri, F., Song, G., Flanz, M., Mamtimin, B., Bruse, M., Williams, J., and Meixner, F. X.: Characterisation of NO production and consumption: new insights by an improved laboratory dynamic chamber technique, Biogeosciences, 11, 5463–5492,
25
doi:10.5194/bg-11-5463-2014, 2014.
Berkelhammer, M., Asaf, D., Still, C., Montzka, S., Noone, D., Gupta, M., Provencal, R., Chen, H., and Yakir, D.: Constraining surface carbon fluxes using in situ measure-ments of carbonyl sulfide and carbon dioxide, Global Biogeochem. Cy., 28, 161–179, doi:10.1002/2013GB004644, 2014.
ACPD
15, 21095–21132, 2015Carbonyl sulfide exchange in soils for
better estimates of ecosystem carbon
uptake
M. E. Whelan et al.
Title Page
Abstract Introduction
Conclusions References
Tables Figures
◭ ◮
◭ ◮
Back Close
Full Screen / Esc
Printer-friendly Version
Interactive Discussion
Discussion
P
a
per
|
Discussion
P
a
per
|
Discussion
P
a
per
|
Discussion
P
a
per
|
Berry, J., Wolf, A., Campbell, J. E., Baker, I., Blake, N., Blake, D., Denning, A. S., Kawa, S. R., Montzka, S. A., Seibt, U., Stimler, K., Yakir, D., and Zhu, Z.: A coupled model of the global cycles of carbonyl sulfide and CO2: a possible new window on the carbon cycle, J. Geophys. Res.-Biogeo., 118, 842–852, doi:10.1002/jgrg.20068, 2013.
Billesbach, D. P., Berry, J. A., Seibt, U., Maseyk, K., Torn, M. S., Fischer, M. L., Abu-Naser, M.,
5
and Campbell, J. E.: Growing season eddy covariance measurements of carbonyl sulfide and CO2 fluxes: COS and CO2 relationships in Southern Great Plains winter wheat, Agr. Forest Meteorol., 184, 48–55, doi:10.1016/j.agrformet.2013.06.007, 2014.
Blonquist, J. M., Montzka, S. A., Munger, J. W., Yakir, D., Desai, A. R., Dragoni, D., Griffis, T. J., Monson, R. K., Scott, R. L., and Bowling, D. R.: The potential of carbonyl sulfide as a proxy
10
for gross primary production at flux tower sites, J. Geophys. Res.-Biogeo., 116, 1–18, doi:10.1029/2011JG001723, 2011.
Campbell, J. E., Carmichael, G. R., Chai, T., Mena-Carrasco, M., Tang, Y., Blake, D. R., Blake, N. J., Vay, S. A., Collatz, G. J., Baker, I., Berry, J. A., Montzka, S. A., Sweeney, C., Schnoor, J. L., and Stanier, C. O.: Photosynthetic control of atmospheric carbonyl sulfide
15
during the growing season, Science, 322, 1085–1088, doi:10.1126/science.1164015, 2008. Campbell, J. E., Whelan, M. E., Seibt, U., Smith, S. J., Berry, J. A., and Hilton, T. W.:
Atmo-spheric carbonyl sulfide sources from anthropogenic activity: implications for carbon cycle constraints, Geophys. Res. Lett., 42, 3004–3010, doi:10.1002/2015GL063445, 2015. Commane, R., Herndon, S. C., Zahniser, M. S., Lerner, B. M., McManus, J. B., Munger, J. W.,
20
Nelson, D. D., and Wofsy, S. C.: Carbonyl sulfide in the planetary boundary layer: coastal and continental influences, J. Geophys. Res.-Atmos., 118, 8001–8009, doi:10.1002/jgrd.50581, 2013.
Conrad, R.: Soil microorganisms as controllers of atmospheric trace gases (H2, CO, CH4, OCS, N2O, and NO), Microbiol. Rev., 60, 609–640, 1996.
25
Cook, B. D., Davis, K. J., Wang, W., Desai, A., Berger, B. W., Teclaw, R. M., Martin, J. G., Bolstad, P. V., Bakwin, P. S., Yi, C., and Heilman, W.: Carbon exchange and venting anoma-lies in an upland deciduous forest in northern Wisconsin, USA, Agr. Forest Meteorol., 126, 271–295, doi:10.1016/j.agrformet.2004.06.008, 2004.
De Mello, W. Z. and Hines, M. E.: Application of static and dynamic enclosures for determining
30
ACPD
15, 21095–21132, 2015Carbonyl sulfide exchange in soils for
better estimates of ecosystem carbon
uptake
M. E. Whelan et al.
Title Page
Abstract Introduction
Conclusions References
Tables Figures
◭ ◮
◭ ◮
Back Close
Full Screen / Esc
Printer-friendly Version
Interactive Discussion
Discussion
P
a
per
|
Discussion
P
a
per
|
Discussion
P
a
per
|
Discussion
P
a
per
|
Desai, A. R., Richardson, A. D., Moffat, A. M., Kattge, J., Hollinger, D. Y., Barr, A., Falge, E., Noormets, A., Papale, D., Reichstein, M., and Stauch, V. J.: Cross-site evaluation of eddy covariance GPP and RE decomposition techniques, Agr. Forest Meteorol., 148, 821–838, doi:10.1016/j.agrformet.2007.11.012, 2008.
Entin, J. K., Robock, A., Vinnikov, K. Y., Hollinger, S. E., Liu, S., and Namkhai, A.: Temporal
5
and spatial scales of observed soil moisture variations in the extratropics, J. Geophys. Res.-Atmos., 105, 11865–11877, doi:10.1029/2000JD900051, 2000.
Geng, C. and Mu, Y.: Carbonyl sulfide and dimethyl sulfide exchange between trees and the atmosphere, Atmos. Environ., 40, 1373–1383, doi:10.1016/j.atmosenv.2005.10.023, 2006. Griffiths, B. S. and Philippot, L.: Insights into the resistance and resilience of the soil
micro-10
bial community, FEMS Microbiol. Rev., 37, 112–129, doi:10.1111/j.1574-6976.2012.00343.x, 2013.
Kesselmeier, J., Teusch, N., and Kuhn, U.: Controlling variables for the uptake of atmospheric carbonyl sulfide by soil, J. Geophys. Res., 104, 11577–11584, doi:10.1029/1999JD900090, 1999.
15
Kettle, A. J., Kuhn, U., von Hobe, M., Kesselmeier, J., and Andreae, M. O.: Global budget of atmospheric carbonyl sulfide: temporal and spatial variations of the dominant sources and sinks, J. Geophys. Res.-Atmos., 107, 1–16, doi:10.1029/2002JD002187, 2002.
Liu, J., Geng, C., Mu, Y., Zhang, Y., Xu, Z., and Wu, H.: Exchange of carbonyl sulfide (COS) between the atmosphere and various soils in China, Biogeosciences, 7, 753–762,
20
doi:10.5194/bg-7-753-2010, 2010.
Manzoni, S., Schimel, J. P., and Porporato, A.: Responses of soil microbial communities to water stress: results from a meta-analysis, Ecology, 93, 930–938, doi:10.1890/11-0026.1, 2011.
Maseyk, K., Berry, J. A., Billesbach, D., Campbell, J. E., Torn, M. S., Zahniser, M., and Seibt, U.:
25
Sources and sinks of carbonyl sulfide in an agricultural field in the Southern Great Plains, P. Natl. Acad. Sci. USA, 111, 9064–9069, doi:10.1073/pnas.1319132111, 2014.
Melillo, J. M. and Steudler, P. A.: The effect of nitrogen fertilization on the COS and CS2 emis-sions from temperature forest soils, J. Atmos. Chem., 9, 411–417, 1989.
Meyers, T. and Hollinger, S. E.: An assessment of storage terms in the
sur-30
ACPD
15, 21095–21132, 2015Carbonyl sulfide exchange in soils for
better estimates of ecosystem carbon
uptake
M. E. Whelan et al.
Title Page
Abstract Introduction
Conclusions References
Tables Figures
◭ ◮
◭ ◮
Back Close
Full Screen / Esc
Printer-friendly Version
Interactive Discussion
Discussion
P
a
per
|
Discussion
P
a
per
|
Discussion
P
a
per
|
Discussion
P
a
per
|
Montzka, S. A., Calvert, P., Hall, B. D., Elkins, J. W., Conway, T. J., Tans, P. P., and Sweeney, C.: On the global distribution, seasonality, and budget of atmospheric carbonyl sulfide (COS) and some similarities to CO2, J. Geophys. Res.-Atmos., 112, D09302, doi:10.1029/2006JD007665, 2007.
Protoschill-Krebs, G., Wilhelm, C., and Kesselmeier, J.: Consumption of carbonyl
sul-5
phide (COS) by higher plant carbonic anhydrase (CA), Atmos. Environ., 30, 3151–3156, doi:10.1016/1352-2310(96)00026-X, 1996.
Reichstein, M., Falge, E., Baldocchi, D., Papale, D., Aubinet, M., Berbigier, P., Bernhofer, C., Buchmann, N., Gilmanov, T., Granier, A., Grünwald, T., Havránková, K., Ilvesniemi, H., Janous, D., Knohl, A., Laurila, T., Lohila, A., Loustau, D., Matteucci, G., Meyers, T.,
Migli-10
etta, F., Ourcival, J.-M., Pumpanen, J., Rambal, S., Rotenberg, E., Sanz, M., Tenhunen, J., Seufert, G., Vaccari, F., Vesala, T., Yakir, D., and Valentini, R.: On the separation of net ecosystem exchange into assimilation and ecosystem respiration: review and improved algo-rithm, Glob. Change Biol., 11, 1424–1439, doi:10.1111/j.1365-2486.2005.001002.x, 2005. Saha, S., Moorthi, S., Pan, H.-L., Wu, X., Wang, J., Nadiga, S., Tripp, P., Kistler, R., Woollen, J.,
15
Behringer, D., Liu, H., Stokes, D., Grumbine, R., Gayno, G., Wang, J., Hou, Y.-T., Chuang, H.-Y., Juang, H.-M. H., Sela, J., Iredell, M., Treadon, R., Kleist, D., Van Delst, P., Keyser, D., Derber, J., Ek, M., Meng, J., Wei, H., Yang, R., Lord, S., Van Den Dool, H., Kumar, A., Wang, W., Long, C., Chelliah, M., Xue, Y., Huang, B., Schemm, J.-K., Ebisuzaki, W., Lin, R., Xie, P., Chen, M., Zhou, S., Higgins, W., Zou, C.-Z., Liu, Q., Chen, Y., Han, Y., Cucurull, L.,
20
Reynolds, R. W., Rutledge, G., and Goldberg, M.: The NCEP climate forecast system reanal-ysis, B. Am. Meteorol. Soc., 91, 1015–1057, doi:10.1175/2010BAMS3001.1, 2010.
Sandoval-Soto, L., Stanimirov, M., von Hobe, M., Schmitt, V., Valdes, J., Wild, A., and Kesselmeier, J.: Global uptake of carbonyl sulfide (COS) by terrestrial vegetation: Estimates corrected by deposition velocities normalized to the uptake of carbon dioxide (CO2),
Biogeo-25
sciences, 2, 125–132, doi:10.5194/bg-2-125-2005, 2005.
Schenk, S., Kesselmeier, J., and Anders, E.: How does the exchange of one oxygen atom with sulfur affect the catalytic cycle of carbonic anhydrase?, Chem.-Eur. J., 10, 3091–3105, doi:10.1002/chem.200305754, 2004.
Schimel, J., Balser, T. C., and Wallenstein, M.: Microbial stress-response physiology and its
30
ACPD
15, 21095–21132, 2015Carbonyl sulfide exchange in soils for
better estimates of ecosystem carbon
uptake
M. E. Whelan et al.
Title Page
Abstract Introduction
Conclusions References
Tables Figures
◭ ◮
◭ ◮
Back Close
Full Screen / Esc
Printer-friendly Version
Interactive Discussion
Discussion
P
a
per
|
Discussion
P
a
per
|
Discussion
P
a
per
|
Discussion
P
a
per
|
Seibt, U., Kesselmeier, J., Sandoval-Soto, L., Kuhn, U., and Berry, J. A.: A kinetic analysis of leaf uptake of COS and its relation to transpiration, photosynthesis and carbon isotope fractionation, Biogeosciences, 7, 333–341, doi:10.5194/bg-7-333-2010, 2010.
Simmons, J. S.: Consumption of atmospheric carbonyl sulfide by coniferous boreal forest soils, J. Geophys. Res., 104, 11569–11576, doi:10.1029/1999JD900149, 1999.
5
Six, J., Guggenberger, G., Paustian, K., Haumaier, L., Elliott, E. T., and Zech, W.: Sources and composition of soil organic matter fractions between and within soil aggregates, Eur. J. Soil Sci., 52, 607–618, doi:10.1046/j.1365-2389.2001.00406.x, 2001.
Six, J., Conant, R. T., Paul, E. A., and Paustian, K.: Stabilization mechanisms of soil organic matter: implications for C-saturation of soils, Plant Soil, 241, 155–176,
10
doi:10.1023/A:1016125726789, 2002.
Sollins, P., Homann, P., and Caldwell, B. A.: Stabilization and destabilization of soil organic mat-ter: mechanisms and controls, Geoderma, 74, 65–105, doi:10.1016/S0016-7061(96)00036-5, 1996.
Stimler, K., Montzka, S. A., Berry, J. A., Rudich, Y., and Yakir, D.: Relationships between
15
carbonyl sulfide (COS) and CO2 during leaf gas exchange, New Phytol., 186, 869–878, doi:10.1111/j.1469-8137.2010.03218.x, 2010.
Stimler, K., Berry, J. A., Montzka, S. A., and Yakir, D.: Association between Carbonyl Sulfide Uptake and 18∆during Gas Exchange in C3 and C4 Leaves, Plant Physiol., 157, 509–517, doi:10.1104/pp.111.176578, 2011.
20
Suntharalingam, P., Kettle, A. J., Montzka, S. M., and Jacob, D. J.: Global 3-D model analysis of the seasonal cycle of atmospheric carbonyl sulfide: implications for terrestrial vegetation uptake, Geophys. Res. Lett., 35, L19801, doi:10.1029/2008GL034332, 2008.
Van Diest, H. and Kesselmeier, J.: Soil atmosphere exchange of carbonyl sulfide (COS) reg-ulated by diffusivity depending on water-filled pore space, Biogeosciences, 5, 475–483,
25
doi:10.5194/bg-5-475-2008, 2008.
Whelan, M. and Rhew, R.: Carbonyl sulfide produced by abiotic thermal and photo-degradation of soil organic matter from wheat field substrate, J. Geophys. Res.-Biogeo., 120, 54–62, doi:10.1002/2014JG002661, 2015.
Whelan, M. E., Min, D.-H., and Rhew, R. C.: Salt marshes as a source of atmospheric carbonyl
30
sulfide, Atmos. Environ., 73, 131–137, doi:10.1016/j.atmosenv.2013.02.048, 2013.
ACPD
15, 21095–21132, 2015Carbonyl sulfide exchange in soils for
better estimates of ecosystem carbon
uptake
M. E. Whelan et al.
Title Page
Abstract Introduction
Conclusions References
Tables Figures
◭ ◮
◭ ◮
Back Close
Full Screen / Esc
Printer-friendly Version
Interactive Discussion
Discussion
P
a
per
|
Discussion
P
a
per
|
Discussion
P
a
per
|
Discussion
P
a
per
|
Table 1.Site descriptions for soils used in this study and soils from the site used in Billesbach et al. (2014) and Maseyk et al. (2014). Site descriptions for the fluxnet sites can be found in Meyers and Hollinger (2004), Anderson and Goulden (2011) and Cook et al. (2004). The temperature and soil moisture ranges are the maximum and minimum of ten years worth of hourly data from the Climate Forecast System Reanalysis (CFSRv2, Saha et al., 2010).
Site Description Bulk pH Site Temperature Soil Moisture
Density Range at 5 cm (C) Range (%VWC)
Bondville Fluxnet, US-Bo1 (40.0062◦N, 88.2904◦W)
Soybean/Corn 1.09 6.1 −14–33 12–46
Stunt Ranch Reserve (34.0939◦N, 118.6567◦W)
Oak savannah 1.11 7.0 4.2–37 13–45
Boyd Deep Canyon, US-SCd (33.6481◦N, 116.3767◦W)
Colorado desert 1.46 7.5 −0.23–44 12–38
Willow Creek Fluxnet, US-WCr (45.8060◦N, 90.0798◦W)
Deciduous forest 0.84 5.8 −22–29 9.5–42
Los Amigos Biological Station, Peru
(12.5692◦S, 70.1001◦W)
Rainforest 0.92 3.9 14–31 15–47
Southern Great Plains ARM site, site of previous studies
(36.6050◦N, 97.4850◦W)
ACPD
15, 21095–21132, 2015Carbonyl sulfide exchange in soils for
better estimates of ecosystem carbon
uptake
M. E. Whelan et al.
Title Page
Abstract Introduction
Conclusions References
Tables Figures
◭ ◮
◭ ◮
Back Close
Full Screen / Esc
Printer-friendly Version
Interactive Discussion
Discussion
P
a
per
|
Discussion
P
a
per
|
Discussion
P
a
per
|
Discussion
P
a
per
|
Table 2.Fitting parameters using Eq. (4) for soy field COS fluxes binned by temperature. See
Sect. 4.2 for parameter descriptions. Fluxes are in pmol COS m−2
s−1
and soil moistures are in percentage volumetric water content (%VWC).
Temperature bin (◦C) F
opt θopt Fθg θg r
2
10–20 8.38 18.7 1.40 37.2 0.8
21–30 11.6 21.9 9.99 28.6 0.8