www.atmos-meas-tech.net/5/2635/2012/ doi:10.5194/amt-5-2635-2012
© Author(s) 2012. CC Attribution 3.0 License.
Measurement
Techniques
Corrections for OMI SO
2
BRD retrievals influenced by row
anomalies
H. Yan1,2, L. Chen1, J. Tao1, L. Su1, J. Huang3, D. Han4, and C. Yu1,2
1State Key Laboratory of Remote Sensing Science, Jointly Sponsored by the Institute of Remote Sensing Applications of
Chinese Academy of Sciences and Beijing Normal University, Beijing, China
2Graduate University of the Chinese Academy of Sciences, Beijing, China
3Key Laboratory of Digital Earth Science, Center for Earth Observation and Digital Earth Chinese Academy of Sciences,
Beijing, China
4Normal College, Qingdao University, Qingdao, China
Correspondence to:L. Chen ([email protected])
Received: 9 January 2012 – Published in Atmos. Meas. Tech. Discuss.: 27 January 2012 Revised: 3 September 2012 – Accepted: 8 October 2012 – Published: 6 November 2012
Abstract. Since June 2007, the Ozone Monitoring Instru-ment (OMI) Earth radiance data at specific viewing angles have been affected by the row anomaly, which causes large biases in sulfur dioxide (SO2) columns retrieved using the
band residual difference (BRD) algorithm. To improve global measurements of atmospheric SO2from OMI, we developed
two correction approaches for the row anomaly effects in the northern latitudes and along the full orbit. Firstly the resid-ual correction approach with median residresid-ual from a sliding 10◦
latitude range, and with that near the Equator was used to remove the anomalous high SO2columns in the northern
lati-tudes. Secondly, in the case of the row anomaly along the full orbit, the SO2biases caused by the anomalous ozone (O3)
column and underestimated Lambertian effective reflectivity (LER) were reduced, respectively, by using unaffected adja-cent O3column and residual correction with median residual
from a sliding 10◦latitude range. Comparisons with the OMI
SO2columns processed with median residual from a sliding
30◦
latitude range have illustrated the drastic improvements of our correction approaches under row anomaly conditions. The consistencies among the SO2 columns inside and
out-side the row anomaly areas have also demonstrated the ef-fectiveness of our correction approaches under row anomaly conditions. The analyses of the underestimation and the er-rors caused by the O3column and LER were conducted to
understand the limitations of our correction approaches. The proposed approaches for the row anomaly effects can extend the valid range of OMI SO2Planetary Boundary Layer (PBL)
data produced using the BRD algorithm.
1 Introduction
Sulfur dioxide (SO2)is a short-lived gas, released
primar-ily by anthropogenic activities (e.g., smelting of sulfur ore, combustion of coal, emissions from motor vehicles) and natural phenomena (e.g., volcanic and sulfur minerals de-composition) (Cullis and Hirschler, 1980; Seinfeld and Pan-dis, 1998; Finlayson-Pitts and Pitts, 2000). There is concern about the impact of SO2on the radiation balance of the
at-mosphere through the formation of sulfate aerosols, as well as on ecosystems and human health (Intergovernmental Pan-elon Climate Change (IPCC), 2001).
Since the Nimbus-7 Total Ozone Mapping Spectrometer’s (TOMS) first sighting of SO2cloud from El Chich´on’s
erup-tion in 1982 (Krueger, 1983), satellite remote sensing tech-nology has been playing an important role in the field of atmospheric monitoring. Later, Global Ozone Monitoring Experiment (GOME), SCanning Imaging Absorption spec-troMeter for Atmospheric CartograpHY (SCIAMACHY), and Ozone Monitoring Instrument (OMI) were developed, and all these instruments have high SO2 monitoring
capa-bility. OMI, which was launched on the EOS/Aura plat-form in July 2004, combines the hyperspectral measure-ments of GOME and SCIAMACHY with improved nadir spatial resolution (13×24 km2), and achieves the daily global monitoring of short-lifetime SO2. It measures solar
about 2600 km, divided into 60 pixels (Levelt et al., 2006). OMI’s high sensitivity to SO2and low noise enables
detec-tion of low near-surface SO2 emission, long-range tracking
of SO2cloud in the upper troposphere and lower stratosphere
(Krueger et al., 2002; Krotkov et al., 2008; Carn et al., 2007; Li et al., 2010; Yan et al., 2012).
Approaches for retrieval of SO2from satellite instruments
have been developed and applied to detection of volcanic SO2for aviation (Yang et al., 2007; Krotkov et al., 2006; Rix
et al., 2010; Lee et al., 2008; Corradini et al., 2009; Remuto et al., 1994). Among the ultraviolet (UV) inversion al-gorithms of SO2, differential optical absorption spectroscopy
(DOAS) (Platt, 1994; Platt and Stutz, 2008), linear fit al-gorithm (LF) (Yang et al., 2007) and band residual differ-ence algorithm (BRD) (Krotkov et al., 2006) are sensitive to high volcanic SO2in the upper troposphere or the low
strato-sphere (Yang et al., 2007; Rix et al., 2010; Lee et al., 2008). For OMI measurements, operational SO2Planetary
Bound-ary Layer (PBL) data have been processed with the BRD al-gorithm (Krotkov et al., 2006), which takes advantage of the largest differential SO2cross sections in the OMI UV2
spec-tral region (310–380 nm). OMI-retrieved SO2PBL columns
have been used to study regional emissions, synoptic pollu-tion events and large point emission sources (Krotkov et al., 2008; Carn et al., 2007; Li et al., 2010; Yan et al., 2012).
Background correction is necessary for atmospheric SO2
column retrieval, because retrieval errors and measurement noises can result in false SO2columns over regions with very
low SO2emission. The DOAS retrieval algorithm uses a
ref-erence sector approach by subtracting the presumably SO2
free reference data (generally in the Pacific Ocean area) to correct the latitudinal varying background errors (Khokhar et al., 2005; Richter et al., 2006). However, the forward model errors and satellite measurement errors that affect the SO2
re-trieval are dynamic over the globe and vary with season, lat-itude, observation geometry, O3column amount, surface
re-flectivity, etc. Therefore, using a fixed reference sector for the empirical correction of SO2 retrieval would possibly bring
new error sources.
Yang developed a sliding median approach for residual correction, which has been applied to OMI SO2 products
(Krotkov et al., 2008; Yang et al., 2007). This approach cal-culates the median residual for each cross-track pixel from a sliding group of pixels covering about 30◦
latitude along the orbit track, and then subtracts the sliding median value for each spectral band and each cross-track position to reduce the error interference for the centered pixels. However, this approach with median residual from a sliding 30◦
latitude range has been unsuitable for the cases with row anomaly since June 2007, and results in large biases in the retrieved SO2columns.
To improve the retrieval of SO2 when row anomaly
oc-curs, we developed two correction approaches for the row anomaly effects in the northern latitudes and along the full orbit. Firstly, the residual correction approach with median
residual from a sliding 10◦ latitude range and with those
near the Equator was used to remove the anomalous high SO2 columns in the northern latitudes (see Sect. 4.1).
Dif-ferent from those in the northern latitudes, the SO2 column
biases along the full orbit are mainly caused by the anoma-lous O3 columns and underestimated Lambertian effective
reflectivity (LER), which are used as inputs in the BRD al-gorithm (see Sect. 4.2). Our second correction approach in-volved reducing the SO2 biases along the full orbit by
us-ing unaffected adjacent O3 column and residual correction
with median residual from a sliding 10◦
latitude range. The OMI SO2columns from November 2008 to November 2009
were processed with proposed approaches in this paper, and the results were compared with that processed with median residual from a sliding 30◦latitude range suggested by Yang
(Yang et al., 2007). Comparison results illustrate the drastic improvements invoked by these correction approaches under row anomaly conditions.
The paper is organized as follows. In Sect. 2, an overview of BRD algorithm and parameters needed for the forward computation are presented. In Sect. 3, detailed analysis of OMI data error sources is conducted to understand the characteristics of measurement error sources and the row anomaly effects. Correction approaches for improvement of SO2 retrievals with row anomaly are described in detail in
Sect. 4. In Sect. 5, to evaluate the effectiveness of our cor-rection approaches, several orbits covering days with row anomaly effects from November 2008 to November 2009 are selected to compare the SO2columns before and after
pro-cessed with proposed correction approaches. The limitations of our correction approaches are also discussed in Sect. 5. Section 6 summarizes the findings.
2 OMI SO2PBL columns retrieval
2.1 BRD algorithm overview
SO2PBL columns are retrieved from OMI measurements of
the solar irradiance and the Earth radiance (Van den Oord et al., 2002) in the ultraviolet (310.8 nm to 314.4 nm) using the BRD algorithm (Krotkov et al., 2006). In the BRD al-gorithm, the TOMS total ozone retrieval (OMTO3) (Bhar-tia and Wellemeyer, 2002) is firstly used to derive an ini-tial estimate of total ozone (assuming zero SO2), as well
as the wavelength-independent LER. The OMTO3 algo-rithm accomplishes this by matching calculated radiances using TOMS forward model (TOMRAD) (Dave, 1964) to the measured radiances at a pair of wavelengths (317.5 nm and 331.2 nm under most conditions). The measurements at 317.5 nm are used to derive total ozone; the measurements at 331.2 nm provide LER. Then the retrieved O3column and
LER are used as inputs in TOMRAD to obtain the calculated
N-pair values (N-pair=N (λshort)−N (λlong), N= −100·
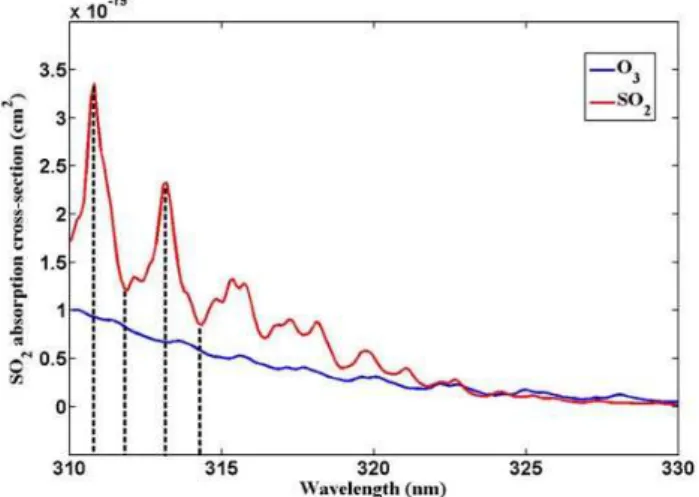
Fig. 1.O3 and SO2 absorption spectrum in UV band. The black dashed lines label the four wavelengths (310.8, 311.9, 313.2, and 314.4 nm) used in the SO2BRD retrieval.
at the three wavelength pairs (P1: 310.8 vs. 311.9 nm; P2: 311.9 vs. 313.2 nm; P3: 313.2 vs. 314.4 nm) (Fig. 1). The residuals at these three wavelength pairs are calculated as the differences between the measured and calculatedN-pair val-ues (N-pair=N (λshort)−N (λlong)). In the presence of SO2,
the residuals at three wavelength pairs are positively corre-lated with atmospheric SO2columns and three SO2columns
in the same OMI pixel can be obtained. The final SO2
col-umn is the average of three SO2columns.
The BRD algorithm takes advantage of the bands centered at the local minima and maxima of the SO2absorption cross
section between 310.8 and 314.4 nm (Bogumil et al., 2003) (Fig. 1), thereby maximizing the detection sensitivity to low SO2 columns. Note that the negative SO2 columns in this
paper are caused by the interference between the SO2and O3
absorption and can typically indicate very low SO2columns.
2.2 Forward model
TOMRAD accounts for all orders of scattering and gaseous absorptions (Dave, 1964) and was adopted to derive the cal-culatedN-pair value in this paper. In the forward computa-tion, the calculatedN-pair value is determined as follows: (1) OMI level 2 O3 column and LER retrieved by OMTO3
algorithm as inputs; (2) ozone profiles determined by match-ing the OMTO3 O3column to the TOMS-V8 ozone profile
climatology, which varies with latitude and ozone column (Bhartia and Wellemeyer, 2002; Wellemeyer et al., 1997; McPeters et al., 2007); (3) linear interpolation with eight solar zenith angles (15◦
, 30◦
, 45◦
, 60◦
, 70◦
, 77◦
, 84◦
, and 88◦
) and five viewing zenith angles (15◦
, 30◦
, 45◦
, 60◦
, and 70◦
); (4) the opaque surfaces characterized by the LER ob-tained from OMTO3 algorithm; (5) the initial guess of the zero SO2 column and the surface pressure of 1013.25 hPa;
and finally (6) the calculatedN-pair value as a function of
O3column, LER, solar zenith angle (SZA), view zenith
an-gle (VZA) and azimuth anan-gle (AZ) is estimated at the three wavelength pairs.
3 Data error sources
3.1 Systematic measurement errors
OMI makes the measurements of the Earth radiance and the solar irradiance in a Sun-synchronous orbit and provides fully contiguous coverage of the globe with 14 or 15 orbits daily. The measurements of solar irradiance are performed once a day. One solar irradiance product is nominally used for the operational processing of the Earth radiance measure-ments of one day (∼14 orbits).
OMI level 1b solar irradiances and Earth radiances are pre-calibrated using the Ground Data Processing Software (GDPS) developed by Dutch Space in the Netherlands (van den Oord et al., 2006). However, even after GDPS calibra-tion, the remaining systematic measurement errors (i.e., solar irradiance errors and Earth radiance errors in this paper) may cause the along- and cross-track biases in the SO2retrievals.
3.2 Solar irradiance errors
The solar irradiance measurements from a quartz volume dif-fuser depend on the viewing angle, the wavelength, as well as on the goniometry (incident azimuth and elevation an-gles of the Sun) onboard reflection diffuser (Veihelmann and Kleipool, 2006; Dobber et al., 2008). The viewing angle de-pendence, caused by calibration inaccuracies (Dobber et al., 2006), results in unequal responses for all viewing angles (up to 0.5 % error in UV2). The wavelength dependence in OMI UV2 spectral region has an amplitude of up to 0.1 % for the quartz volume diffuser (Dobber and Braak, 2010). The ir-radiance goniometry correction in the OMI GDPS software is realized by using the OPF calibration parameters derived from in-flight measurement data. However, when the azimuth angle on the diffuser falls below 18.3◦
or exceeds the value of 31.0◦
, large goniometry calibration inaccuracies may re-sult from extrapolation errors (Dobber et al., 2008). In addi-tion to these dependences, more noises can be introduced into the irradiance data because of increasing optical degradation (Dobber and Braak, 2010). These errors in solar irradiance are not constant and can cause the along-track stripes at spe-cific viewing angles (one viewing angle corresponds to one cross-track position) (Veihelmann and Kleipool, 2006).
3.3 Earth radiance errors
The systematic errors in the Earth radiance can cause cross-track biases into retrieved SO2columns. The Earth radiance
decrease of the value of level 1b radiance for the pixels at far off-nadir viewing angles (Dobber et al., 2008). This decrease has a subtle but significant effect on the OMI-retrieved SO2
columns. Increasing optical degradation of the primary tele-scope mirror also introduces noises into the measured Earth radiance. This degradation is difficult to monitor and cali-brate because no accurate standards over the full OMI wave-length range are readily available.
3.4 OMI row anomaly effects
Jaross and Warner have shown that no long-term degra-dation was observed in the earth radiance data during the three years after launch (from October 2004 to June 2007) (Jaross and Warner, 2008). However, the Earth radiance data at specific viewing angles have been severely affected by the row anomaly since June 2007 (Reference to the OMI row anomaly reports at http://www.knmi.nl/omi/research/ product/rowanomaly-background.php). A row anomaly is an anomaly which affects the OMI measurements of Earth radi-ance at all wavelengths for particular viewing angles of OMI (one viewing angle corresponds to one cross-track position). The row anomaly affects the quality of OMI level 1b Earth radiance data and consequently the retrieved SO2columns.
The row anomaly have four different types of ef-fects on OMI radiance spectra: (1) blockage effect that causes a decrease in the Earth radiance level for sev-eral viewing directions; (2) wavelength shift, which can be corrected by the OMI GDPS software version 1.1.3 (Voors, 2005); (3) Earth radiance from outside nominal field of view, which gives an additive error on the mea-sured earth radiance; and (4) solar radiation that causes an increase in the Earth radiance level (http://www.knmi. nl/omi/research/product/rowanomaly-background.php). The OMI row anomaly is dynamic, varying irregularly with time and location (Dobber and Braak, 2010).
According to the row anomaly effects on Earth radiance, the row anomaly could be divided into two types: one is the row anomaly in the northern latitudes, and another is the row anomaly along the full orbit. The row anomaly in the north-ern latitudes, mainly caused by the reflection of sunlight into the nadir port, can increase the Earth radiance level. But the row anomaly along the full orbit, mainly caused by blocking object, can decrease (blockage effect) and increase (Earth ra-diance from outside nominal field of view) the Earth rara-diance level (result is a net decrease under most conditions). Note that when row anomaly along the full orbit occurs, the row anomaly in the northern latitudes comprises a decrease and increase in the Earth radiance signal (result is a net increase).
4 Correction approaches for improvement of SO2 retrievals with row anomaly
The systematic measurement errors (Sects. 3.1.1 and 3.1.2), which vary with season and latitude, cause a background offset in the retrieved SO2 column. In an effort to
re-duce these systematic measurement errors, Yang developed a residual correction approach before the final SO2
col-umn retrieval (Yang et al., 2007). This approach calculates a median residual from a sliding group of pixels of SO2
-free (smaller than 2 DU, DU = Dobson Units, 1 DU = 2.69× 10¹⁶molecules cm−2) covering about 30◦latitude along the
orbit, and then subtracts the sliding median value for each spectral band and each cross-track position. With this ap-proach, the retrieved SO2bias caused by the systematic
er-rors can be reduced (Yang et al., 2007).
In addition to the systematic measurement errors, the SO2 PBL column retrievals have been affected by the row
anomaly since June 2007. The SO2 biases caused by row
anomaly cannot be effectively reduced by the residual correc-tion approach developed by Yang (Yang et al., 2007). To im-prove global measurements of atmospheric SO2from OMI,
we developed two effective correction approaches for im-provement of SO2retrievals with row anomaly in the
north-ern latitudes and along the full orbit, which are presented in this paper.
4.1 Row anomaly in the northern latitudes
Since May 2008, the cross-track positions 38–43 (1-based) have been affected by row anomaly in the northern latitudes, which results in an increase of the Earth radiance towards the northern end of the OMI orbit. To understand the character-istics of row anomaly in the northern latitudes, we took the residuals at wavelength pair P1 as a case study (cases of pairs P2 and P3 have similar row anomaly effects). Increase of the Earth radiance in the northern latitudes causes decrease in the measuredN-pair value at pair P1 (Fig. 2), and subsequent de-crease in the residuals (Fig. 3) and median residuals (Fig. 4) at P1. Because of the decrease of residuals in the northern lat-itudes, the residual correction approach with median residual from a sliding 30◦
latitude range is unsuitable when the row anomaly occurs.
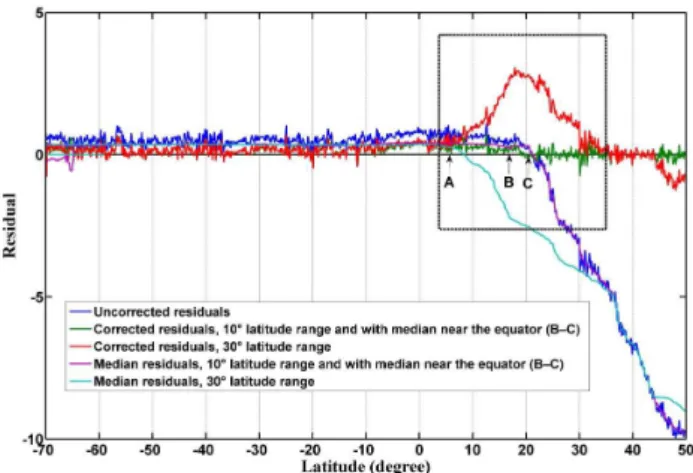
The pixels from row 41 of orbit 23909, which were af-fected by the row anomaly in the northern latitudes, were used as a case study. In Fig. 4, point A is about 15◦latitudes
south of point C (inflection point), where the residual begins to decrease. As shown in Fig. 4, when the centered pixel in the sliding group of pixels covering 30◦
latitude approaching the point A, more pixels with low residual values are selected for median residual calculation. Those low residual values (subsequently low median residuals) between points A and C (Fig. 4) cause anomalous high values of corrected residuals from latitudes 5◦
N to 35◦
Fig. 2.The measured N-pair values at wavelength pair P1 affected (row 41 of orbit 23909, 12 January 2009) and not affected (row 18 of orbit 23909) by the row anomaly in the northern part of the OMI orbit.
Fig. 3.The residuals at wavelength pair P1 affected (row 41 of orbit 23909, 12 January 2009) and not affected (row 18 of orbit 23909) by the row anomaly in the northern part of the OMI orbit. The black straight line represents theY=0 line.
40 DU) (inside red ellipse in Fig. 6). In this case, high values of the SO2 columns are not caused by strong SO2
absorp-tion, but rather by the underestimated median residuals from points A to C.
To make full use of the valid pixels not affected by the row anomaly from points A to C, median residuals from a smaller sliding window could better reduce the background errors. The question is what the suitable sliding window is. To answer this question, measurements from orbit 18637 (on 16 January 2008, little affected by the row anomaly) with latitudes ranging from∼0◦
to∼ +30◦
covering an oceanic area with low SO2emission were specifically selected.
Me-dian residuals from four different sliding window sizes cov-ering 5◦
, 10◦
, 20◦
and 30◦
latitude range are calculated. Fig-ure 5 shows that the median residuals from a sliding group of
Fig. 4.The residuals (row 41, orbit 23909) at wavelength pair P1 processed with median residual from a sliding 30◦latitude range
and with those from a sliding 10◦latitude range (for the pixels from
points B to C, median residuals near the equator are used). Points A and B are respectively about 15◦and 5◦latitudes south of point C
where the residual begins to be decreased because of row anomaly. The black straight line represents theY=0 line.
pixels (SO2 column less than 2 DU) covering 20◦ and 10◦
latitude are consistent with those covering 30◦
latitude in the cross-track direction. It also demonstrates that the me-dian residuals covering 5◦
latitude may not include sufficient information for background errors for residual correction. Therefore, the window with 10◦
latitude range was chosen for residual correction from points A to B of row 41 orbit 23909 (point B is about 5◦ latitude south of point C). It is
worth noting that there is a trade-off between the window size and the effectiveness of the residual correction: too big a window for residual correction might result in poor cor-rection under the row anomaly conditions, while too small a window might lead to reduction of the SO2information
con-tained in the non-anomaly area.
For the pixels from points B to C (transition zone), a small window with less than 10◦
latitude range is needed. How-ever, as shown in Fig. 5, such a window would not include the sufficient information for background errors for residual correction. In the extreme case of using the current line (SO2
column less than 2 DU) as median residual calculation, the corrected residual will be equal to 0. Therefore, for the pix-els from points B and C, we take the median residual near the Equator that is not affected by row anomaly as background values, like Krotkov who used the orbital equatorial averages for correction of SO2 retrievals (Krotkov et al., 2006). For
the pixels from point C to the terminator (latitude>85◦
), we use the residual correction approach with median resid-ual from a sliding 10◦
Fig. 5.Median residuals from four different sliding windows at wavelength pair P1 (swath line 1115, orbit 18637).
to C have no large decreases (Fig. 4), and the anomalous high SO2columns in the northern part of the orbit 23909 are
re-moved (see Fig. 6). For the consistency of residual correction over the globe, residual correction with median residual from a sliding 10◦
latitude range is also applied to the OMI pixels in the southern latitudes.
The row anomaly in the northern latitudes varies with time and location, so the location of point C (inflection point) changes irregularly and needs to be determined for each affected row. The correction approach for wavelength pair P1 can also be applied to the residuals at wavelength pairs P2 and P3. The final SO2 columns are the average of SO2
columns of three wavelength pairs P1, P2, and P3. Note that due to the exacerbated UV-light penetration problem (Krotkov et al., 2006), coupled with row anomaly effects in the northern latitudes, the Earth radiances at latitudes higher than point C have little correlation with the SO2absorption
and consequently SO2retrievals are in general not useful. It
is also worth noting that some rows of the sample results in Fig. 6 are also slightly affected by the row anomaly along the full orbit, which will be discussed in Sect. 4.2.
4.2 Row anomaly along the full orbit
Since January 2009, SO2 column retrievals have been
severely affected by the row anomaly along the full orbit caused by blocking object (see Figs. 11 and 12). The anomaly results in decrease of OMI level 1b radiance in certain po-sitions along the full orbit. Subsequently, the decreased ra-diance leads to large biases in the residuals (blue line in Fig. 10), which cannot be reduced by the correction approach described in Sect. 4.1.
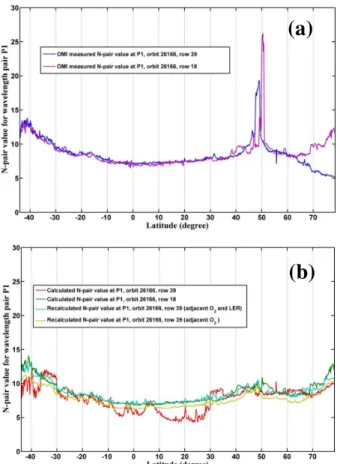
Different from those affected by row anomaly in the north-ern latitudes, the measuredN-pair values at P1 affected by the row anomaly along the full orbit are still positively cor-related with the SO2 columns. As shown in Fig. 9a, the
measuredN-pair values at P1 from row 39 of orbit 26166,
(a)
(b)
Fig. 6.SO2columns before (left panels) and after (right panels) cor-rection for the case with row anomaly in the northern latitudes:(a) orbit 22965, 8 November 2008;(b)orbit 23909, 12 January 2009. Note that the missing data in the above maps are due to the value of SO2column being less than−10.
which are affected by the row anomaly along the full or-bit, are consistent with those from row 18 not affected by the row anomaly. Both of them have a large increase in the northern∼50◦
latitude because of the volcanic eruption (Sarychev volcano eruption starting on 11 June 2009, Global Volcanism Program). The reason for the good relationship between measuredN-pair value and SO2 column would be
that the decrease of Earth radiance caused by row anomaly along the full orbit could be cancelled by using pair N values (N-pair=N (λshort)−N (λlong)).
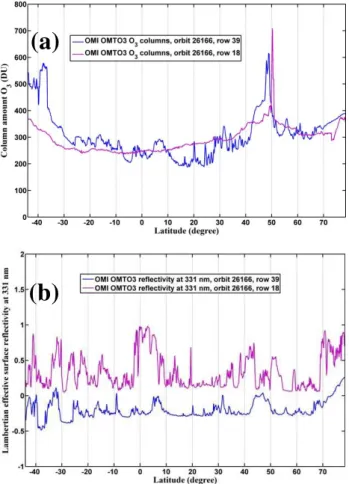
The residual biases along the full orbit are mainly caused by the anomalous O3 column and underestimated LER,
which are used as inputs to obtain the calculated N-pair value in the BRD algorithm. The OMTO3 O3column and
LER are estimated by matching calculated radiances to the measured radiances at a pair of wavelengths (317.5 nm and 331.2 nm under most conditions). But the reduction of radi-ances caused by the row anomaly results in large biases in the retrieved O3column and LER (Fig. panels 7a and b). The
biases existed in the O3 columns as large as 30 % for orbit
26166 (increasing 1 % O3columns causes 5–15 % increase
in retrieved SO2column), and the underestimate of LER is as
(a)
(b)
Fig. 7.OMI O3columns(a)and LER(b)from rows 39 and 18 of orbit 26166. Rows 39 and 18 are respectively affected and not affected by the row anomaly along the full orbit.
and underestimated LER (row 39, orbit 26166), the calcu-latedN-pair values from TOMRAD model computation are inconsistent with those not affected by the row anomaly at row 18 (Fig. 9b). This inconsistency of calculatedN-pair val-ues causes large errors in the residuals at P1 (Fig. 10).
Consequently, reasonable O3 columns are needed to
ob-tain the calculated N-pair values for the rows affected by row anomaly over a full orbit. The atmospheric O3,
approx-imately 90 % of which resides in the stratosphere, changes little in nearby latitude in the same orbit (Fig. 8) (Smith, 1989). Therefore, the adjacent O3 column not affected by
the row anomaly could be chosen to represent the anoma-lous O3column at row 39 affected by the row anomaly. Then
the calculatedN-pair values are recalculated using adjacent O3columns as input. Consequently, large biases (caused by
anomalous O3 column) in the calculatedN-pair values can
be reduced, as shown in Fig. 9b.
In the case of using adjacent O3column to represent the
anomalous O3column, the underestimate of LER causes a
decrease in the calculatedN-pair value compared with that using the adjacent O3column and LER (Fig. 9b). Different
from the case of O3 column retrieval, LER retrieved from
Fig. 8.Relative variation of O3column and LER with cross track position (6 October 2004, swath line 1000, orbit 01208, not affected by the row anomaly)
331 nm have large variation in nearby latitude because of different surface type and cloud cover, as shown in Fig. 8. Therefore, it is not suitable to use adjacent LER to represent the underestimated LER affected by the row anomaly. Fortu-nately, the decreases of the calculatedN-pair values, which are caused by the underestimated LER, are almost unchanged along the full orbit compared with the calculatedN-pair val-ues using the adjacent O3column and LER (Fig. 9b).
There-fore, the decreases in the calculatedN-pair values could be removed by the residual correction approach with median residual from a sliding 10◦
latitude range. After processed with above mentioned procedures, the biases in the residuals at row 39 can be significantly reduced, as shown in Fig. 10. The corrected residuals at row 39 are consistent with those at row 18, which have a high value at∼50◦
latitude north be-cause of the volcanic eruption (Sarychev volcano eruption). Subsequently, the large biases in SO2columns of orbit 26166
can be effectively reduced by using the corrected residuals (see Fig. 11).
5 Results and discussion
5.1 Full orbit comparisons
As discussed in Sect. 4, the SO2 biases caused by row
anomaly can be effectively reduced after processed with our correction approaches. To evaluate the effectiveness of our correction approaches, several orbits covering different days with row anomaly effects from November 2008 to Novem-ber 2009 were selected to compare the SO2columns before
and after correction. As shown in Fig. 12, the SO2 biases
caused by row anomaly are reduced by modification of slid-ing median range and corrections of anomalous O3and LER
(a)
(b)
Fig. 9. (a)OMI measuredN-pair values for rows 39 and 18 of orbit 26166;(b) calculatedN-pair values for rows 39 and 18 of orbit 26166, and recalculatedN-pair values for row 39 of orbit 26166. Rows 39 and 18 are respectively affected and not affected by the row anomaly along the full orbit.
To evaluate the effectiveness of our correction approaches for the case when low SO2 columns are affected by the
row anomaly, SO2columns of orbit 26166 (16 June 2009)
with latitudes ranging from∼0◦
to∼ +20◦
(North Pacific Ocean area) were selected. With very low anthropogenic SO2emission and no volcanic eruption events (see Volcanic
Activity Reports from Global Volcanism Program) in this area, the SO2 columns should be near zero (Chin et al.,
2000). Affected by the systematic measurement errors and row anomaly, the SO2columns are larger or less than 0 over
the selected area. Under non-anomaly conditions, the biases in the SO2columns can be reduced by the median
residu-als from a sliding 30◦ latitude range. However, under the
row anomaly conditions, this approach fails to reduce the row anomaly effects and the average SO2 columns of orbit
26166 over the North Pacific Ocean area show significant in-creases at cross-track positions 31–41 and 48–50 (Fig. 13). But with our correction approaches for the row anomaly ef-fects, these anomalous high SO2columns are reduced to near
zero (Fig. 13), which demonstrates the effectiveness of our correction approaches for the case with low SO2columns
af-fected by row anomaly.
Fig. 10.The residuals from row 39 of orbit 26166 (16 June 2009) before and after correction for the row anomaly effects along the full orbit. Rows 39 and 18 are respectively affected and not affected by the row anomaly along the full orbit. The black straight line rep-resents theY =0 line.
Fig. 11.SO2columns of orbit 26166 (16 June 2009) processed with median residual from a sliding 30◦latitude range (left) and with the
correction approaches for the row anomaly effects (right). Note that the missing data in the above maps are due to the value of SO2 column being less than−10.
5.2 Limitations and discussion
5.2.1 Underestimation
When the row anomaly occurs, the residual correction ap-proach with median residual from a sliding 10◦latitude range
is also applied to the pixels outside the row anomaly areas for the consistency of global residual correction presented in this paper. However, for the pixels not affected by row anomaly, there is a difference between SO2 columns
pro-cessed with median residual from a sliding 30◦
latitude range and with those from a sliding 10◦
latitude range. To evaluate the difference of sliding 30◦
and 10◦
latitude range on the retrieved SO2columns, the pixels from the northern area of
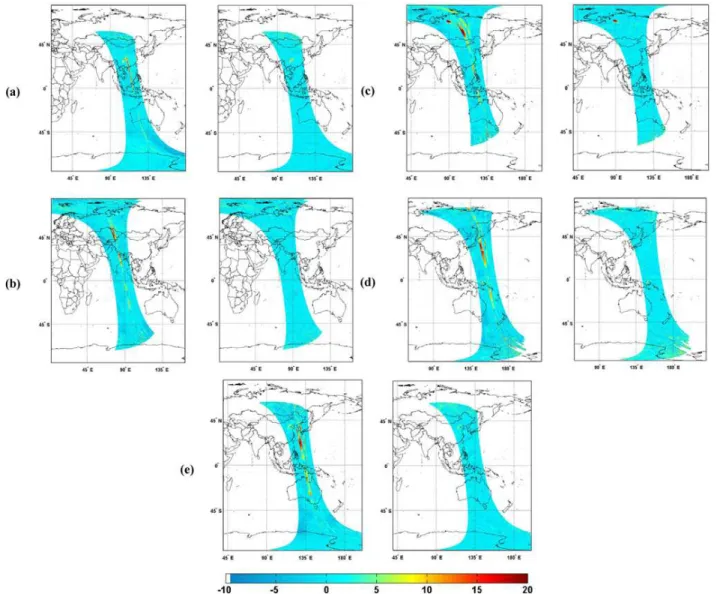
Fig. 12.Comparisons between SO2columns processed with median residual from a sliding 30◦latitude range (left panels) and with the
correction approaches for the row anomaly effects (right panels):(a)orbit 23911, 12 January 2009;(b)orbit 25179, 9 April 2009;(c)orbit 25731, 17 May 2009;(d)orbit 27783, 5 October 2009;(e)orbit 28279, 8 November 2009. Note that the missing data in the above maps are due to the value of SO2column being less than−10.
selected. For orbit 18639 (16 January 2008), the row anoma-lies have very little impact on the retrieved SO2 columns,
as eastern China has a large area of high SO2 emissions
(Fig. 14).
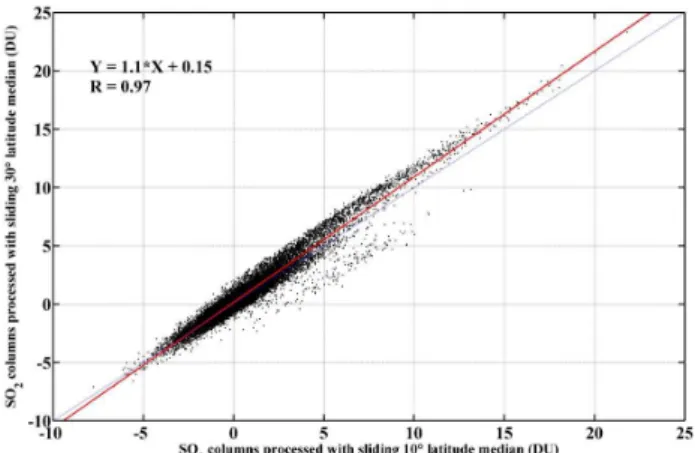
The SO2 columns processed with median residual from
a sliding 30◦
latitude range and with those from a 10◦
lat-itude range show good correlation for orbit 18639 (correla-tion coefficient reaching to 0.97) (Fig. 15). However, median residuals from a sliding 10◦
latitude range cause a slight un-derestimation for the case with high SO2 column amounts.
As shown in Fig. 15, in the case when the SO2 columns
are larger than 10 DU, the SO2columns processed with
me-dian residual from a sliding 10◦
latitude range are underes-timated by 6 % to 16 % compared with those from a sliding 30◦
latitude range. The slope of regression line is larger than
1, which also proves the underestimation for orbit 18639. This underestimation is mainly related to a large area of high SO2 emissions in eastern China. When the sliding range is
changed from 30◦latitude to 10◦latitude in China, more
pix-els with high SO2columns are included for median residual
calculation. Therefore, increased median residuals result in the slight underestimation of SO2column amount in China.
For the case with low SO2columns (less than 10 DU), the
un-derestimations are uncertain (overestimations may also oc-cur) because of the uncertainty of median residuals from a sliding 30◦
and 10◦
latitude range.
We recognize that the precise SO2vertical column is
im-portant, and that the residual correction with median residual from a sliding 10◦
Fig. 13.Average SO2column amount for each row index before and after correction for the row anomaly effects. Data from orbit 26166 with latitudes ranging from∼0◦to∼ +20◦(North Pacific Ocean area).
Fig. 14.SO2columns of orbit 18639 (16 January 2008) with lati-tudes ranging from∼0◦to∼ +45◦. (Left) results processed with
median residual from a sliding 30◦latitude range, (right) results
processed with median residual from a sliding 10◦latitude range.
background errors in the residuals are dynamic and difficult to obtain over the globe. Various mathematical approaches for background errors correction may have different effects on the accurate retrieval of SO2 column. Current SO2
re-trieval approaches (BRD, LF and DOAS) can only obtain the relative SO2 columns, but not absolute SO2results.
There-fore, the residual correction approach with median residual from a sliding 10◦latitude range can be considered as an
ef-fective approach for the case when the row anomaly occurs. For the orbits that were not affected by the row anomaly (be-fore June 2007), we recommend using the residual correction approach developed by Yang (Yang et al., 2007), which cal-culates median residual from a sliding 30◦
latitude range.
5.2.2 O3column and LER errors
In the BRD algorithm, O3column and LER used as inputs
can interfere with SO2retrieval in the ultraviolet band. Under
Fig. 15.Scatterplots of SO2columns processed with median resid-ual from a sliding 30◦latitude range versus with those from a sliding
10◦latitude range for orbit 18639. The blue dashed line represents
theY=Xline. The red solid line denotes the regression line.
non-anomaly conditions, the interference from O3absorption
causes negative SO2column. Under the row anomaly
condi-tions, the decrease and increase of OMI measured radiances since June 2007 result in large biases in the retrieved O3
col-umn and LER, and subsequently make it more difficult to get accurate SO2retrieval.
The row anomaly effects on measured radiances lead to the anomalous O3 column and underestimated LER at 331 nm.
In this paper, we utilize the adjacent O3column not affected
by the row anomaly to reduce the SO2biases caused by the
anomalous O3column, and use residual correction with
me-dian residual from a sliding 10◦
latitude range to reduce the SO2biases caused by the underestimated LER. However, in
the special case when there is a large difference between the adjacent O3column and the actual O3columns in anomaly
area, the adjacent O3 column can lead to large bias in the
retrieved SO2column. Besides, if the row anomaly causes a
very large reduction in the measured radiance, the remaining LER error after residual correction can still lead to large bias in the retrieved SO2column.
When the measured radiance data are affected by very se-vere row anomaly, the SO2columns after our correction
ap-proaches will still have large biases. In the extreme case, the row anomaly effects are so large that the measurement N -pair values have no correlation with the SO2columns. In this
case, new effective corrections for the affected Earth radiance at specific viewing angles are needed.
6 Conclusions
We have presented two correction approaches for improve-ment of OMI SO2 PBL retrieval with row anomaly in the
BRD algorithm are greatly reduced so that consistent SO2
values are achieved both inside and outside of row anomaly areas. The correction approaches for the row anomaly effects can extend the valid range of OMI SO2PBL data produced
using the BRD algorithm.
In addition to the instrument measurement errors, the re-trieval algorithm model errors, which are not discussed in this study, can bring about more complex biases in retrieved SO2
columns. Over the years, a number of algorithms (DOAS, BRD, LF, etc.) for determining SO2 from satellite
instru-ments have been developed in the ultraviolet spectral region (310 nm to 340 nm). However, the retrieved SO2 columns
using these algorithms are affected by the nonlinear effect (Yang et al., 2007), because they assume an approximate lin-ear relationship between SO2columns and the reflected TOA
radiation. This linear approximation leads to an underesti-mation of the actual SO2 column by the BRD, DOAS and
LF algorithms, especially with a large SO2column. Besides,
O3, which is a strong absorber in the ultraviolet spectral
re-gion, needs to be distinguished from SO2, which is small in
the atmosphere under most conditions and has little absorp-tion effect on the ultraviolet radiance. Therefore, the quan-titative retrieval of SO2column, especially low near-surface
SO2column, needs further study.
Acknowledgements. This research was supported by the Strategic
Pilot Project of Chinese Academy of Sciences (B) (Grant No: XDB05030100). The authors would like to thank two anonymous reviewers for their assistance in evaluating this paper. We are grateful to the members of the OMI science team for providing OMI level 1b Earth radiance and solar irradiance data, as well as OMI level 2 O3 and SO2 products (http://disc.gsfc.nasa.gov/). Thanks also to Remco Braak for communications of OMI data errors through emails.
Edited by: D. Loyola
References
Bhartia, P. K. and Wellemeyer, C. W.: TOMS-V8 total ozone al-gorithm, in: OMI Algorithm Theoretical Basis Document, OMI Ozone Products, edited by: Bhartia, P. K., Greenbelt, MD: NASA/Goddard Space Flight Center, 2002.
Bogumil, K., Orphal, J., Homann, T., Voigt, S., Spietz, P., Fleis-chmann, O. C., Vogel, A., Hartmann, M., Kromminga, H., Bovensmann, H., Frerick, J., and Burrows, J. P.: Measurements of molecular absorption spectra with the SCIAMACHY pre-flight model: instrument characterization and reference data for atmospheric remote-sensing in the 230–2380 nm region, J. Photoch. Photobio. A, 157, 167–184, doi:10.1016/S1010-6030(03)00062-5, 2003.
Carn, S. A., Krueger, A. J., Krotkov, N. A., Yang, K., and Levelt, P. F.: Sulfur dioxide emissions from Peruvian copper smelters de-tected by the Ozone Monitoring Instrument, Geophys. Res. Lett., 34, L09801, doi:10.1029/2006GL029020, 2007.
Chin, M., Savoie, D. L., Huebert, B. J., Bandy, A. R., Thorn-ton, D. C., Bates, T. S., Quinn, P. K., Saltzman, E. S., and De Bruyn, W. J.: Atmospheric sulfur cycle simulated in the global model GOCART: Comparison with field observations and regional budgets, J. Geophys. Res., 105, 24689–24712, doi:10.1029/2000JD900385, 2000.
Corradini, S., Merucci, L., and Prata, A. J.: Retrieval of SO2from thermal infrared satellite measurements: correction procedures for the effects of volcanic ash, Atmos. Meas. Tech., 2, 177–191, doi:10.5194/amt-2-177-2009, 2009.
Cullis, C. F. and Hirschler, M. M.: Atmospheric Sulfur- Natural and Man-made sources, Atmos. Environ., 14, 1263–1278, 1980. Dave, J. V.: Meaning of successive iteration of the auxiliary
equa-tion of radiative tranfer, Astrophys. J., 140, 1292–1303, 1964. Dobber, M. R. and Braak, R.: Known instrumental effects that
af-fect the OML1B product of the Ozone Monitoring Instrument on EOS Aura, last update: 17 December 2010.
Dobber, M. R., Dirksen, R. J., Levelt, P. F., Van den Oord, G. H. J., Voors, R. H. M., Kleipool, Q., Jaross, G., Kowalewski, M., Hilsenrath, E., Leppelmeier, G. W., de Vries, J., Dierssen, W., and Rozemeijer, N. C.: Ozone Monitoring In-strument Calibration, IEEE T. Geosci. Remote, 44, 1209–1238, doi:10.1109/TGRS.2006.869987, 2006.
Dobber, M. R., Kleipool, Q., Dirksen, R. J., Levelt, P. F., Jaross, G., Taylor, S. L., Kelly, T. J., Flynn, L. E., Leppelmeier, G. W., and Rozemeijer, N. C.: Validation of ozone monitoring instru-ment level 1b data products, J. Geophys. Res., 113, D15S06, doi:10.1029/2007JD008665, 2008.
Finlayson-Pitts, B. J. and Pitts, J. N.: Chemistry of the Upper and Lower Atmosphere, Academic Press, San Diego, USA, 2000. IPCC: Climate Change 2001: The Scientific Basis, Contribution
of Working Group I to the Third Assessment Report of the In-tergovernmental Panel on Climate Change (IPCC), edited by: Houghton, J. T., Ding, Y., Griggs, D. J., Noguer, M., van der Linden, P. J., Dai, X., Maskell, K., and Johnson, C. A., Cam-bridge University Press, CamCam-bridge, UK and New York, NY, USA, 881 pp., 2001.
Jaross, G. and Warner, J.: Use of Antarctica for validating reflected solar radiation measured by satellite sensors, J. Geophys. Res., 113, D16S34, doi:10.1029/2007JD008835, 2008.
Khokhar, M. F., Frankenberg, C., Van Roozendael, M., Beirle, S., K¨uhl, S., Richter, A., Platt, U., and Wagner, T.: Satellite ob-servations of atmospheric SO2 from volcanic eruptions during the time-period of 1996–2002, Adv. Space Res., 36, 879–887, doi:10.1016/j.asr.2005.04.114, 2005.
Krotkov, N. A., Carn, S. A., Krueger, A. J., Bhartia, P. K., and Yang, K.: Band Residual Difference Algorithm for Retrieval of SO2 From the Aura Ozone Monitoring Instrument (OMI), IEEE T. Geosci. Remote, 44, 1259–1266, 2006.
Krotkov, N. A., McClure, B., Dickerson, R. R., Carn, S. A., Li, C., Bhartia, P. K., Yang, K., Krueger, A. J., Li, Z. Q., Levelt, P. F., Chen, H. B., Wang, P. C., and Lu, D.: Validation of SO2retrievals from the Ozone Monitoring Instrument over NE China, J. Geo-phys. Res., 113, D16S40, doi:10.1029/2007JD008818, 2008. Krueger, A. J.: Sighting of El Chich´on Sulfur Dioxide Clouds with
the Nimbus 7 Total Ozone Mapping Spectrometer, Science, 220, 1377–1379, 1983.
Trace Gas Algorithms, 2, edited by: Chance, K., Smithsonian As-trophysical Observatory, Cambridge, MA, 49–59, 2002. Lee, C., Richter, A., Weber, M., and Burrows, J. P.: SO2Retrieval
from SCIAMACHY using the Weighting Function DOAS (WF-DOAS) technique: comparison with Standard DOAS retrieval, Atmos. Chem. Phys., 8, 6137–6145, doi:10.5194/acp-8-6137-2008, 2008.
Levelt, P. F., Van der Oord, G. H. J., Dobber, M. R., Malkki, A., Visser, H., de Vries, J., Stammes, P., Lundell, J. O. V., and Saari, H.: The Ozone Monitoring Instrument, IEEE T. Geosci. Remote, 44, 1093–1101, 2006.
Li, C., Zhang, Q., Krotkov, N. A., Streets, D. G., He, K. B., Tsay, S. C., and Gleason, J. F.: Recent large reduction in sulfur dioxide emissions from Chinese power plants observed by the Ozone Monitoring Instrument, Geophys. Res. Lett., 37, L08807, doi:10.1029/2010GL042594, 2010.
McPeters, R. D., Labow, G. J., and Logan, J. A.: Ozone climatolog-ical profiles for satellite retrieval algorithms, J. Geophys. Res., 112, D05308, doi:10.1029/2005JD006823, 2007.
Platt, U.: Differential optical absorption spectroscopy (DOAS), in: Air Monitoring by Spectroscopic Techniques, Chemical Analy-sis Series, edited by: Sigrist, M. W., John Wiley & Sons, Inc., 127, 27–84, 1994.
Platt, U. and Stutz, J.: Differential Optical Absorption Spec-troscopy: Principles and Applications, Physics of Earth and Space Environments, Hardcover, Springer, Verlag Berlin Heidel-berg, 593 pp., 2008.
Realmuto, V. J., Abrams, M. J., Buongiorno, M. F., and Pieri, D. C.: The use of multispectral thermal infrared image data to esti-mate the sulfur dioxide flux from volcanoes: A case study from Mount Etna, Sicily, 29 July 1986, J. Geophys. Res., 99, 481–488, doi:10.1029/93JB02062, 1994.
Richter, A., Wittrock, F., and Burrows, J. P.: SO2 measure-ments with SCIAMACHY, Atmospheric Science Conference, Eur.Space Agency Cent. for Earth Obs., Frascati, Italy, 8– 12 May 2006.
Rix, M., Valks, P., Van Gent, J., Van Roozendael, M., Spurr, R., Hao, N., Emmadi, S., and Zimmer, W.: Monitoring of volcanic SO2 emissions using the GOME-2 satellite instrument, Geophys. Res. Abstr., EGU2010-4754, EGU General Assembly 2010, Vienna, Austria, 2010.
Seinfeld, J. H. and Pandis, S.: Atmospheric Chemistry and Physics, John Wiley & Sons, New York, USA, 1998.
Smith, R. C.: Ozone, Middle Ultraviolet-Radiation and the Aquatic Environment, Photochem. Photobiol., 50, 459–468, 1989. Van den Oord, G. H. J., Voors, R. H. M., and De Vries, J.: The Level
0 to Level 1B processor for OMI radiance, irradiance and cal-ibration data, in: OMI Algorithm Theoretical Basis Document, OMI instrument, Level 0–1b processor, Calibration & Opera-tions, edited by: Levelt, P. F., 2002.
Van den Oord, G. H. J., Rozemeijer, N. C., Schenkelaars, V., Levelt, P. F., Dobber, M. R., Voors, R. H. M., Claas, J., De Vries, J., Ter Linden, M., De Haan, C., and de Berg, T. V.: OMI level 0 to 1b processing and operational aspects, IEEE T. Geosci. Remote, 44, 1380–1397, doi:10.1109/TGRS.2006.872935, 2006.
Veihelmann, B. and Kleipool, Q.: Reducing Along-Track Stripes in OMI-Level 2 Products, TN-OMIE-KNMI-785, 24 pp., 2006. Voors, R.: OMI GDPS Algorithm to correct for wavelength shifts
due to inhomogeneous slit illumination, TN-OMIE-KNMI-680, Issue 1, 2005.
Wellemeyer, C. G., Taylor, S. L., Seftor, C. J., McPeters, R. D., and Bhartia, P. K.: A correction for total ozone mapping spectrometer profile shape errors at high latitude, J. Geophys. Res., 102, 9029– 9038, 1997.
Yan, H. H., Chen, L. F., Tao, J. H., Han, D., Su, L., and Yu, C.: SO2long-term monitoring by satellite in the Pearl River Delta, Journal of Remote Sensing, 16, 390–404, 2012.