Proceedings
ISBN 978-989-8780-06-5
25
th
APDR Congress | ISBN 978-989-8780-06-5
1
Table of Contents
TABLE OF CONTENTS ... 1
PROGRAMME OVERVIEW ... 2
THEMES ... 3
Umbrella Theme ... 3
General Themes ... 3
Special Sessions’ Themes ... 3
COMMITTEES ... 1
ORGANIZATION ... 1
CONGRESS VENUE ... 1
PAPERS & ABSTRACTS ... 2
Plenary Session I ...3
Parallel Sessions (1) ... 12
SS02.1 Waterfront Redevelopment Processes: New Issues and Challenges ... 13
SS05 Inclusive Cities – Relations with Urban Real Matrix ... 35
RS01.1 Conceptualisation and Models in Regional Development ... 51
RS02 Territorial Development Policies for Circularity ... 69
RS04 Technological Innovation, New Products and Business Models ... 79
RS17 Circular Economy and Sustainable Development Goals (SDG) ... 97
Parallel Sessions (2) ... 111
SS02.2 Waterfront Redevelopment Processes: New Issues and Challenges ... 112
SS07 Reorganização Administrativa e Desenvolvimento Territorial em Portugal: Entre a Discussão Técnica e a Agenda Política 121 SS14 Circular Economy and Innovation for Sustainability ... 142
RS01.2 Conceptualisation and Models in Regional Development ... 160
RS03.1 Strategies of Circular Economy ... 186
RS05 Regional Innovation, Clusters and Ecosystems ... 210
Parallel Sessions (3) ... 220
SS03 Understanding Decision Making Processes in Wicked Problems: Conflicts and Collaboration in Urban Areas of Illegal Genesis ... 221
SS08 Challenges in Creative Tourism in Urban and Rural Territories ... 240
RS01.3 Conceptualisation and Models in Regional Development ... 266
RS03.2 Strategies of Circular Economy ... 280
RS07 Sectoral Policies and Circularity ... 297
Parallel Sessions (4) ... 308
SS09 Regional Development and Agribusiness in Different Territorial Contexts ... 309
RS16 Production, Consumption and Food Waste in the Context of the Circular Economy ... 342
RS13.1 Cities and Spatial Planning in the Circular Economy & SS12 Social Innovation and Regional Development: Conceptualisation, Measurement and Practice... 354
RS09 Circular Economy and Promotion of Territories... 365
RS08 Circular Economy and Labour Markets & RS14.1 Management of Resources and Natural Systems ... 380
Parallel Sessions (5) ... 410
SS10 URBAN-RURAL synergies ... 411
SS15.1 Abordagens e Ferramentas Participativas no Planeamento, na Gestão Urbana e na Inteligência Territorial ... 415
RS13.2 Cities and Spatial Planning in the Circular Economy ... 428
RS10 Management of Urban and Peri-Urban Metabolism & RS12 Urban Regeneration, Real Estate Markets and Circular Economy ... 440
RS14.2 Management of Resources and Natural Systems ... 468
Parallel Sessions (6) ... 471
SS11 Complementarities of Cultural and Creative Activities and Territorial Development ... 472
SS15.2 Abordagens e Ferramentas Participativas no Planeamento, na Gestão Urbana e na Inteligência Territorial ... 491
SS16 Dinâmicas Territoriais Emergentes na Região de Lisboa ... 501
RS11 Energy Production and Consumption for a Sustainable Future & RS15 Conserve and Sustainable Use of the Oceans, Seas and Marine Resources ... 525
Programme Overview
Thursday, 5 July
Friday, 6 July
Registration desk
[08:30-16:00]Registration desk
[08:30-13:00]Parallel Sessions (1)
[09:00 - 10:30]Parallel Sessions (4)
[09:00-10:30]COFFEE-BREAK
[10:30-11:00]COFFEE-BREAK
[10:30-11:00]Formal Opening
[11:00-11:15 | Auditorium 1]Plenary Session II
Urban Metabolism - the basis for designing a
Circular Economy Approach
by Paulo Ferrão
[11:00-12:00 | Auditorium 1]
Plenary Session I
A Economia Circular para o Desenvolvimento
Regional e o Ordenamento do Território
by João Pereira Teixeira
Cooperação Territorial Europeia – INTERREG
Presente e Futuro
by
Ana-Paula Laissy [11:15-13:00 | Auditorium 1]LUNCH
[12:00-13:30]LUNCH
[13:00-14:00]Parallel Sessions (5)
[13:30-15:00]Parallel Sessions (2)
[14:00-15:30]COFFEE-BREAK
[15:00-15:30]COFFEE-BREAK
[15:30-16:00]Parallel Sessions (6)
[15:30 – 17:00]Parallel Sessions (3)
[16:00 – 17:30]Closing Session
[17:00-18:00 | Auditorium 1]APDR General Assembly
[17:30-18:30 | Room TA 05]
OFFICIAL DINNER
106
25
th
APDR Congress | ISBN 978-989-8780-06-5
1136 MODELLING CARBON CAPTURE FOR CONTINENTAL PORTUGAL BASED ON
LAND COVER CHANGES
Jorge Cunha1, J. David2, P. Cabral3
1 NOVA Information Management School (NOVA IMS), Universidade Nova de Lisboa, Campus de Campolide, 1070-312 Lisboa, Portugal, Portugal,
2 NOVA Information Management School (NOVA IMS), Universidade Nova de Lisboa, Campus de Campolide, 1070-312 Lisboa, Portugal,
3 NOVA Information Management School (NOVA IMS), Universidade Nova de Lisboa, Campus de Campolide, 1070-312 Lisboa, Portugal,
ABSTRACT
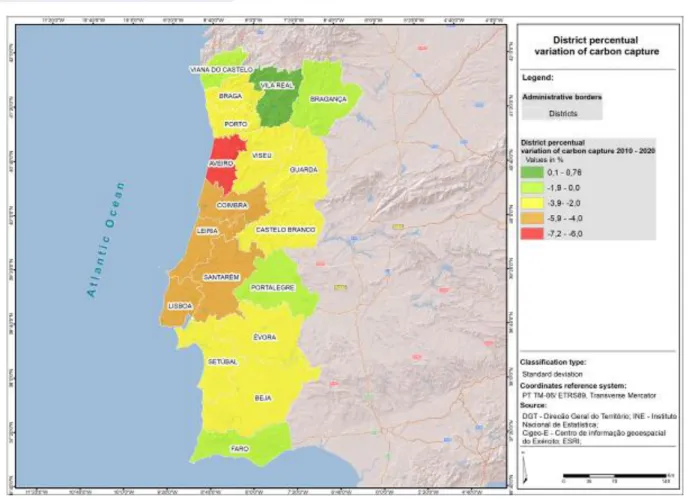
Sustainable Development Goals number 13 and 15 settled by the United Nations in 2015 intends to tackle climate change and protect life on land by setting specific targets which are needed to be achieved over the next 12 years. Consequently, ecosystem services research, such as carbon sequestration and its climate regulatory function, have been highlighted. The land use, land-use change, and forestry (LULUCF) play a main role in the spatial modelling of carbon sequestration. In this study we used GIS and statistical tools to model carbon sequestration in mainland Portugal between years 2007 and 2010 based on land cover changes. A business as usual approach was adopted to extrapolate previous changes to 2020 and quantify the impact of existing land use and land cover policies on carbon capture. Results show that there was a negative variation, or a loss of carbon capture, of -5,4% between 2010 and 2020 at national level. For year 2020 the results at the district level followed the same pattern of the period from 2007 to 2010. The major negative variations between 2007 and 2010 were observed in Aveiro (-7,2%), Leiria (-5,6%) and Coimbra (-5,2%). Only Vila Real had slight increase in the carbon stored (0,8%). This approach may be useful for monitoring carbon storage over time and the provide environmental managers with tools to mitigate climate change more effectively.
Keywords: carbon sequestration, ecosystem services, multi-temporal scenarios, spatial modelling
1 INTRODUCTION
Sustainable development is an obligatory requirement for a shift in human relationship with the environment to safeguard Earth for future generations (OECD 2016). The United Nations 2030 Agenda stablished 17 ambitious goals that will directly improve life on Earth. Among them, goals number 13 “take urgent action to combat climate change and its impacts” and number 15 “sustainably manage forests, combat desertification, halt and reverse land degradation, halt biodiversity loss” (United Nations 2015) are directly related to reduce and stop unwanted effects on the Planet, that potentially would lead to primary negative consequences.
Scientists worldwide believe that the main result of global warming is due the emission of green gases, in which carbon dioxide (CO2)
contributes to more than half for the cause(Adeyemi, Abu-Zahra, & Alnashef, 2017).
Those gases concentration levels in atmosphere were naturally ascending and descending during geological eras, however, by human activities since industrialization period the amount of CO2 is rising in a huge scale, mainly due to the burning of fossil fuels (Ma 1998)
and deforestation (NASA 2018). It is still important to mention that CO2 is not only increasing in the atmosphere but also in the sea,
and even if direct effects of CO2 in sea waters may have small consequences, indirect effects (such as pH saturation) may be serious
(Nienhuis 2010).
If the main source of global climate change is human induced alterations in the composition of the atmosphere (Karl 2003), societies must also be the source for the the solution, tackling political, scientifically, technical, economical, and institutional impediments to overcome this obstacle.
Yet, the USA is facing critical times by the federal government withdrawal of the global climate agreements. A recent study shows that mandatory policies are in fact reducing CO2 emissions while voluntary ones are not (Martin 2017). In other developed countries,
renewable energy consumption contributes to economic growth in long-term planning (Ito 2017), but in developing nations such as the Africans, CO2 emissions are found higher in richer states, in spite renewable energies are labelled as an efficient substitute for
conventional energy production (Zoundi 2017).
On the other hand, land use and land cover have a vital importance to retain CO2 emissions. Forest contributions to capture and store
those gases are less discussed in the literature comparing with other thematic like the renewable energies (Ni 2016), although CO2
capture and storage states as a crucial strategy for meeting emission reduction targets (Leung 2014). Vegetation and soils in terrestrial ecosystems can accumulate atmospheric CO2 by the way of land use, land-use change, and forestry (LULUCF), defined by the United
Nations as “a greenhouse gas inventory sector that covers emissions and removals of greenhouse gases resulting from direct human-induced land use, land-use change and forestry activities” (United Nations n.d.a). LULUCF aims for stabilization of atmospheric greenhouse gas concentrations and the sector has a major importance for ecosystems as most of the changes in land use affects carbon held in soils and vegetation, where exactly the biggest fluxes of carbon derive from clearing forests for croplands and convert forests in open lands, and vice-versa (Houghton 2004).
The EU environmental policy focus on nature and biodiversity protection by reducing land fragmentation and support several ecosystems services (European Environment Agency 2016.). Each Member State is now induced to be more climate-friendly in terms of land use as the 2016 “no debit rule” firms that emissions from land use are totally compensated by an equal removal of CO₂ in the atmosphere (European Commission n.d.). Still, the European Commission (EC) admits that with the ongoing implemented policies, greenhouse gases emissions are not expected to adequately cutback their percentage values to reach European Union's target reductions(European Commission, 2018). In the same reference, EC describe that “national reduction targets which provide the incentive for further policies driving deeper reductions are required” (idem). Considering national level, the Portuguese municipalities are engaged to apply sustainable environmental concepts on their spatial land planning, following EU directives.
Briefly, Continental Portugal registered slightly changes on land use and land cover in 1995-2010 period. Forests (2,3%), artificially territories (1,2%), agroforestry systems (0,7) and water bodies (0,3%) increased over the country, while agriculture (-2,1%), grassland (-0,6%), and bushland (-0,5%) had some loses (Caetano, Igreja, Marcelino, & Costa, 2017). Nevertheless, the country was
hugely affected during 2003, 2007, and 2017 by devastating forest fires, which intensified the release of CO2 to the atmosphere. To
achieve 2050 Paris agreement expected to be neutral of carbon, our forests need to be a fully healthy ecosystem that sink the CO2, such
as the quantity processed by industry. In that domain, it is ineluctable transforming agriculture and forestry systems to limit global temperature to rise more than 2, or even 1.5 degrees (United Nations n.d.b).
Despite CO2 fluctuations over time, anthropogenic gases emissions and their risks to human health, society and the environment are
irreversible at human scale (Solomon 2009). In fact, climate change impact on economic growth, the interaction between damage and GDP, and the rate of adaptation are still uncertain which needs to be investigated (Moor 2015). Quantifying and understanding the carbon cycle is crucial to enlighten changes that are happening resulting from land use and land change (European Space Agency 2015). Besides, forests are a key component of the carbon cycle; as mentioned before, they absorb, store, but also release large amounts of Carbon to the atmosphere (idem).
It is also relevant to focus the role that technology plays. Geographic information systems (GIS) are prepared to model storage and CO2 emissions data Pedersen (2009); Sahzabi (2011); Bonijol (2009); satellite earth observations are unique instruments for monitoring and quantifying the planet status, acquiring spatiotemporal data. Two of the most relevant global strategic programs are the NASA Orbiting Carbon Observatory-2 that measures CO2 from the space (NASA. n.d.), and the Copernicus Climate Change Service
(C3S) and the Copernicus Atmosphere Monitoring Service (CAMS) (European Commission 2016b).
The world has never been so aware how decisive can be to study and modelling carbon dioxide trends and evaluate patterns to anticipate, adapt, and be resilient against those pragmatic impacts that climate change is bringing. To guide climate policies and understand carbon cycle more properly, it is necessary to precisely assess anthropogenic CO2 emissions and their distribution in
atmosphere and in terrestrial and ocean biosphere (Le Quéré 2015). Hence, this study aims to access to carbon storage and sequestration values in Continental Portugal, analysing the values for each district in 2007 and 2010, to produce an exploratory multi-temporal analysis, along with a prediction for the year 2020 based on land cover changes.
2 MATERIALS AND METHODS 2.1 Study area
At an administrate level, continental Portugal consists of 18 districts in which varied land use and land cover (LULC) types can be identified (Figure 1). In 2007, forests occupied major land space (42,9%), followed by agriculture (32,36%). Wetlands have no important territorial expression (0,29%) and water bodies use more space (20,51%) than artificial territories (3,93%). Considering the years 2007 and 2010, artificial (0,03 %) areas and water bodies (0,01 %) increased, and all other land use and land cover classes decreased in the total amount of occupied area. In fact, artificial territories are the only class in which the variation is higher than 0.01%. It is clear that the urban expansion is a stablished phenomenon – even if population is not growing - and forest land is being lost.
Figure 1 – Land use and land cover of continental Portuguese Districts (2007)
2.2 Data
We used the national land use land cover cartographic product (COS) for the reference year of 2007 and 2010. At the first step, it was necessary to apply a reclassification to the original land use classes to better explain the spatial distribution of the carbon sequestration
108
25
th
APDR Congress | ISBN 978-989-8780-06-5
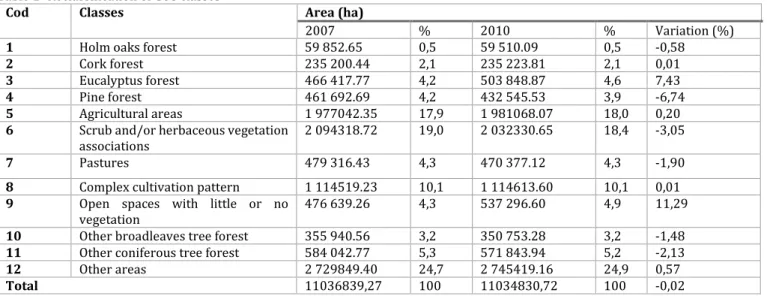
along the country. Instead of the 225 original classes represented in COS, we stablish and reduce them twelve classes that would allow us to preset the carbon sequestration values
We collected data from National Forest Inventory (ICNF), which reports carbon values for each forestation species. After extracting those values, we compiled our own database, recording the class of land use vegetation, the type of vegetation species, the region, and the carbon sequestration value. The main species were holm oak; eucalyptus; maritime pine; cork oak. Dominant eucalyptus from Dão Lafões region had the highest carbon values, however, the specie which stored more carbon was the pure (more than 75% of the forest cover). forests of maritime pine. In opposite and excluding other areas (such as grasslands or shrublands), dominated (forest species with less forest cover then other species) Pine tree in Beira Interior Norte, has the lowest value. Our methodologic decision for the reclassification was supported by the vision and knowledge about the territory and by the insensitive exploratory analysis of merging LCLU space classes together. The following table illustrates the applied reclassification (Table 1) to the new LCLU dataset created. Table 1- Reclassification of COS classes
Cod Classes Area (ha)
2007 % 2010 % Variation (%)
1 Holm oaks forest 59 852.65 0,5 59 510.09 0,5 -0,58
2 Cork forest 235 200.44 2,1 235 223.81 2,1 0,01
3 Eucalyptus forest 466 417.77 4,2 503 848.87 4,6 7,43
4 Pine forest 461 692.69 4,2 432 545.53 3,9 -6,74
5 Agricultural areas 1 977042.35 17,9 1 981068.07 18,0 0,20
6 Scrub and/or herbaceous vegetation
associations 2 094318.72 19,0 2 032330.65 18,4 -3,05
7 Pastures 479 316.43 4,3 470 377.12 4,3 -1,90
8 Complex cultivation pattern 1 114519.23 10,1 1 114613.60 10,1 0,01
9 Open spaces with little or no
vegetation 476 639.26 4,3 537 296.60 4,9 11,29
10 Other broadleaves tree forest 355 940.56 3,2 350 753.28 3,2 -1,48
11 Other coniferous tree forest 584 042.77 5,3 571 843.94 5,2 -2,13
12 Other areas 2 729849.40 24,7 2 745419.16 24,9 0,57
Total 11036839,27 100 11034830,72 100 -0,02
Each main forest species was individualized as their importance is unique. Other classes could be grouped in terms of their effects on carbon sequestration. As showed by the table above, some classes had few variations in terms of areas of the 3 years period. Nevertheless, classes represented with the code 3, 4 and 9 had their areas extended by 2010. In the opposite, classes 4,6,7,10 and 11 are less represented in COS 2010.
Tem de haver uma tabela onde se veja o valor de carbono atribuído a cada classe.
2.3 InVEST Model
InVEST is an open source software built to users map and value the natural capital. It maps ecosystem services and the quality of species as production functions of LCLU using simple biophysical models (Bhagabati et al 2014). It uses maps as inputs and – information sources- and outputs – cartographic product Sharp et al 2018). In this work, firstly we had applied carbon storage and sequestration model to map carbon density from our land use land cover raster datasets, where we have used just the pool “c_above”, meaning carbon density in aboveground mass. It aims to estimate the amount of CO2 stored in a landscape or sequestered over time,
setting values to each cell considering the carbon value of the represented class.
To create the story and to predict how future events can be shaped, we used the InVEST scenario generator, a simple method to create scenarios based on land suitability. A business as usual approach was adopted by extrapolating previous changes over a 10-year period to observe the impact of current land use and land cover policies on carbon capture.
Both models were applied for 2007 and 2010 and the main results for this project were obtain by the comparison of the variation between 2007 - 2010 and 2010 – 2020. The individual steps applied to model and create the scenario are illustrated in the following figure.
3 RESULTS AND DISCUSSION
Over the analysed period, the total variation in terms of carbon capture was slightly noticeable. The output of our model shows that just one district recorded positive variation of carbon capture for the period 2010 – 2020 (figure 3). Only three other districts had been somehow near to register a neutral or even positive variation. On the opposite, Aveiro district registered worst values and special attention needs to be applied there. Those results caused some surprise as they are unbalanced and adverse. Centre and littoral are areas where carbon capture have most significative negative variations. The range of variation values are not deviant but the fact that 17 on 18 districts shows negative variation should be highlighted.
The period – dependent from the LCLU cartography- was too short to account deeper analysis. The new Portuguese LCLU cartography recently produced would improve the timeliness. However, the nomenclature from COS 2015 is different from COS 2007 and the classes significantly reduced from 225 to 48, which would affect accuracy in terms of specie individualization. Would be also target from a deeper analysis if the scale would be at municipality level instead of district. The business as usual approach is simplistic as there are knowable bounds to the linear regulation and changes to land use. We recognize that this method fits when things are constant and when no big changes occurred but eventually this wouldn´t be the most suitable situation taking into account how land use might change rapidly. In the next step for this investigation, we recommend to access and introduce territorial policies in order to understand how they will change the carbon sequestration values. Creating scenarios based on Intergovernmental Panel on Climate Change (IPCC) theoretical and approaching scenarios draw by experts on the matter would be more effectively.
Figure 2 – Carbon capture Scenario – District percentual variation 2010 - 2020
4 CONCLUSION
In this study we promote a scenario modelling approach to access and understand land use and land cover territorial policies and their potential impacts on carbon capture situation by modelling carbon capture values in each continental district. The scenario generated shows that there is a linear variation which is decreasing in terms of carbon capture from the ground over time, meaning that the policies over the land do not meet environmental norms and requirements. Overall, the national tendency is to reduce carbon capture values, “ceteris paribus”. This situation is alarming and needs to be further reviewed as our scenario is classified as pessimist. GIS demonstrated to be an interesting and valuable tool due to their specific potential to quantify and map carbon values. From the limitations previously pointed out, this approach is merely indicative and needs to be progressed. Finally, our work meets EU Biodiversity Strategy 2020, which binds EU countries to assess and map ecosystem services (Rabe 2016). However, there is no commonly established approach to develop climate change scenarios, as the outcomes can diversely vary by the different observations, models, processes, intentions, user requirements or inputs (Lenderink 2014).
REFERENCES
Adeyemi, I., Abu-Zahra, M. R. M., & Alnashef, I. (2017). "Novel Green Solvents for CO2 Capture". Energy Procedia, 114 (November 2016), 2552–2560. https://doi.org/10.1016/j.egypro.2017.03.1413
Bhagabati, N. K., Ricketts, T., Sulistyawan, T. B. S., Conte, M., Ennaanay, D., Hadian, O., Wolny, S. (2014). “Ecosystem services reinforce Sumatran tiger conservation in land use plans”. Biological Conservation, 169, 147–156. doi:10.1016/j.biocon.2013.11.010
Caetano, M., Igreja, C., Marcelino, F., & Costa, H. (2017). "Estatísticas e dinâmicas territoriais multiescala de Portugal Continental 1995-2007-2010 com base na Carta de Uso e Ocupação do Solo ( COS )". Direcção-Geral Do Território (DGT), 149. Retrieved February 25, 2018, from http://mapas.dgterritorio.pt/atom-dgt/pdf-cous/COS2010/ET-COS-1995-2007-2010.pdf
European Commission (2016b). “Copernicus European Earth Observation and Monitoring Programme, COP22: Temperatures, Wildfires and CO2 – Copernicus Europe's Eyes on Earth Observes a Year of Extremes”. Atmosphere Monitoring Service
European Commission (n.d.), “Climate Action, Land use and forestry proposal for 2021-2030”, Retrieved February 20, 2018, from at https://ec.europa.eu/clima/lulucf_en
European Commission. (2018). "Proposal for a Regulation of the European Parliament and of the Council".
European Environment Agency (2016), “The Direct and Indirect Impacts of EU Policies on Land”, EEA Report 8/2016 European Space Agency (2015), “The Living Planet Programme”, Earth Explorers, Biomass
Houghton, Goodale, (2004) “Effects of Land-Use Change on the Carbon Balance of Terrestrial Ecosystems, in Ecosystems and Land Use Change”. Eds R. S. Defries, G. P. Asner and R. A. Houghton, American Geophysical Union, Washington, D. C. doi: 10.1029/153GM08
Ito (2017), “CO2 Emissions, Renewable and Non-Renewable Energy Consumption, and Economic Growth: Evidence from Panel Data for Developing Countries”, International Economics, 151, 1-6. doi.org/10.1016/j.inteco.2017.02.001
Karl, Trenberth (2003) “Modern Global Climate Change”, Science 05, 302, 1719-1723
Le Quére et. al (2015) “Global Carbon Budget”, Earth Syst. Sci. Data, 7, 349-396, https://doi.org/10.5194/essd-7-349-2015
Lenderink, et. al (2014), “Preparing Local Climate Change Scenarios for the Netherlands using Resampling of Climate Model Output”, Environmenal Research Letters. 9, 11
110
25
th
APDR Congress | ISBN 978-989-8780-06-5
Leung, Caramanna, Maroto-Valer (2014), “An Overview of Current Status of Carbon Dioxide Capture and Storage Technologies”, Renewable and Sustainable Energy Reviews, 39, 426-443. doi.org/10.1016/j.rser.2014.07.093
Ma, Tipping (1998), “The distribution of density matrices over potential-energy surfaces: Application to the calculation of the far-wing line shapes for CO2”, J. Chem. Phys. 108, 3386-3399. doi.org/10.1063/1.475774
Martin, Saikawa (2017), “Effectiveness of State Climate and Energy Policies in Reducing Power-Sector CO2 Emissions”, Nature Climate Change, 7, 912-919. doi:10.1038/s41558-017-0001-0
Moor F, Diaz (2015), “Temperature Impacts on Economic Growth Warrant Stringent Mitigation Policy”, Nature Climate Change. 5, 127-131. doi:10.1038/nclimate2481
NASA (2018), “Global Climate Change: Vital Signs of the Planet. Earth Science” Communications Team, NASA`s Jet Propulsion Laboratory, California Institute of Technology
NASA (n.d.) “Orbiting Carbon Observator-2 (OCO 2), Watching the Earth Breathe from Space. Measuring Carbon Dioxide from Space”, California Institute of Technology
Ni, Eskeland, Giske, Hansen, (2016) “The Global Potential for Carbon Capture and Storage from Forestry, Carbon Balance and Management”, 11, 3. doi: 10.1186/s13021-016-0044-y
Nienhuis, Palmer, Harley (2010), “Elevated CO2 affects shell dissolution rate but not calcification rate in a marine snail”, Proc. Biol. Science, 277 (1693): 2553-2558. doi: 10.1098/rspb.2010.0206
OECD, (2016), “Better Policies for 2030 - An OECD Action Plan on the Sustainable Development Goals” Retrieved February 19, 2018, from https://www.oecd.org/dac/Better%20Policies%20for%202030.pdf
Pedersen et. al (2009), “Assessing European Capacity for Geological Storage of Carbon Dioxide–the EU GeoCapacity Project”, Energy Procedia, 1, 2663-2670, doi.org/10.1016/j.egypro.2009.02.034
Rabe, Koellner, Marzelli, Schumacher, Regamey (2016), “National Ecosystem Services Mapping at Multiple Scales: The German Exemplar”, Ecological Indicators. 70, 357-372
Sahzabi, Sasaki, Djamaluddin, Yousefi, Sugai (2011), “GIS Modeling of CO2 Emission Sources and Storage Possibilities”, Energy Procedia, 2831-2838. doi.org/10.1016/j.egypro.2011.02.188
Sharp, R., Tallis, H.T., Ricketts, T., Guerry, A.D., Wood, S.A., Chaplin-Kramer, R., Nelson, E., Ennaanay, D., Wolny, S., Olwero, N., Vigerstol, K., Pennington, D., Mendoza, G., Aukema, J., Foster, J., Forrest, J., Cameron, D., Arkema, K., Lonsdorf, E., Kennedy, C., Verutes, G., Kim, C.K., Guannel, G., Papenfus, M., Toft, J., Marsik, M., Bernhardt, J., Griffin, R., Glowinski, K., Chaumont, N., Perelman, A., Lacayo, M. Mandle, L., Hamel, P., Vogl, A.L., Rogers, L., Bierbower, W., Denu, D., and Douglass, J. 2018. “InVEST 3.5.0.post358+he23ea3e79185 User’sGuide”. The Natural Capital Project, Stanford University, University of Minnesota, The Nature Conservancy, and World Wildlife Fund
Solomon, Plattner, Knutti, Friedlingstein, (2009), “Irreversible climate change due to carbon dioxide emissions”. Proceedings of the National Academy of Sciences of the United States of America, 106, 1704–1709, doi:10.1073/pnas.0812721106
United Nations (2015). “Transforming our world: the 2030 Agenda for Sustainable Development”. Resolution adopted by the General Assembly on 25 September 2015. Retrieved February 19, 2018, from http://www.un.org/ga/search/view_doc.asp?symbol=A/RES/70/1&Lang=E
United Nations (n.d.a), Climate Change, “Glossary of Climate Change Acronyms and Terms” Retrieved February 19, 2018, from at https://unfccc.int/process-and-meetings/the-convention/glossary-of-climate-change-acronyms-and-terms
United Nations (n.d.b), “Sustainable Development Goals, Climate Action: Why it Matters”, Retrieved February 19, 2018, from, https://www.un.org/sustainabledevelopment/wp-content/uploads/2016/08/13_Why_it_Matters_Climate_Action_letter_size_1p.pdf
Zoundi (2017), “CO2 Emissions, Renewable Energy and the Environmental Kuznets Curve, a Panel Cointegration Approach”. Renewable and Sustainable Energy Reviews, 72, 1067-1075, doi.org/10.1016/j.rser.2016.10.018