NEUROPHTHALMOLOGY
OCT in Alzheimer
’s disease: thinning of the RNFL and superior
hemiretina
João Paulo Cunha1,2,3&Rita Proença1&Arnaldo Dias-Santos1&Rita Almeida4&
Helena Águas4&Marta Alves5&Ana Luísa Papoila2,5,6&Carlota Louro2&
António Castanheira-Dinis7
Received: 7 February 2017 / Revised: 30 May 2017 / Accepted: 5 June 2017 / Published online: 22 June 2017 # Springer-Verlag GmbH Germany 2017
Abstract
Background Peripapillary retinal nerve fiber layer (pRNFL) and internal macular layer thinning have been demonstrated in Alzheimer’s disease (AD) with optical coherence tomography (OCT) studies. The purpose of this study is to compare the pRNFL thickness and overall retinal thickness (RT) in AD patients with non-AD patients, using spectral domain optical coherence tomography (SD-OCT) and determine the sectors most characteristically affected in AD.
Methods A cross-sectional study was performed to determine the pRNFL and overall macular RT thicknesses in AD and non-AD patients, attending a tertiary hospital center. For pRNFL, the global and six peripapillary quadrants were
cal-culated, and for overall RT values, the nine Early Treatment Diabetic Retinopathy Study (ETDRS) areas were used. A multiple regression analysis was applied to assess the effects of disease, age, gender, spherical equivalent, visual acuity, intraocular pressure, axial length and blood pressure on pRNFL and overall macular RT.
Results A total of 202 subjects, including 50 eyes of 50 pa-tients with mild AD (mean age 73.10; SD = 5.36 years) and 152 eyes of 152 patients without AD (mean age 71.03; SD = 4.62 years). After Bonferroni correction, the pRNFL was sig-nificantly thinner for the AD group globally and in the tem-poral superior quadrant (10.76μm and 20.09 μm mean de-crease, respectively). The RT thickness was also decreased in superior sectors S3 and S6 (mean thinning of 9.92μm and 11.65 μm, respectively). Spearman’s correlation coefficient showed a direct association between pRNFL in the temporal superior quadrant and RT in superior S6 and S3 sectors (rS= 0.41; p < 0.001 and rS= 0.28; p < 0.001, respectively). Conclusions Patients with AD showed a significant thickness reduction in global and temporal superior quadrants in pRNFL and in superior pericentral and peripheral sectors of RT. These findings may reflect a peripapillary and retinal changes charac-teristic of AD, suggesting the importance of SD-OCT as a po-tential adjuvant in early diagnosis of AD. Further studies are needed to understand which retinal layers and macular sectors are more useful as potential ocular biomarker over time in AD. Keywords Alzheimer’s disease . Spectral domain optical coherence tomography . RNFL . Retina . Macula
Introduction
Alzheimer’s disease (AD) is the most common form of de-mentia in elderly with great social impact [1]. Due to the
Electronic supplementary material The online version of this article (doi:10.1007/s00417-017-3715-9) contains supplementary material, which is available to authorized users.
* João Paulo Cunha cunha.oft@gmail.com
1
Department of Ophthalmology, Central Lisbon Hospital Center, Lisbon, Portugal
2
NOVA Medical School, Universidade NOVA de Lisboa, Lisbon, Portugal
3
Department of Neuro-Ophthalmology, Central Lisbon Hospital Center, 1169-050 Lisboa, Portugal
4 Department of Neurology, Central Lisbon Hospital Center, Lisbon, Portugal
5
Epidemiology and Statistics Unit, Research Centre, Central Lisbon Hospital Center, Lisbon, Portugal
6
CEAUL (Center of Statistics and Applications), Lisbon University, Lisbon, Portugal
7 Visual Sciences Study Center, Faculty of Medicine, Lisbon University, Lisbon, Portugal
increase in human life expectancy, the prevalence of AD is also expected to follow the same trend and, consequently, the need for early diagnosis emerges. The earliest AD pathologi-cal change in the central nervous system is the accumulation of amyloidβ, derived from the abnormal processing of amy-loid precursor protein [2]. This process can begin a decade before the onset of the clinical syndrome of dementia. Visual symptoms are also frequent among the earliest complaints in AD patients, contributing to further impairment in the quality of life [3,4].
Hinton et al. first provided histopathological evidence of optic neuropathy and degeneration of retinal ganglion cells (RGCs) in patients with AD, with reduced number of RGCs and reduced retinal nerve fiber layer (RNFL) thickness [5,6]. Later post-mortem studies showed that degeneration of the ganglion cell layer (GCL) occurs preferentially in superior and inferior quadrants, as well as in the central retina, in par-ticular, the temporal foveal region [7,8].
In vivo studies of optic neuropathy in patients with AD using fundus photographs showed RNFL and optic nerve head abnormalities (increased cup-to-disc ratio and decreased neuroretinal rim)[9–13], as well reduced macular thickness and volume [14–23].
The present study aimed to identify the quadrants in which peripapillary RNFL (pRNFL) and overall retinal thickness (RT) changes were more pronounced in patients with AD, using spectral domain optical coherence tomography (SD-OCT). This study also took into account potential confound-ing variables such as age, gender, spherical equivalent, best corrected visual acuity (BCVA), axial length, intraocular pres-sure (IOP), arterial blood prespres-sure, therapy with diuretics and antihypertensive medication.
Materials and Methods
Subject groupsT h i s c r o s s - s e c t i o n a l s t u d y w a s c o n d u c t e d a t t h e Ophthalmology and Neurology Departments of the Central Hospital Lisbon Center (CHLC), between October 2014 and April 2016. Consecutive AD patients sent by the Neurology Department for ophthalmological screening were observed for inclusion/exclusion criteria. Patients with clinical criteria for AD and mini-mental state examination (MMSE) scores be-tween 21 and 26 were selected for the AD group (ADG) and subjects without clinical criteria for dementia and MMSE scores greater than 26 were included in the control group (CG).
The inclusion criteria were AD patients between 65 and 78 years old with normotensive eyes, and ability to understand the study.
Exclusion criteria were refractive error > 5 diopters (D) or/ and axial length > 25 mm in the studied eye; known diagnosis of diabetes; retinal diseases; glaucoma or ocular hypertension; uveitis; neurodegenerative diseases and significant media opacities that precluded fundus imaging. Other relevant known neurologic pathology, such as neurodegenerative dis-eases, other types of dementia, previous stroke or uncertain or indeterminate diagnosis was excluded.
The study protocol was approved by the local ethical com-mittee, patient’s informed consent was obtained, and all the procedures were performed in accordance with the revised form of the Declaration of Helsinki (2008).
Fifty patients with mild AD (ADG) and 152 patients with-out AD (CG) were recruited from the Neurology Department of CHLC.
Study Procedures
After a pre-screening visit where demographic, background history, full ophthalmological examination with visual acuity, anterior segment examination, tonometry, indirect ophthal-moscopy and ultrasonic biometry were recorded, patients were assigned to a specific study visit where the following methodology was taken: Goldmann applanation tonometry and SD-OCT. Only the measurements of a randomly selected eye of each subject were used.
Visual Acuity
BCVA for each eye was measured using Snellen charts and converted to the logarithm of the minimum angle of resolution (logMAR).
Intraocular pressure
IOP was measured before pupillary dilation with Goldmann applanation tonometry and a mean of three measurements was considered.
Spectral Domain Optical Coherence Tomography Imaging
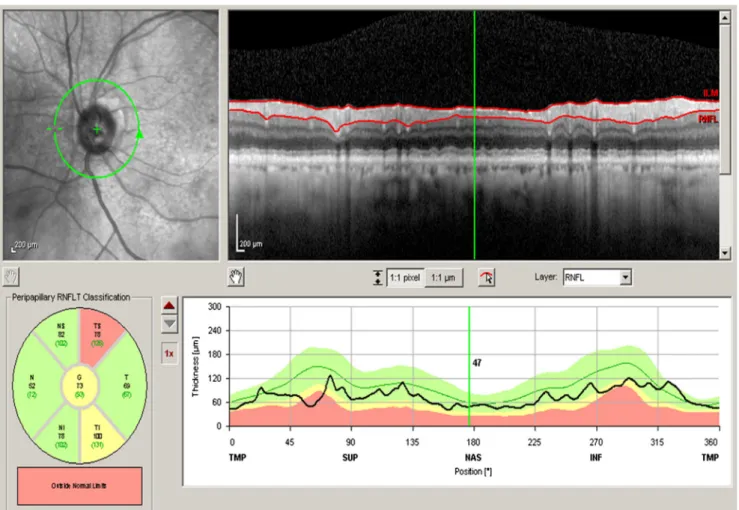
SD-OCT (Spectralis Heidelberg Engineering, Germany, soft-ware version 6.0) was used for both eyes of each patient and performed in the same visit for peripapillary and macular ob-servations. For pRNFL measurements, three consecutive scans were obtained using a circle size of 3.4 mm, at 2.6° nasal and 2.1° superior off center. The software allows the mapping of thicknesses for the seven peripapillary quadrants (G - global, TS - temporal superior, T - temporal, TI - temporal inferior, NI - nasal inferior, N - nasal, and NS - nasal superior) according to Fig.1.
For macular measurements, subjects were studied using the Bfast macular volume^ preset, consisting of a 25-line horizontal raster scan covering 20° × 20°, cen-tered on the fovea (consisting of 25 high-resolution scans). The overall RT values were calculated for the nine Early Treatment Diabetic Retinopathy Study (ETDRS) areas [24]. These ETDRS plots consist in three concentric rings of 1-, 3- and 6-mm diameter cen-tered at the fovea with the two outer rings subdivided into four quadrants. Each sector was designated accord-ing to Fig. 2, the fovea or central sector (C), the pericentral ring (ETDRS sectors: S3, T3, I3 and N3) and the peripheral ring (ETDRS sectors: S6, T6, I6 and N6).
The OCT images were obtained by one ophthalmologist and were assessed by two other ophthalmologists, masked to the patients’ diagnosis, who verified the automatic position of the ETDRS grid, correcting when necessary.
Systolic and diastolic blood pressure
Blood pressure was measured in the seated position by an automatic sphygmomanometer and systolic and diastolic
blood pressure (SBP and DBP) were recorded. Mean arterial pressure (MAP) was calculated using the following formula: MAP¼ DBP þ 1=3 SBP–DBPð Þ
Statistical analysis
An exploratory analysis was carried out for all variables. Categorical data were presented as frequencies (percentages), and continuous variables as mean and standard deviation (SD) or median and inter-quantile range (IQR: 25thpercentile– 75th percentile), as appropriate. Nonparametric chi-square tests and Mann–Whitney tests were applied.
Linear regression models were used to identify the vari-ables which may explain the variability of macular retinal and pRNFL thicknesses. The variables group, gender, age, IOP, axial length, spherical equivalent, MAP, BCVA, therapy with diuretics and antihypertensive medication, were consid-ered in this analysis. In the univariable regression analysis, all the variables with a p value < 0.25 were selected for the mul-tivariable models. Normality assumption of the residuals was verified using Kolmogorov–Smirnov goodness-of-fit test with Lilliefors correction.
To study the association between pRNFL quadrant thick-nesses and overall RT of each sector, Spearman’s correlation coefficient (rS) was used.
A level of significance ofα = 0.05 was considered. Data were analyzed using the Statistical Package for the Social Sciences for Windows (IBM Corp. released 2013. IBM SPSS Statistics for Windows, Version 22.0. Armonk, NY: IBM Corp.).
Results
Patient demographics and clinical characteristics
A total of 50 AD patients were included in the AD group and 152 patients without AD were included in the CG. Concerning gender, no significant differences were found between AD and CGs (male 32.0% vs. 36.2%; p = 0.591). The mean age was 73.1 (SD = 5.36) years in the AD group and 71.0 (SD = 4.62) years in the CG (p = 0.011).
The demographic, clinical and ophthalmologic characteris-tics of the two groups, including BCVA, IOP, spherical
equivalent, axial length, MAP, therapy with diuretics and an-tihypertensive medication, are summarized and compared in Table1.
OCT measurements of peripapillary retinal nerve fiber layer
In a univariable analysis, the difference in thickness reached statistical significance in all sectors with a thinning of the pRNFL in the AD group compared with the CG (Table 2). The remaining univariable regression models for pRNFL thickness are presented in Supplemental Tables1,2and3.
In the multivariable linear regression models, after adjusting for factors such as age, gender, visual acuity, IOP, spherical equivalent, axial length, MAP, diuretic and antihy-pertensive medication, we have observed a global thinning of the pRNFL for the AD group in five of the seven peripapillary quadrants, including the nasal quadrants (NI p = 0.004; N p = 0.004 and NS p = 0.004) and also G (p < 0.001) and TS (p < 0.001) quadrants (Table3). The mean decrease of pRNFL in the AD group when compared with the CG was between 6.927μm and 20.089 μm. For each 10 years of increase of life, the mean values of the TS quadrant also decreased
Fig. 2 Comparison of macular thickness (μm) between control group and Alzheimer’s disease (AD) group at nine sectors. Results are expressed as mean and standard deviation; p values were obtained by univariable linear regression models.
6.604μm (95% CI: -12.475 to -0.734) (Table 3). Systolic blood pressure also remained in the multivariable models for nasal quadrants (NI p = 0.002; N p = 0.005 and NS p = 0.048) and also G (p = 0.007), causing a mean thickening of the quadrants between 2.00 μm and 4.89 μm, for each 10 mmHg of increase. After Bonferroni correction, the quad-rants of pRNFL still statistically thinner for AD group were localized in the G and TS quadrants (10.755-μm and 20.089-μm mean decrease, respectively).
Retinal macular thickness
The results of the univariable analysis showed that the RT was thinner in the AD group in eight of the nine sectors, between 1 and 6 mm centered at the fovea (Figure 2). The remaining univariable regression models for RT are presented in Supplemental Tables4,5and6.
In the multivariable linear regression models for seven RT sectors (no multiple model was achieved for the N6 sector), we observed a mean thinning in the AD group between
6.820μm and 11.649 μm (p < 0.001 to 0.012). A mean thin-ning between 4.714μm and 7.237 μm for each 10 years of age increase (p = 0.003 to 0.046) was also observed in the multi-variable models for sectors T3, N3, S6, T6 and I6.
The results of the multivariable regression models after Bonferroni correction showed two sectors still thinner with statistical significance: the pericentral and peripheral superior sectors S3 and S6 (mean thinning of 9.916μm and 11.649 μm, with p = 0.001 and p < 0.001, respectively; Table4). Also, a mean thickening of 15.676μm at the C sector in the RT for male gender was observed (Table4).
Finally, Spearman’s correlation coefficient showed a direct association between pRNFL TS quadrant and RT S6 sector (rS = 0.41; p < 0.001), stronger than the correlation between pRNFL TS quadrant and RT S3 sector (rS= 0.28; p < 0.001).
Discussion
Regarding RNFL thinning in AD, it has been hypothesized that the neuroretinal atrophy may occur as a result of amyloid β plaque deposits within the retina [15] or as a result of retro-grade degeneration of the RGC axons [17], and these changes have been suggested to occur even before memory is affected [18].
Since Parisi et al., pRNFL thinning has been demonstrated with time domain OCT (TD-OCT); however, differences have been reported regarding which peripapillary quadrants are most affected using TD- and/or SD-OCT [15,17,18,25].
Whether or not a correlation exists between retinal changes and severity of dementia also remains a controversial issue. While most studies concluded that OCT could be used to detect early abnormalities in mild cognition impairment (MCI) and AD, the majority reported no statistically signifi-cant differences between MCI and AD patient groups [17,
26–29]. Only one TD-OCT study reported correlation
Table 1 Demographic and clinical characteristics of the patients by group
Alzheimer’s group (n = 50)
Control group (n = 152) p value
Age (years) 73.1 (5.36) 71.0 (4.62) 0.011 Male gender n (%) 16 (32.0) 55 (36.2) 0.591* BCVA (logMAR) 0.121 (0.153) 0.040 (0.073) <0.001 IOP - Goldmann (mmHg) 15.52 (2.62) 14.72 (2.51) 0.066 Spherical equivalent (D) 0.995 (1.43) 0.700 (1.64) 0.344 Axial length (mm) 22.44 (0.91) 22.49 (0.99) 0.668 Mean arterial pressure (mmHg) 98.91 (94.67–103.33) 97.87 (93.75–101.25) 0.287 Therapy with diuretics n (%) 14 (29.8) 26 (17.1) 0.058* Antihypertensive medication n (%) 32 (64.0) 60 (39.5) 0.003* Results are expressed as mean (SD) or median (IQR), as appropriate; best corrected visual acuity (BCVA); intra-ocular pressure (IOP). *Chi-square test; remaining p values were obtained by Mann–Whitney tests.
Table 2 Comparison of retinal nerve fiber layer (RFNL) at seven quad-rants by group
Quadrants Alzheimer’s group (n = 50) Control group (n = 152) p value Global 85.72 (14.42) 96.51 (9.36) <0.001 Temporal superior 108.20 (28.35) 129.59 (17.16) <0.001 Temporal 64.22 (13.01) 71.38 (12.66) 0.001 Temporal inferior 120.68 (23.69) 136.69 (20.06) <0.001 Nasal inferior 99.40 (25.95) 110.00 (22.22) 0.006 Nasal 68.76 (16.99) 74.77 (13.73) 0.012 Nasal superior 93.14 (29.08) 103.50 (17.45) 0.003 Results are expressed as mean (SD); p values were obtained by univariable linear regression models.
between MMSE scores and macular volume [14]. Also, meta-analyses tried to determine the utility of OCT as a tool for evaluating disease progression, and prognostic significance of macular and RNFL thickness, but their conclusions failed to determine a correlation between RNFL and the clinical severity of dementia [30–34] .
In addition, one study using SD-OCT showed a diffuse re-duction of the RNFL and ganglion cell layer combined in AD [21] although the authors were not able to determinate which layer was most affected by AD. Others studies have demon-strated inner plexiform layer thinning in AD patients [14,15,
21, 22, 35]. In a recent study analysing SD-OCT retinal markers, including RNFL thickness, GCL thickness did not show differences between AD patients age- and sex-matched controls or other neurodegenerative diseases, but the authors hypothesize that a larger sample would be necessary to delin-eate significant differences between the groups studied [36].
In this study, we used SD-OCT to compare pRNFL thick-ness and overall RT in mild AD patients with a large CG. In the multivariable analysis, after adjustment for age, gender, BCVA, IOP, axial length, spherical equivalent and MAP, the global and temporal quadrants of pRNFL, and superior pericentral and peripheral sectors of the overall retina were thinner. Spearman’s coefficient showed a stronger correlation between TS quadrant and S6 sector than between TS quadrant and S3 sector. Our study shows that the classically described macular asymmetry is confirmed only when we compare nasal sectors with temporal ones.
After Bonferroni correction, the thinning was most pro-nounced in the superiors sectors of RT (S3 and S6), with the classically described superior/inferior asymmetry disappearing. Our results are consistent with the visual field findings reported by Trick et al. [37] and histopathological findings of Armstrong [38]. They predominantly observed inferior visual field defects and greater density of senile plaques and neurofibrillary tangles in the cuneal gyrus than in the lingual gyrus in patients with AD. The precuneus was also described as particularly vulnerable for AD pathology, including cerebral atrophy and amyloid deposition [39]. The axons from the superior retina project via the parietal lobe portion of the optic radiation to the cuneal gyrus of the prima-ry visual cortex, and some authors found decreased longitudi-nal functiolongitudi-nal connectivity between the precuneus and other cerebral area networks in AD [40–42].
Our study had some limitations. The first one was the age distribution of the two study groups that was corrected by the linear regression models. Second, the automatic centration of the ETDRS grid could have resulted in imprecise measure-ments, but was confirmed by two independent ophthalmolo-gists. Thirdly, although all participants were recruited from the Neurology Department with clinical criteria and MMSE, no amyloid markers (cerebrospinal fluid or amyloid imaging) were used to increase the accuracy of the diagnosis. Fourthly, as not all patients performed visual fields, the exclu-sion of glaucomatous disease was based on IOP values and indirect ophthalmoscopy. Lastly, like all cross-sectional
Table 3 Results of multivariable regression models - dependent variable: RNFL thickness
Model Coefficient estimate p value 95% Confidence interval Dependent variable: RNFL thickness G
Alzheimer’s group* −10.755 <0.001 § −14.162 −7.349
Male gender −3.433 0.028 −6.485 −0.380
Systolic blood pressure 0.200 0.007 0.056 0.344
Dependent variable: RNFL thickness TS
Alzheimer’s group* −20.089 <0.001 § −26.710 −13.468
Age (years) −6.604 0.028 −12.475 −0.734
Dependent variable: RNFL thickness NI
Alzheimer’s group* −11.017 0.004 −18.398 −3.635
Male gender −7.393 0.029 −14.007 −0.778
Systolic blood pressure 0.489 0.002 0.177 0.801
Dependent variable: RNFL thickness N
Alzheimer’s group* −6.927 0.004 −11.643 −2.212
Age (years) 4.415 0.037 0.270 8.559
Systolic blood pressure 0.283 0.005 0.086 0.480
Dependent variable: RNFL thickness NS
Alzheimer’s group* −9.990 0.004 −16.774 −3.205
Systolic blood pressure 0.290 0.048 0.003 0.576
*Reference category: control group; age: for each increase of 10 years; p values were obtained by linear regression models. § with statistical significance after Bonferroni correction.
studies, it was not possible to draw conclusions about changes in pRNFL and RT in a single individual over time. As only the overall RT was considered, the atrophy of some retinal layers may only be compensated by others in an attempt to fill/ compensate the possible functional and/or structural conse-quences. In this sense, several studies showed that macular GC-IPL thinning may be a more sensitive marker of earlier neurodegeneration in MCI and AD than evaluation of the overall RT [26–29]. The next step is to understand which sectors of which layers can be earlier affected by AD and the possible confounding factors associated with the thinning of the layers.
Conclusion
Patients with AD showed a significant thickness reduction in global and temporal quadrants in the pRNFL and in the
superior sector of the macula. This thinning may reflect a peripapillary and retinal characteristic of AD, suggesting the importance of SD-OCT as a potential adjuvant in early diag-nosis of AD. Further studies are needed to understand which retinal layers and macular sectors are more useful as potential clinical ocular biomarkers for early detection of AD, and over time in disease progression.
Acknowledgements We would like to thank Bruno Oliveira-Santos for the helpful cooperation in collecting the OCT data. We thank Dr. Paula Mota and Dr. Joana Tavares-Ferreira for the detailed reading and com-ments on the manuscript.
Compliance with ethical standards
Funding No funding was received for this research.
Conflict of Interest All authors certify that they have no affiliationswith or involvement in any organization or entity with any financial interest (such as honoraria; educational grants; participation in Table 4 Results of multivariable regression models - dependent variable: RT thickness
Model Coefficient
estimate
p value 95% Confidence interval
Dependent variable: RT thickness C
Male gender 15.676 <0.001 § 9.359 21.992
Axial lenghtl 3.782 0.018 0.663 6.901
Dependent variable: RT thickness S3
Alzheimer’s group* −9.916 0.001 § −15.852 −3.980
Age (years) −6.522 0.015 −11.784 −1.259
Dependent variable: RT thickness T3
Alzheimer’s group* −6.820 0.012 −12.133 −1.508
Age (years) −7.237 0.003 −11.954 −2.520
Male gender 5.531 0.022 0.808 10.254
Spherical 1.478 0.042 0.055 2.902
Dependent variable: RT thickness I3
Alzheimer’s group* −8.231 0.005 −13.916 −2.546
Spherical 1.630 0.038 0.091 3.170
Dependent variable: RT thickness N3
Alzheimer’s group* −8.734 0.002 −14.161 −3.307
Age (years) −5.389 0.029 −10.211 −0.567
Spherical 1.456 0.050 0.001 2.910
Dependent variable: RT thickness S6
Alzheimer’s group* −11.649 <0.001 § −16.995 −6.304
Age (years) −6.126 0.012 −10.865 −1.387
Dependent variable: RT thickness T6
Alzheimer’s group* −7.955 0.002 −13.048 −2.861
Age (years) −4.714 0.041 −9.230 −0.198
Dependent variable: RT thickness I6
Alzheimer’s group* −8.692 0.002 −14.186 −3.197
Age (years) −4.953 0.046 −9.824 −0.082
*
Reference category: control group; age: for each increase of 10 years; p values were obtained by linear regression models. § with statistical significance after Bonferroni correction.
speakers’ bureaus; membership, employment, consultancies, stock own-ership, or other equity interest; and expert testimony or patent-licensing arrangements), or non-financial interest (such as personal or professional relationships, affiliations, knowledge or beliefs) in the subject matter or materials discussed in this manuscript.
Ethical approval All procedures performed in studies involving humanparticipants were in accordance with the ethical standards of the institutional and/or national research committee and with the 1964 Helsinki Declaration and its later amendments or comparable ethical standards.
Informed consent Informed consent was obtained from all individualparticipants included in the study.
Financial disclosure None of the authors have any conflict of interest.
References
1. Association A (2012) 2012 Alzheimer’ s disease facts and figures. Alzheimer’s Dementia 8:131–168. doi:10.1016/j.jalz.2012.02.001
2. Perl DP, Perl DP (2010) Neuropathology of Alzheimer’ s Disease Address Correspondence to : 32–42. doi:10.1002/MSJ
3. Burns A, Iliffe S (2009) Alzheimer’s disease. BMJ 338:b158. doi:
10.1136/bmj.b158
4. Querfurth HW, LaFerla FM (2010) Alzheimer’s disease. N Engl J Med 362:329–344. doi:10.1056/NEJMra0909142
5. Hinton DR, Sadun AA, Blanks JC, Miller CA (1986) Optic-nerve degeneration in Alzheimer’s disease. N Engl J Med 315:485–487. doi:10.1056/NEJM198608213150804
6. Hinton DR, Sadun AA, Blanks JC, Miller CA (2010) Optic nerve degeneration in Alzheimer’s disease. N Engl J Med 315:485–487 7. Blanks JC, Torigoe Y, Hinton DR, Blanks RHI (1996) Retinal
pa-thology in Alzheimer’s disease. I. Ganglion cell loss in foveal/ parafoveal retina. Neurobiol Aging 17:377–384. doi:10.1016/ 0197-4580(96)00010-3
8. Blanks JC, Hinton DR, Sadun AA, Miller CA (1989) Retinal gan-glion cell degeneration in Alzheimer’s disease. Brain Res 501:364– 372
9. Parisi V, Restuccia R, Fattapposta F, et al (2001) Morphological and functional retinal impairment in Alzheimer’s disease patients. 112: 1860–1867
10. Berisha F, Feke GT, Trempe CL, et al (2007) Retinal Abnormalities in Early Alzheimer’ s Disease. 48:6–10. doi:10.1167/iovs.06-1029
11. Hedges TR, Perez Galves R, Speigelman D et al (1996) Retinal nerve fiber layer abnormalities in Alzheimer’s disease. Acta Ophthalmol Scand 74:271–275
12. Tsai C, Ritch R, Schwartz B et al (1991) Optic nerve head and nerve fiber layer in Alzheimer’s disease. Arch Ophthalmol 109:199–204 13. Danesh-Meyer HV, Birch H, Ku JY et al (2006) Reduction of optic nerve fibers in patients with Alzheimer disease identified by laser imaging. Neurology 67:1852–1854
14. Iseri PK, Tokay T (2006) Relationship between Cognitive Impairment and Retinal Morphological and Visual Functional Abnormalities in Alzheimer Disease. 26:18–24
15. Kirbas S, Turkyilmaz K, Anlar O et al (2013) Retinal nerve fiber layer thickness in patients with Alzheimer disease. J N e u r o o p h t h a l m o l 3 3 : 5 8– 6 1 . d o i :1 0 . 1 0 9 7 / W N O . 0b013e318267fd5f
16. Salobrar-garcia E, Hoz R De, Rojas B, et al (2015) Findings in Mild Alzheimer’ s Disease. 2015:17–19. doi:10.1155/2015/736949
17. Ascaso FJ, Cruz N, Modrego PJ, Cristo A (2014) Retinal alterations in mild cognitive impairment and Alzheimer’ s disease : an optical
coherence tomography study. 1522–1530. doi: 10.1007/s00415-014-7374-z
18. Moschos M, Markopoulos I, Chatziralli I et al (2012) Structural and functional impairment of the retina and optic nerve in Alzheimer’s disease. Curr Alzheimer Res 9:782–788. doi:10.2174/ 156720512802455340
19. Gao L, Liu Y, Li X et al (2015) Abnormal retinal nerve fiber layer thickness and macula lutea in patients with mild cognitive impair-ment and Alzheimer’ s disease. Arch Gerontol Geriatr 60:162–167. doi:10.1016/j.archger.2014.10.011
20. Williams MA, Mcgowan AJ, Cardwell CR et al (2015) Retinal microvascular network attenuation in Alzheimer ’ s disease. Alzheimer’s Dement Diagnosis, Assess Dis Monit 1:229–235. doi:10.1016/j.dadm.2015.04.001
21. Marziani E, Pomati S, Ramolfo P, et al (2016) Evaluation of Retinal Nerve Fiber Layer and Ganglion Cell Layer Thickness in Alzheimer’ s Disease Using Spectral- Domain Optical Coherence Tomography. doi:10.1167/iovs.13-12046
22. Ong Y, Ong Y, Ikram MK, et al (2014) Potential Applications of Spectral-Domain Optical Coherence Tomography ( SD-OCT ) in the Study of Alzheimer’ s Disease. 23:74–83
23. Garcia-Martin ES, Rojas B, Ramirez AI et al (2014) Macular Thickness as a Potential Biomarker of Mild Alzheimer’s Disease. Ophthalmology 121:1149–1151.e3. doi:10.1016/j.ophtha.2013.12. 023
24. Group ETDRSR (1991) Early Photocoagulation for Diabetic Retinopathy. Ophthalmology 98:766–785. doi: 10.1016/S0161-6420(13)38011-7
25. Salobrar-Garcia E, Hoyas I, Leal M, et al (2015) Analysis of Retinal Peripapillary Segmentation in Early Alzheimer’ s Disease Patients. doi:10.1155/2015/636548
26. Ozdemir E, Eda O, Seda D (2015) The relationship between the degree of cognitive impairment and retinal nerve fiber layer thick-ness. Neurol Sci:1141–1146. doi:10.1007/s10072-014-2055-3
27. Bambo MP, Garcia-Martin E, Pinilla J et al (2014) Detection of retinal nerve fiber layer degeneration in patients with Alzheimer’s disease using optical coherence tomography: searching new bio-markers. Acta Ophthalmol 92:e581–e582. doi:10.1111/aos.12374
28. Paquet C, Roger F, Dighiero P, et al (2007) Abnormal retinal thick-ness in patients with mild cognitive impairment and Alzheimer’ s disease. 420:97–99. doi:10.1016/j.neulet.2007.02.090
29. Kesler A, Vakhapova V, Korczyn AD et al (2011) Retinal thickness in patients with mild cognitive impairment and Alzheimer’ s dis-ease. Clin Neurol Neurosurg 113:523–526. doi:10.1016/j.clineuro. 2011.02.014
30. Tzekov R, Mullan M (2014) Vision function abnormalities in Alzheimer disease. Surv Ophthalmol 59:414–433. doi:10.1016/j. survophthal.2013.10.002
31. Coppola G, Renzo A Di, Ziccardi L, Martelli F (2015) Optical Coherence Tomography in Alzheimer ’ s Disease : A Meta-Analysis. 1–14. doi: 10.1371/journal.pone.0134750
32. Cunha JP, Moura-Coelho N, Proença RP, et al (2016) Alzheimer’s disease: A review of its visual system neuropathology. Optical co-herence tomography—a potential role as a study tool in vivo. Graefe’s Arch Clin Exp Ophthalmol. doi: 10.1007/s00417-016-3430-y
33. Thomson KL, Yeo JM, Waddell B et al (2015) A systematic review and meta-analysis of retinal nerve fiber layer change in dementia, using optical coherence tomography. Alzheimer’s Dement Diagnosis, Assess Dis Monit 1:136–143. doi:10.1016/j.dadm. 2015.03.001
34. He X-F, Liu Y-T, Peng C et al (2012) Optical coherence tomogra-phy assessed retinal nerve fiber layer thickness in patients with Alzheimer’s disease: A meta-analysis. Int J Ophthalmol 5:401– 405. doi:10.3980/j.issn.2222-3959.2012.03.30
35. Cheung CY, Ting Y, Ikram MK et al (2014) Microvascular network alterations in the retina of patients with Alzheimer ’ s disease. Alzheimer’s Dement 10:135–142. doi:10.1016/j. jalz.2013.06.009
36. Pillai JA, Bermel R, Bonner-Jackson A, et al (2016) Retinal Nerve Fiber Layer Thinning in Alzheimer’s Disease: A Case-Control Study in Comparison to Normal Aging, Parkinson’s Disease, and Non-Alzheimer’s Dementia. Am J Alzheimers Dis Other Demen. doi:10.1177/1533317515628053
37. Trick GL, Trick LR, Morris P, Wolf M (1995) Visual field loss in senile dementia of the Alzheimer’s type. Neurol 45:68–74. doi:10. 1212/WNL.45.1.68
38. Armstrong RA (1996) Visual field defects in Alzheimer’s disease patients may reflect differential pathology in the primary visual cortex. Optom Vis Sci 73:677–682
39. Jack CR, Knopman DS, Jagust WJ et al (2010) Hypothetical model of dynamic biomarkers of the Alzheimer’s pathological cascade. Lancet Neurol 9:119–128. doi:10.1016/S1474-4422(09)70299-6
40. Damoiseaux JS, Prater KE, Miller BL, Greicius MD (2012) Functional connectivity tracks clinical deterioration in Alzheimer’ s disease. NBA 33:828.e19–828.e30. doi:10.1016/j.neurobiolaging. 2011.06.024
41. Hafkemeijer A, Möller C, Dopper EGP, Jiskoot LC (2015) Resting state functional connectivity differences between behavioral variant frontotemporal dementia and Alzheimer’ s disease. 9:1–12. doi:10. 3389/fnhum.2015.00474
42. Hafkemeijer A, Christiane M (2017) A Longitudinal Study on Resting State Functional Connectivity in Behavioral Variant Frontotemporal Dementia and Alzheimer ’ s Disease. 55:521– 537. doi:10.3233/JAD-150695