ABSTRACT: Water scarcity and soil salinization affect large semiarid agricultural areas through-out the world. The maintenance of agricultural productivity implies better agricultural practices and a careful selection of resistant crops. A proper monitoring of the physiological status of plants can lead to better knowledge of plant nutritional requirements. Visible and near-infrared (VNIR) radiometry provides a non-destructive and quantitative method to monitor vegetation sta-tus by quantifying chemical properties using spectroscopic techniques. In this study, the capabil-ity of VNIR spectral measurements to detect salincapabil-ity effects on melon (Cucumis melo L.) plants was tested. Melon plants were cultivated under multiple soil salinity conditions (electrical conduc-tivity, (EC)1:5: 0.5, 1.0 and 2.5 dS m
–1). Spectral data of leaves were transformed into vegetation
indices indicative of the physiological status of the plants. The results showed differences for N (p < 0.05), K and Na content (p < 0.01) due to salinity suggesting different degrees of salt stress on the plants. Specific leaf area increased with salinity levels (p < 0.001). The capabilities of VNIR radiometry to assess the influence of soil salinity on melon physiology using a non-destructive method were demonstrated. A normalized difference vegetation index (NDVI750-705), and the ratio
between water index (WI) and normalized difference vegetation index (WI/NDVI750-705) showed
significant relationships (p < 0.01) with the salinity. Therefore, this method could be used for in-situ early detection of salinity stress effects.
Keywords: VNIR radiometry, Cucumis melo L., saline soil
Introduction
Mediterranean ecosystems are characterized by the aridity of the climate and the persistent scarcity of water resources. Agriculture with high water require-ments under increased occurrence of extreme drought events have forced irrigation with poor quality water from both irrigation drainage and groundwater sources, causing processes of degradation, reduction of the pro-duction capacity, and soil salinization (Pérez-Sirvent et al., 2003; Ashraf et al., 2007).
Salt stress is the most widespread abiotic stress that limits plant growth, physiology and productivity mainly affecting the ionic balance and plant water rela-tions (Dogan et al., 2010). Salinity disturbs the miner-al-nutrient relations in plants through their effects on nutrient availability, transport, and partitioning (Botía et al., 1998; Kaya et al., 2007; Cochard et al., 2010). Chlorophyll biosynthesis and nitrogen metabolism are also found to be affected due to high salinity (Ashraf, 2004). However, the effects of soil salinity depend on the plants' level of tolerance and the salinity level, since there are differences between species in terms of abil-ity to maintain nutrient concentrations for growth under salt stress (Munns et al., 2002; Melgar et al., 2008).
Leaf traits play an important role in plant response to stress conditions (Hernández et. al, 2010, 2011; Tede-schi et al., 2011). Leaf pigment content is related to the physiological function of leaves, and provides valuable information about plant status. It has been suggested as one of the important indicators of salt tolerance in crop plants (Kaya et al., 2007). Traditional methods of pig-ment analysis through extraction with organic solvents
and spectrophotometric determination in the obtained solution require destruction of the leaves measured. Re-cently, alternative optical methods have been developed for determining leaf pigment.
Spectral reflectance analysis is a fast nondestruc-tive method, and allows for measurement of changes in the response over time for a single leaf. A number of vegetation indices have been developed using leaf reflec-tance spectrum. Some of these indices are first deriva-tives from the spectrum, such as reflectance simple ratio vegetation index (SR), normalized difference vegetation index (NDVI), stress index (SI), and water index (WI) (Gao and Li, 2012).
This study aimed to assess the visible and near-infrared (VNIR) radiometry to determine the influence of soil salinity stress on melon (Cucumis melo L.). Reflec-tance indices and leaf parameters in response to soil sa-linity were compared for early the detection of possible nutritional effects on the plants.
Materials and Methods
Plants were grown in an experimental field at Car-rizales, located in the municipality of Elche (Alicante) (38°9’ N, 0°43’ W), in the southeast of Spain from early Apr to end of Jul 2011. Carrizales is an agricultural area situated in the middle of two RAMSAR wetland sites (“Las Salinas de Santa Pola” Natural Park of “El Hondo” of Crevillente-Elche Natural Park) (Figure 1). The cli-mate is arid to semiarid Mediterranean with an average annual rainfall of 250-300 mm and a thermal regime of warm temperatures with an average annual tempera-ture of 19 °C. All through the experiment, rainfall was
Received October 11, 2013 Accepted January 15, 2014
University Miguel Hernández – Dept. of Agrochemistry and Environment, Av. de la Universidad s/n, E-03202 – Elche, Alicante – Spain.
*Corresponding author <[email protected]>
Edited by: Leônidas Carrijo Azevedo Melo
Spectral indices for the detection of salinity effects in melon plants
36 mm and evapotranspiration obtained in accordance with the Penman-Monteith formula (Monteith, 1973) was 608 mm.
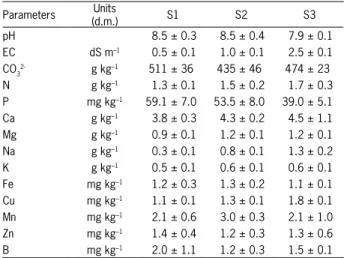
The soils in this experiment are classified as Cal-caric Fluvisols (IUSS, 2006). The main characteristics of the soils (Table 1) were: texture based on the Bouy-oucos method (Gee and Bauder, 1986); pH and electri-cal conductivity (EC) in deionized water 1:2.5 and 1:5 w/v, respectively; N-Kjeldahl (Bremmer and Mulvaney, 1982); exchangeable phosphorus (P) by the Burriel-Hernando method (Díez, 1982); exchangeable Ca, Mg, K and Na in ammonium acetate extraction 1N and Fe, Mn, Cu and Zn using Lindsay and Norwell extraction (Lindsay and Norwell, 1978), and measured by AAS-ES. Available boron (B) was measured in water extrac-tion. These soils have a clay loam-texture, moderately basic pH and large content of carbonates. Soil nutrient composition was similar to a previous study by Pérez-Sirvent et al. (2003).
Irrigation water came from a drainage water channel, which is the source for the traditional irriga-tion system. The experimental plots were equally flood irrigated to field capacity (every 15 days). Water qual-ity was analyzed five times throughout the experiment and parameters were determined in accordance with the Standard Methods for the Examination of Water and Wastewater (APHA, 1989). Table 2 shows the main characteristics of the irrigation water (pH about 7.7 and high EC).
The plots in the study were selected on the basis of initial soil salinity (S1 = 0.5±0.1, S2 = 1.0±0.1 and S3 = 2.5±0.1 dS m–1). Each soil salinity level included
two replicated plots. Melon plants (cultivar “piel de sapo”) were grown in these field conditions and they were planted every 0.5 m, and the separation between crop lines was 1.5 m. Standard organic fertilization (20 t ha–1) and inorganic fertilization (90 kg ha–1 N, 100 kg
ha–1 P and 180 kg ha–1 K) for melon were applied at the
beginning of the experiment.
Twenty randomly selected plants per plot were chosen at the flowering stage (60 days after transplant-ing). Two fully mature leaves were taken from each plant for the measurements (40 leaves per plot). The col-lected leaves were immediately enclosed in plastic bags with wet filter paper and transported to the laboratory for further analyses. In the laboratory, leaf blades and petioles were separated. Five leaves were selected for spectral and pigment measurements from each experi-mental plot.
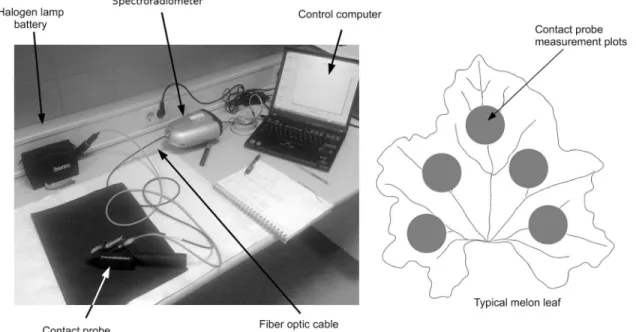
A FieldSpec HandHeld spectroradiometer (ASD Inc., Boulder CO, USA) was used to gather spectral data from melon leaf blades (Figure 2). The device records spectral reflectance measurements in the visible and near infrared (325 to 1075 nm). Reflectance
measure-Table 1 – Soil characteristics of the experimental site under differing salinity conditions (S1=0.5, S2=1.0 and S3=2.5 dS m–1). Data are the means ± standard deviation calculated on three replication basis.
Parameters (d.m.)Units S1 S2 S3
pH 8.5 ± 0.3 8.5 ± 0.4 7.9 ± 0.1
EC dS m–1 0.5 ± 0.1 1.0 ± 0.1 2.5 ± 0.1
CO3
2- g kg–1 511 ± 36 435 ± 46 474 ± 23
N g kg–1 1.3 ± 0.1 1.5 ± 0.2 1.7 ± 0.3
P mg kg–1 59.1 ± 7.0 53.5 ± 8.0 39.0 ± 5.1
Ca g kg–1 3.8 ± 0.3 4.3 ± 0.2 4.5 ± 1.1
Mg g kg–1 0.9 ± 0.1 1.2 ± 0.1 1.2 ± 0.1
Na g kg–1 0.3 ± 0.1 0.8 ± 0.1 1.3 ± 0.2
K g kg–1 0.5 ± 0.1 0.6 ± 0.1 0.6 ± 0.1
Fe mg kg–1 1.2 ± 0.3 1.3 ± 0.2 1.1 ± 0.1
Cu mg kg–1 1.1 ± 0.1 1.3 ± 0.1 1.8 ± 0.1
Mn mg kg–1 2.1 ± 0.6 3.0 ± 0.3 2.1 ± 1.0
Zn mg kg–1 1.4 ± 0.4 1.2 ± 0.3 1.3 ± 0.6
B mg kg–1 2.0 ± 1.1 1.2 ± 0.3 1.5 ± 0.1
Figure 1 – Location map of Carrizales study area and surrounding Natural Parks.
Table 2 – Irrigation water characteristics: average, standard deviation, maximum and minimum.
Parameters Units Average Standard deviation Maximum Minimum
pH 7.7 0.1 7.9 7.6
EC dS m–1 4.1 0.9 5.3 2.4
HCO3 mg L–1 526.8 18.1 559.5 506.1
NO3
- mg L–1 17.6 8.4 30.7 10.0
P mg L–1 5.4 0.7 6.4 4.6
NH4
+ mg L–1 0.7 0.1 0.9 0.5
Ca mg L–1 189.9 10.5 206.0 179.9
Mg mg L–1 146.4 32.8 176.9 85.0
Na mg L–1 825.0 77.1 930.8 720.9
K mg L–1 12.4 0.9 14.2 11.6
Cl mg L–1 1318.7 246.1 1645.4 1032.4
ments were obtained after calibrating the device with a 99 % reflectance white reference panel (Labsphere, North Sutton NH, USA). A High Intensity Contact Probe was employed to minimize measurement errors associ-ated with stray light. This accessory has a halogen bulb and a fiber optic cable connected to the spectroradiom-eter. The contact probe is placed on the sample that is illuminated and the reflectance radiation is conducted by the fiber optic to the spectroradiometer.
Melon leaf blades were placed over a stack of black cardboards with reflectance near to zero in order to avoid interaction of the background materials. The contact probe was placed at five points on each melon leaf (Figure 2). Spectral measurements were made at each of the five measured points, and then the five spec-tra were used to obtain an average spectrum per leaf. Due to some noise at the ends of the recorded spectra, only the data gathered between the 375 nm and 1025 nm were used. Melon leaf reflectance spectra were em-ployed to compute selected spectral indices (Table 3).
Pigment contents were determined in 80 % ac-etone extract. Total chlorophyll (Total Chl) as well as chlorophyll a (Chl-a), chlorophyll b (Chl-b), and carot-enoid (Car) concentrations were calculated according to Lichtenthaler (1987). The Car/Chl-a ratio was also de-termined.
Specific leaf area (SLA; leaf area per leaf biomass) was calculated as described by Jones (1971). Previously, leaf area had been measured using image analysis soft-ware. Nutrients were analyzed in leaf samples that were pre-heated in an oven at 65 °C for at least 48 h to con-stant weight (dry matter, d.m.) and the moisture content
determined (%). Leaves were grounded and nitrogen was determined using the Kjeldahl method (Bremmer, 1965). After that, leaf samples were mineralized by dry ashing at 450 ºC for five hours and redissolved in HCl 1:1. After that, K and Na were determined by induc-tively coupled plasma mass spectrometry (ICP-MS; VG PQ Excell, Thermo Elemental, Winsford, UK).
Statistical analysis was carried out using the SPSS v.20 (IBM Corp., Armonk, NY, USA) software. Normal distribution of the variables was assessed by the Kol-mogorov-Smirnov test. Data were subjected to one-way
Figure 2 – Melon leaves spectral measurement system.
Table 3 – Spectral indices selected for the assessment of plant status.
Indices Formulation References
NDVI750-705
750 705
750 705
nm nm
nm nm NDVI r r
r r
− =
+
Gitelson and Merzlyak, 1998
NDVI800-680
800 680 800 680
nm nm nm nm
NDVI r r
r r
− =
+ Peñuelas et al., 1997b
CRI550 CRI550=(r510 550 nm)−1−(r nm)−1 Gitelson et al., 2002
SIPI 800 445
800 445
nm nm
nm nm SIPI r r
r r
− =
+ Peñuelas et al., 1995
WI 900
970
nm nm
WI r r
= Peñuelas et al., 1997b
WI/NDVI corrected WI WI
NDVI
= Peñuelas et al., 1997b
analysis of variance (ANOVA) test to find the differences in the parameters analyzed and spectral indices due to soil salinity levels. Means were compared using Dun-can’s Multiple Range test (p < 0.05). Relationships be-tween spectral indices and the parameters measured in the leaf blades were calculated using Pearson Correla-tion Coefficients.
Results and Discussion
The spectra obtained from melon leaves showed changes when salinity treatments were applied, al-though the plants did not manifest visual symptoms (Figure 3). An increment in the soil salinity generally tends to induce a decrease in leaf reflectance in the near infrared spectral region (Leone et al., 2007; Peñuelas et al., 1997b), but an increase in near infrared reflectance with salinity was observed in this study. Previous stud-ies reported the same pattern found in the near infra-red reflectance when salt-tolerant species were irrigated with moderately saline water (Poss et al., 2006, Tilley et al., 2007). Similarly, Zhang et al. (2011) observed a rise in near infrared reflectance for salt-tolerant species grow-ing on moderately saline soils in a wetland environment.
Higher near infrared reflectance values are asso-ciated with proper development of the plants (Jensen, 1983). The general pattern of near infrared reflectance reduction results was adequate for describing the ef-fect of salt stress on salt-sensitive species, but not good enough for salt-tolerant species that grow better on moderately saline soils than on non-saline and highly saline soils (Läuchli, 2002; Zhang et al., 2011). Another spectral change associated with higher salinity condi-tions that was observed was the narrowing of the red absorption band and a shift of the red edge to shorter wavelengths (Horler et al., 1983; Peñuelas et al., 1994).
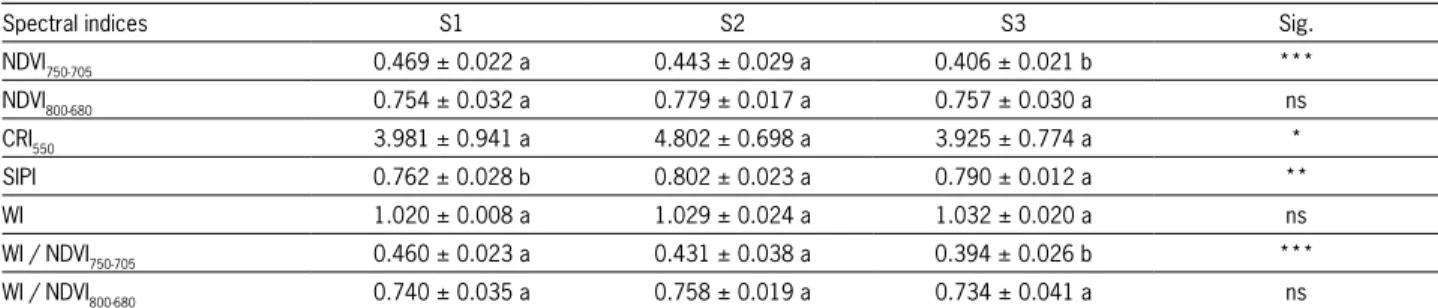
The salinity effects on the spectral indices were different depending on the index selected (Table 4). Dif-ferences (p < 0.001) were obtained for the NDVI750-705, values decreasing as soil salinity increased; but differ-ences found for the NDVI800-680 were insignificant.
Spec-tral index values were much higher for the NDVI800-680
(about 0.7) than for the NDVI750-705 (about 0.4),
sug-gesting that the NDVI800-680 had a tendency to saturate. NDVI800-680 employs a wider range of spectral bands far from the red edge position. The employment of the NDVI800-680 is well justified because it is highly cor-related with the NDVI as calculated from broadband satellite sensors (Peñuelas et al., 1997a). NDVI spectral indices, from broadband satellite sensors, play a very important role in monitoring large areas, but with less spectral resolution than field radiometers or hyperspec-tral remote sensors. The NDVI750-705 exploits the sensi-tivity of the red edge. Leaf reflectance at 700 nm is related to chlorophyll concentration and reflectance at 750 nm virtually does not depend on chlorophyll con-centration, thus allowing for formulation of the index (Gitelson and Merzlyak, 1998).
The water related indices used in this study
pro-vided insightful information. The WI/NDVI750-705 ratio
showed changes in soil salinity levels (Table 4). Differ-ences (p < 0.001) in this ratio were observed values decreasing as soil salinity increased, and may therefore become a useful tool in the evaluation of the effects of salinity.
The leaf blade analyses supplied a physiological basis to explain the behavior of spectral indices.
Nitro-Table 4 – Descriptive statistics (mean ± s.d) and ANOVA results for spectral indices of melon leaves under different soil salinity conditions (S1=0.5, S2=1.0 and S3=2.5 dS m–1). Duncan’s test on homogeneous subgroups are denoted with letters.
Spectral indices S1 S2 S3 Sig.
NDVI750-705 0.469 ± 0.022 a 0.443 ± 0.029 a 0.406 ± 0.021 b ***
NDVI800-680 0.754 ± 0.032 a 0.779 ± 0.017 a 0.757 ± 0.030 a ns
CRI550 3.981 ± 0.941 a 4.802 ± 0.698 a 3.925 ± 0.774 a *
SIPI 0.762 ± 0.028 b 0.802 ± 0.023 a 0.790 ± 0.012 a **
WI 1.020 ± 0.008 a 1.029 ± 0.024 a 1.032 ± 0.020 a ns
WI / NDVI750-705 0.460 ± 0.023 a 0.431 ± 0.038 a 0.394 ± 0.026 b ***
WI / NDVI800-680 0.740 ± 0.035 a 0.758 ± 0.019 a 0.734 ± 0.041 a ns
Significance levels: [ns] not significant; [*] < 0.05; [**] < 0.01; [***] < 0.001. NDVI: Normalized Difference Vegetation Index; CRI: Carotenoid Reflectance Index; SIPI: Structure Intensive Pigment Index; WI: Water Index.
Figure 3 – Leaf spectra of melon plants grown at three different soil salinity levels (S1 = 0.5 dS m–1; S2 = 1 dS m–1; S3 =
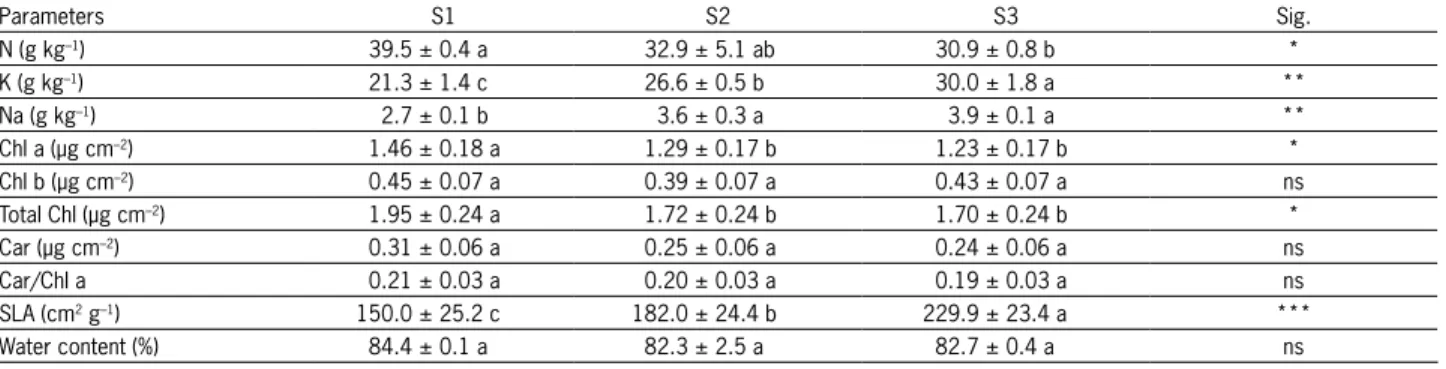
gen content decreased (p < 0.05) in leaves in response to soil salinity (Table 5). Salt stress affected N nutri-tion in plants and in this sense, Carvajal et al. (1998) suggested that once the older leaves start to die due to long-term exposure to salt, melon plants can no longer support continued growth. A positive correla-tion between NDVI750-705 and N (r = 0.742, p < 0.01) was found. The salt stress effect on N nutrition was endorsed by the leaf spectral measurements. N-limited leaves are proper to a red-edge shift to shorter wave-lengths (Peñuelas et al., 1994). The red-edge position of high salinity melon plant was clearly shifted to shorter wavelengths.
Soil salinity favored the increment of K and Na (p < 0.01) and SLA (p < 0.001) in leaves. Salt-tolerant cultivars have a mechanism to select high K contents under salt stress, since maintenance of adequate lev-els of K is essential for plant survival in saline habitats (Grattan and Grieve, 1999). In this sense, K is related to osmotic adjustment in many species because it is one of the primary osmotic solutes (Iannucci et al., 2002). Furthermore, K is also associated with stomatal regula-tion, which is a principal mechanism that controls water balance in plants (Tuna et al., 2010).
Specific leaf area (SLA) increased from 150.0 to 229.9 cm2 g–1 in response to salinity, which indicates
the formation of thinner leaves and a higher area per unit of dry weight. Tedeschi et al. (2011) observed simi-lar results in SLA with salinity treatment on the melon cultivar ‘Tendral’. These results suggest a reduction in the activity of the leaves under higher saline condi-tions.
Differences (p < 0.05) were obtained for Chl-a and total chlorophylls, values decreasing when soil sa-linity content increases, but no differences in the Chl-b
content were found. Previous studies also reported that Chl-b was less sensitive to salt stress than Chl-a (Nau-mann et al., 2008; Qin et al., 2010). However, no cor-relation was found between chlorophylls and the NDVI indices used in this work thus indicating that levels of chlorophyll were not the only parameter affecting NDVI indices.
Although differences (p < 0.05) between the
carotenoid related indices, CRI550 and SIPI (p < 0.05 and p < 0.01, respectively), were observed for the
sa-line treatments, CRI550 and SIPI did not show a clear
tendency related to soil salinity (Table 4). Carotenoid content and the Car/Chl-a ratio were not affected (p > 0.05) by soil salinity in field conditions (Table 5). Simi-lar results were observed for two co-occurring shrubs by Zinnert et al. (2012). The Car/Chl-a ratio generally increases in senescing and unhealthy plant conditions (Peñuelas et al., 1995) so salinity tolerance of melon plants may be associated with this response. CRI550 ex-hibits a direct linear correlation with carotenoid con-tent (Gitelson et al., 2002), but the carotenoid concon-tent values are quite low and could affect the robustness of the relationship. The relationship between Car/Chl-a
and SIPI is not linear and SIPI has low sensitivity to the
low Car/Chl-a values obtained (Peñuelas et al., 1994).
Thus, both indices had poor correlation with the carot-enoid content (Table 6).
Leaf water content did not show differences be-tween individual salinity levels, although a reduction from S1 to S3 was observed. Also differences were
not found for the WI and WI/NDVI800-680 in response
to higher soil salinity levels. In this sense, Sohan et al. (1999) reported that the plants grown under salt stress have to maintain a favorable water status to en-sure water loss is minimal. Thus, plants withstand salt stress through osmotic adjustment by maintaining cell water content (Kramer and Boyer, 1995). This could be the reason for the insightful information provided by the water relation indices used in this study. WI val-ues of the leaves were consistent with previous stud-ies (Peñuelas et al., 1997a) and a light decrease in leaf water content due to salinity was observed. Indeed, correlations between WI and plant water content have more robustness under controlled experimental condi-tions than in field experiments (Peñuelas et al., 1997a). Greater differences between treatments may be ex-pected but the plants were frequently flood irrigated to avoid water deficit and maximize yield under field conditions.
Table 5 – Descriptive statistics (mean ± s.d) and ANOVA results for nutrients and pigments in leaf blades of melon under different soil salinity conditions (S1=0.5, S2=1.0 and S3=2.5 dS m–1). Duncan’s test on homogeneous subgroups are denoted with letters.
Parameters S1 S2 S3 Sig.
N (g kg–1) 39.5 ± 0.4 a 32.9 ± 5.1 ab 30.9 ± 0.8 b *
K (g kg–1) 21.3 ± 1.4 c 26.6 ± 0.5 b 30.0 ± 1.8 a **
Na (g kg–1) 2.7 ± 0.1 b 3.6 ± 0.3 a 3.9 ± 0.1 a **
Chl a (µg cm–2) 1.46 ± 0.18 a 1.29 ± 0.17 b 1.23 ± 0.17 b *
Chl b (µg cm–2) 0.45 ± 0.07 a 0.39 ± 0.07 a 0.43 ± 0.07 a ns
Total Chl (µg cm–2) 1.95 ± 0.24 a 1.72 ± 0.24 b 1.70 ± 0.24 b *
Car (µg cm–2) 0.31 ± 0.06 a 0.25 ± 0.06 a 0.24 ± 0.06 a ns
Car/Chl a 0.21 ± 0.03 a 0.20 ± 0.03 a 0.19 ± 0.03 a ns
SLA (cm2 g–1) 150.0 ± 25.2 c 182.0 ± 24.4 b 229.9 ± 23.4 a ***
Water content (%) 84.4 ± 0.1 a 82.3 ± 2.5 a 82.7 ± 0.4 a ns
Conclusions
An early knowledge base to apply radiomet-ric techniques to field diagnosis could be used for the early detection of salinity effects in plants, before they manifested visual damage and also irreversible injury. NDVI750-705 and WI/NDVI750-705 indices showed significant relations with the salinity and were the most effective spectral indices for discriminating the effects of soil sa-linity on melon plants. Thus, NDVI750-705 and WI/NDVI
750-705 may be used for detecting early signs of increasing
salinity exposure in crops like the melon, and VNIR ra-diometry could be an interesting tool to check plant re-sponses whilst avoiding possible damage due to salinity that can lead to irreversible injury.
Acknowledgements
The authors acknowledge the financial support provided by Obras Agrícolas Carrizales S.L.
References
American Public Health Association [APHA]. 1989. Standard Methods for the Examination of Water and Wastewater. 17ed. American Public Health Association, Washington, DC, USA.
Ashraf, M. 2004. Some important physiological selection criteria for salt tolerance in plants. Flora 199: 361-376.
Ashraf, M.; Foolad, M.R. 2007. Roles of glycine betaine and proline in improving plant abiotic stress resistance. Environmental Experimental Botany 59: 206-216.
Botía, P.; Carvajal, M.; Cerdá, A.; Martínez, V. 1998. Response of eight Cucumismelo cultivars to salinity during germination and early vegetative growth. Agronomie 18: 503-513.
Bremmer, J.M. 1965. Inorganic forms of nitrogen. p. 1179-1237. In: Black, C.A., eds. Methods of soil analysis. Part 2. Chemical and microbiological properties. Soil Science Society of America, Madison, WI, USA. Bremmer, J.M.; Mulvaney, C.S. 1982. Nitrogen-total. p. 595-624. In: Page, A.L.; Miller, R.H.; Keeney, D.R., eds. Methods of soil analysis. Part 2: Chemical and microbiological properties. Soil Science Society of America, Madison, WI, USA.
Carvajal, M.; Del Amor, F.M.; Fernandez-Ballester, G.; Martínez, V.; Cerdá. A. 1998. Time course of solute accumulation and water relations in muskmelon plants exposed to salt during different growth stages. Plant Science 138: 103-112.
Cochard, H.; Herbette, S.; Hernández, E.; Hölttä, T.; Mencuccini, M. 2010. The effects of sap ionic composition on xylem vulnerability to cavitation. Journal of Experimental Botany 61: 275-285.
Díez, J.A. 1982. Considerations about the utilization of the Burriel and Hernando extractive technique for the determination of assimilable phosphorus in soils = Consideraciones sobre la utilización de la técnica extractiva de Burriel y Hernando para la evaluación del fosforo asimilable en suelos. Anales de Edafología y Agrobiología 41: 1345-1353 (in Spanish).
Dogan, M.; Tipirdamaz, R.; Demir, Y. 2010. Salt resistance of tomato species grown in sand culture. Plant, Soil and Environment 56: 499-507.
Gao, Y.; Li, D. 2012. Detecting salinity stress in tall fescue based on single leaf spectrum. Scientia Horticulturae 138: 159-164. Gee, G.W.; Bauder, J.W. 1986. Particle size analysis. p. 383-411.
In: Klute, A., ed. Methods of soil analysis. Part 1. Physical and mineralogical methods. Soil Science Society of America, Madison, WI, USA.
Gitelson, A.; Merzlyak, M.N. 1998. Remote sensing of chlorophyll concentration in higher plant leaves. Advances in Space Research 22: 689-692.
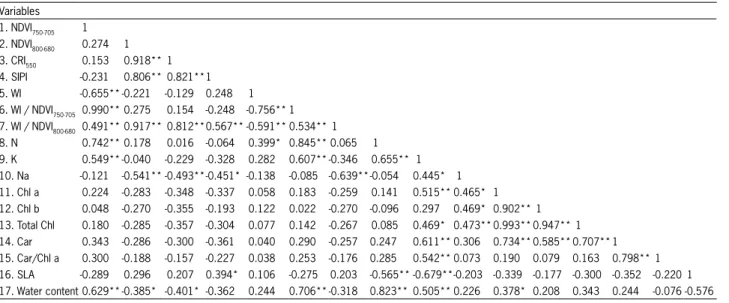
Table 6 – Pearson correlations between spectral indices and parameters measured in the leaf blades. Variables
Gitelson, A.A.; Zur, Y.; Chivkunova, O.B.; Merzlyak, M.N. 2002. Assessing carotenoid content in plant leaves with reflectance spectroscopy. Photochemistry and Photobiology 75: 272-281. Grattan, S.R.; Grieve, C.M. 1999. Mineral nutrient acquisition
and response by plants grown in saline environments. p. 203-229. In: Pessarakli, M. Handbook of plant and crop stress. Marcel Dekker, New York, NY, USA.
Hernández, E.I.; Vilagrosa, A.; Pausas, J.G.; Bellot, J. 2010. Morphological traits and water use strategies in seedlings of Mediterranean coexisting species. Plant Ecology 207: 233-244. Hernández, E.I.; Pausas, J.G.; Vilagrosa, A. 2011. Leaf
physiological traits in relation to resprouter ability in the Mediterranean Basis. Plant Ecology 212: 1959-1966.
Horler, D.N.H.; Dockray, M.; Barber, J. 1983. The red edge of plant leaf reflectance. International Journal of Remote Sensing 4: 273-288.
Iannucci, A.; Russo, M.; Arena, L.; Di Fonzo, N.; Martiniello, M. 2002. Water deficit effects on osmotic adjustment and solute accumulation in leaves of annual clovers. European Journal of Agronomy 16: 111-122.
International Union of Soil Science [IUSS]. 2006. World Reference Base for Soil Resources. 2ed. FAO, Rome, Italy. (World Soil Resources Report, 103).
Jensen, J.R. 1983. Biophysical remote sensing. Annals of the Association of American Geographers 73: 111-132.
Jones, L.H. 1971. Adaptive responses to temperature in dwarf French beans, Phaseolus vulgaris L. Annals of Botany 35: 581-596.
Kaya, C.; Tuna, A.L.; Ashraf, M.; Altunlu, H. 2007. Improved salt tolerance of melon (Cucumis melo L.) by the addition of proline and potassium nitrate. Environmental Experimental Botany 60: 397-403.
Kramer, P.J.; Boyer, J.S. 1995. Water Relations of Plants and Soils. Academic Press, San Diego, CA, USA.
Läuchli, A. 2002. Introduction to salinity. p. ix-x. In: Läuchli, A.; Lüttge, U., eds. Environment-plants-molecules. Kluwer, Dordrecht, The Netherlands.
Leone, A.P.; Menenti, M.; Buondonno, A.; Letizia, A.; Maffei, C.; Sorrentino, G. 2007. A field experiment on spectrometry of crop response to soil salinity. Agricultural Water Management 89: 39-48.
Lichtenthaler, H.K. 1987. Chlorophylls and carotenoids: pigments of photosynthetic biomembranes. Methods in Enzymology 148: 350-382.
Lindsay, W.L.; Norwell, W.A. 1978. Development of a DTPA soil test for zinc, iron, manganese and copper. Soil Science Society of America Journal 42: 421-428.
Melgar, J.C.; Syvertsen, J.P.; Martínez, V.; García-Sánchez, F. 2008. Leaf gas exchange, water relations, nutrient content and growth in citrus and olive seedlings under salinity. Biologia Plantarum 52: 385-390.
Monteith, J.L. 1973. Principles of Environmental Physics. Edward Arnold, London, UK.
Munns, R.; Husain, S.; Rivelli, A.R.; James, R.A.; Condon, A.G.; Lindsay, M.P.; Lagudah, E.S.; Schachtman, D.P.; Hare., R.A. 2002. Avenues for increasing salt tolerance of crops, and the role of physiologically based selection traits. Plant and Soil 247: 93-105.
Naumann, J.C.; Young, D.R.; Anderson, J.E. 2008. Leaf chlorophyll fluorescence, reflectance, and physiological response to freshwater and saltwater flooding in the evergreen shrub, Myricacerifera. Environmental Experimental Botany 63: 402-409.
Peñuelas, J.; Gamon, J.A.; Fredeen, A.L.; Merino, J.; Field, C.B. 1994. Reflectance indices associated with physiological changes in nitrogen- and water-limited sunflower leaves. Remote Sensing and Environment 48: 135-146.
Peñuelas, J.; Baret, F.; Filella, I. 1995. Semi-empirical indices to assess carotenoids: chlorophyll a ratio from leaf spectral reflectance. Photosynthetica 31: 221-230.
Peñuelas, J.; Piñol, J.; Ogaya, R.; Filella, I. 1997a. Estimation of plant water concentration by the reflectance Water Index WI (R900/R970). International Journal of Remote Sensing 18: 2869-2875.
Peñuelas, J.; Isla, R.; Filella, I.; Araus, J.L. 1997b. Visible and near-infrared reflectance assessment of salinity effects on Barley. CropScience 37: 198-202.
Pérez-Sirvent, C.; Martínez-Sánchez, M.J.; Sánchez, J.V. 2003. The role of low-quality irrigation water in the desertification of semi-arid zones in Murcia, SE Spain. Geoderma 113: 109-125. Poss, J.A.; Russell, W.B.; Grieve, C.M. 2006. Estimating yield of
salt- and water-stressed forages with remote sensing in the visible and near infrared. Journal of Environmental Quality 35: 1060-1071.
Qin, J.; Dong, W.Y.; He, K.N.; Yu, Y.; Tan, G.D.; Han, L.; Dong, M.; Zhang, Y.Y.; Zhang, D.; Li, Z.A.; Wang, Z.L. 2010. NaCl salinity-induced changes in water status, ion contents and photosyn thetic properties of Shepherdiaargentea (Pursh) Nutt. seedlings. Plant, Soil and Environment 56: 325-332.
Sohan, D.; Jasoni, R.; Zajicek, J. 1999. Plant-water relations of NaCl and calcium-treated sunflower plant. Environmental and Experimental Botany 42: 105-111.
Tedeschi, A.; Riccardi, M.; Menenti, M. 2011. Melon crops (Cucumis melo L., cv. Tendral) grown in a mediterranean environment under saline-sodic conditions. Part II. Growth analysis. Agricultural Water Management 98: 1339-1348. Tilley, D.R.; Ahmed, M.; Son, J.H.; Badrinarayanan, H. 2007.
Hyperspectral reflectance response of freshwater macrophytes to salinity in a brackish subtropical marsh. Journal of Environmental Quality 36: 780-789.
Tuna, A.L.; Kaya, C.; Ashraf, M. 2010. Potassium sulfate improves water deficit tolerance in melon plants grown under glasshouse conditions. Journal of Plant Nutrition 33: 1276-1286.
Zhang, T.T.; Zeng, S.L.; Gao, Y.; Ouyang, Z.T.; Li, B.; Fang, C.M.; Zhao, B. 2011. Using hyperspectral vegetation indices as a proxy to monitor soil salinity. Ecological Indicators 11: 1552-1562.