DOI: http://dx.doi.org/10.1590/2446-4740.04615
*e-mail: [email protected]
Received: 25 November 2015 / Accepted: 20 August 2016
Taxonomic indexes for differentiating malignancy of lung nodules
on CT images
Giovanni Lucca França da Silva*, Antonio Oseas de Carvalho Filho, Aristófanes Corrêa Silva, Anselmo Cardoso de Paiva, Marcelo Gattass
Abstract Introduction: Lung cancer remains the leading cause of cancer mortality worldwide, with one of the lowest survival rates after diagnosis. Therefore, early detection greatly increases the chances of improving patient survival. Methods: This study proposes a method for diagnosis of lung nodules in benign and malignant tumors based on image processing and pattern recognition techniques. Taxonomic indexes and phylogenetic trees were used as texture descriptors, and a Support Vector Machine was used for classiication. Results: The proposed method shows promising results for accurate diagnosis of benign and malignant lung tumors, achieving an accuracy of 88.44%, sensitivity of 84.22%, speciicity of 90.06% and area under the ROC curve of 0.8714. Conclusion: The results demonstrate the promising performance of texture extraction techniques by means of taxonomic indexes combined with phylogenetic trees. The proposed method achieves results comparable to those previously published.
Keywords: Medical image, Lung nodule diagnosis, Texture analysis, Taxonomic indexes.
Introduction
Lung cancer is the most frequent of all malignant tumors and has an increase of 2% per year in its
worldwide incidence. In 90% of cases, lung cancer is
associated with the consumption of tobacco products. In Brazil, estimates of lung cancer cases in the year
2014 were 27,330, with 16,400 men and 10,930
women (Instituto..., 2015).
One of the best opportunities to diagnose lung cancer is when an asymptomatic patient, normally a smoker, undergoes a computerized tomography (CT) exam (Srichai, 2007). The detection of such nodules using CT is not a simple task, because they can have contrasts similar to other structures, low density, and small size in an area of complex anatomy (connected to blood vessels or on the borders of the lung), among other issues (Carvalho et al., 2014).
A variety of computer-aided detection and diagnosis techniques have been proposed for the detection and characterization of tumors (Carvalho et al., 2016; Gupta and Tiwari, 2014; Hua et al., 2015). The development of such techniques can be divided into two main categories: computer-aided detection (CADe) and computer-aided diagnosis (CADx). CADx systems would allow for the reduction of the number of unnecessary biopsies in patients with benign tumors, preventing physical and mental depression inpatients. Thus, CADx acts as a second opinion, aiding experts
to achieve accurate and eficient diagnosis of cancer
cells in the earlier stages of the disease (Parveen and Kavitha, 2014).
Various initiatives are frequently developed with the goal of increasing the accuracy of lung cancer diagnosis using CADx systems. Nascimento et al. (2012) proposed a methodology based on texture features using Linear Discriminant Analysis (LDA) and Support Vector Machine (SVM), with an accuracy
rate of 92.78%. Orozco et al. (2013) proposed a methodology based on texture features using Correlation-based Feature Subset Selection, k-Nearest Neighbor (KNN) and SVM, with an accuracy rate of 82.66%. Krewer et al. (2013) proposed a methodology based on a combination of texture and shape features using Correlation-based Feature Subset Selection and
KNN, with an accuracy rate of 90.91%. Dandil et al. (2014) proposed a methodology based on texture features using Principal Component Analysis (PCA)
and Artiicial Neural Network (ANN), with an accuracy rate of 90.63%. Parveen and Kavitha (2014) proposed a methodology based on texture features using SVM,
with a sensitivity rate of 91.38% and speciicity rate of 89.56%.
Kuruvilla and Gunavathi (2014) proposed a method based on texture features using ANN, with an accuracy
a methodology based on shape features using ANN,
with an accuracy rate of 90.00%. Hua et al. (2015) proposed a method based on deep learning techniques, Deep Belief Network (DBN) and Convolutional Neural Network (CNN), achieving a sensitivity rate
of 73.30% and speciicity rate of 78.70%. Kumar et al. (2015) used Stacked Autoencoders (SAE) achieving
accuracy of 75.01%.
In most CADx methods, the feature extraction stage is based on shape and on texture. In the present study, we used taxonomic indexes, which were originally used in ecology, as texture descriptors. Only texture features were used to analyze the intratumor heterogeneity. According to Gerlinger et al. (2012), intratumor heterogeneity may foster tumor evolution and adaptation, and, therefore, assist in the lung cancer diagnosis. Another reason to use only texture features is because marking by experts are always greater than the real area of the nodule, making shape-based
analysis on more dificult.
The taxonomic diversity index (∆) and taxonomic distinction index (∆*), which were originally applied
in ecology, are used for describing the texture of
nodules in benign and malignant. The irst considers the
abundance of the species and taxonomic relationship between them, while the second represents the mean taxonomic distance between two individuals of different species. These indexes are based on phylogenetic distance, considering the architecture of a rooted tree in the form of an inclined cladogram. The use of these indexes as texture descriptors is due to the promising results published by Carvalho et al. (2016)
for classiication of lung regions extracted from CT
images as nodule and non-nodule. As an improvement of the methodology published by Carvalho et al. (2016), we propose a method using the same indexes
applied to nodules and regions generated by internal and external masks to differentiate malignancy of lung nodules on CT images.
Methods
This section describes the steps used in the
proposed methodology for the classiication of lung
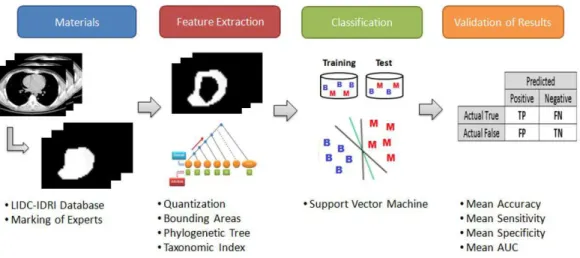
nodules in CT images. The methodology is divided into four steps as described in Figure 1. In summary,
the irst step details the materials used as images of
CT exams in the LIDC-IDRI database and the nodules segmentation. In the second, the feature extraction is conducted using the taxonomic indexes. After this
step, the classiication is completed using the SVM.
Finally, the results are evaluated.
The methods were implemented in C++ language and ITK software, running on a machine with an Intel
Core i7 CPU at 3.07 GHz processor, 4 GB of RAM and Windows 7 operation system.
Database
The images used in this work were acquired from the LIDC-IDRI (Armato et al., 2011) database, which is available online as a result of an association between the Lung Image Database Consortium and the Image Database Resource Initiative, and includes 1,018 CT exams. However, two factors made some of them (185 exams) inappropriate for this methodology.
The irst factor is related to exams that do not present nodules equal to or larger than 3 mm. The second
factor is the divergence of information found in
the marking ile of an exam versus the information
present in the DICOM header of the same exam, which invalidates the marking (Carvalho et al., 2016).
Therefore, 833 exams were used.
In the LIDC-IDRI database, all the images are in the DICOM format and have 512 × 512 of dimension with 16 bits per voxel. The database supplies an
XML ile with contour information for the slices, and several features including calciication, texture and
malignancy with values ranging from 1 to 5 for lung
nodules larger than 3 mm. This paper considers only
the feature malignancy, used to separate the nodules in malignant and benign. The process of annotating the nodules of the LIDC-IDRI database was performed
by four experts in two stages. In the irst stage, each
expert analyzed the exams individually. In the second
stage, the results of the four analyses of the irst stage
were presented together to the four experts. During this stage, each of the experts re-analyzed the exams and again made their annotations independently (Nascimento et al., 2012).
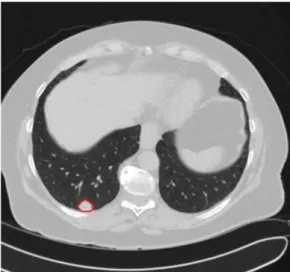
With respect to nodules segmentation, information was obtained from a XML file containing the coordinates of the nodules with analysis criterion of each expert. There is no consensus imposition, all nodules indicated by the revision of experts are taken into account and recorded. Thus, it is possible to have a different diagnosis for the same nodule. This paper considers only one instance per nodule, with the objective of minimizing the impact of subjectivity
in exams. The classiication of malignant or benign is obtained irst with computation as presented in
(Jabon et al., 2009), which summarizes the features of each nodule as determined by the four experts by computing the mode or the median into one single value. According to the result of this summary, this paper considers that malignant nodules are those cases that present malignancy semantic values of moderately suspicious or highly suspicious and benign nodules are those cases that present characteristics that are highly or moderately indicative of a benign tumor. Regarding contour, the value that contains larger bounds among the four markings made during the annotating process was used. As a total, 1,405 nodules
(to which 1,011 benign and 394 malignant) were
obtained. Figure 2 shows an example of an expert’s marking in a CT image.
Features extraction
The segmented nodule data were submitted to the feature extraction stage based only on texture. First, each image was quantized in two levels: 8 and 12 bits. A uniform quantization process (Gonzalez
and Woods, 2007) was used to combine individuals
(voxels) into a smaller number of “species” (Hounsield unit - HU), enabling analysis of the image at different
gray scale levels, in addition to the original image
(16 bits). We deined the levels 8, 12 and 16 bits,
as it was veriied in tests that obtained the best
results. The taxonomic diversity and taxonomic distinction indexes are used to describe the texture of objects. These indexes are based on phylogenetic distance (accounting for number of edges) based on the tree architecture. The other requirements for
the generation of the tree are the species (HU) and
individuals (voxels) acquired based on the bounding area approaches, which were internal and external mask. The objective of dividing the region of interest into masks is to perform a local analysis, which is useful because these areas of the mask may supply information that can distinguish nodules as benign
and malignant, such as calciication, irregular margins
and speculated borders (Tan et al., 2003).
Approaches with internal and external masks
The objective of this stage is to ind diversity
patterns in the areas close to the border of the regions and in the inner areas (Oliveira et al., 2015). These regions were generated through masks as binary
images. The irst internal mask was created with
the binarization of the quantized volume of interest (VOI), and the second internal mask was based on successive reductions of the scale of the VOI with
respect to the irst one, while maintaining the center
of mass. The successor masks were acquired from their previous mask following to the most internal.
We deined a value of 20% for the diminution of scale, as it was veriied in tests that the best results were achieved using ive image masks with this
scaling proportion.
The external masks are determined by the difference
between the internal masks, where the irst external mask is determined by the difference between the irst
and the second internal mask, and so on.
Phylogenetic tree
Diversity is a term often used in ecology and describes the variety of species present in a community
or area. A community is deined as a set of species
that occur in a certain location and at a certain time (Magurran, 2004). Phylogeny is a branch of biology responsible for the study of evolutionary adaptive relationships among species by verifying the relationship between them, to determine possible common ancestors. A phylogenetic tree, or simply phylogeny, is a tree in which the leaves represent the organisms and the internal nodes represent supposed ancestors. The edges of the tree denote evolutionary relationships (Pienkowski et al., 1998).
The calculation for two randomly chosen species in a phylogeny existing in the community is performed
by means of taxonomic diversity (∆) and taxonomic distinction (∆*) indexes (Pienkowski et al., 1998). These indexes consider three essential factors: the number of species, the number of individuals and the connectivity structure of the species (number of edges). In the present work, these two indexes are used to delineate benign nodules and malignant nodules.
The taxonomic diversity index (∆) considers
the abundance of the species and the taxonomic relationship among them. This way, its value expresses the mean taxonomic distance between the individuals (Pienkowski et al., 1998).
( )1 2 i j ij ix xj n n
<ω
∑∑ ∆ =
−
(1)
where xi (i = 1,...,S) is the number of individuals of the
i th species, xj (j = 1,...,S) is the number of individuals of the j th species, S represents the total number of species, n is the total number of individuals and ωij
is the distance of the species i to the species j in the taxonomic tree.
The taxonomic distinction index (∆*) represents the
mean taxonomic distance between two individuals that belong to different species (Pienkowski et al., 1998).
* i j ij i j
i j i j x x x x
< <
ω ∑∑ ∆ =
∑∑ (2)
where xi (i = 1,...,S) is the number of individuals of the
i th species, xj (j = 1,...,S) is the number of individuals of the j th species, S represents the total number of
species and ωij is the distance of the species i to the
species j in the taxonomic tree.
Various iterations reported in the literature represent the species through trees, such as the architecture called a “rooted tree” in the shape of an inclined cladogram
(Moura and Viana, 2011). The inclined cladogram is a graphical representation used to describe the phylogenetic relationship between ancestor species; these trees allow the extraction of indexes that connect diversity, richness and parenthood between species (Oliveira et al., 2015). In the present study,
this architecture was adapted to ind a more strict
discrimination between the benign and malignant classes, which, according to Magurran (2004), a community in which the species are distributed in many types must present a higher diversity than a community in which most species belong to the same category. The architectures of trees used in this paper are presented in the following sections.
The phylogenetic tree combined with taxonomic diversity and distinction indexes are used in biological studies to compare behavior patterns of species in different areas. To implement this methodology, the
irst step is to derive a correspondence between the
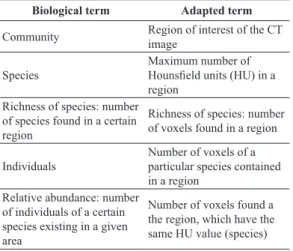
terms used in biology and those used in this tumor diagnostics. Table 1 shows this correspondence.
Tree 1: Rooted tree shaped as an inclined cladogram
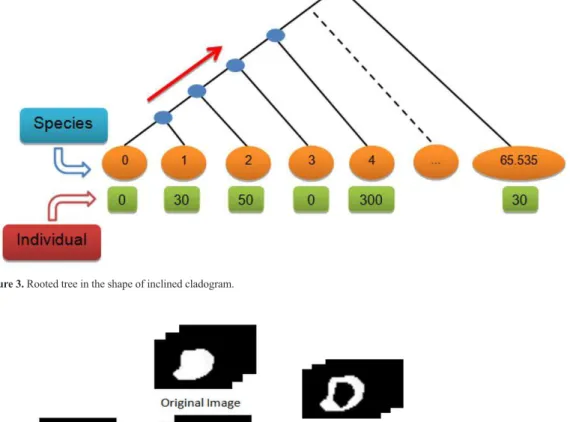
With the candidate region extracted (internal and external mask), the trees are created. Figure 3
shows a tree, in which the species are HU and can vary between -32768 and +32768. A simple change
was applied to make every value positive, with the goal of making the index calculations simpler
[-32768, +32768] → [0, 65536].
The relationship between species is considered from left to right as pointed by the red arrow in
Figure 3. The relation between a species i and j has
ωij = (j – i) + 1 edges, for i = 0, and ωij = (j – i) + 2
edges, for i > 0 (Carvalho et al., 2016).
Table 1. Correspondence between biological terms and adapted terms used in this paper.
Biological term Adapted term
Community Region of interest of the CT
image
Species
Maximum number of Hounsield units (HU) in a region
Richness of species: number of species found in a certain region
Richness of species: number of voxels found in a region
Individuals
Number of voxels of a particular species contained in a region
Relative abundance: number of individuals of a certain species existing in a given area
Tree 2: Rooted tree as an inclined cladogram excluding species with no individuals
Following the same logic of the calculation of the indexes based on the previous tree, another architecture was developed to remove species with no individuals, resulting in the reorganization of the edges for the remaining species. The species distances
(ωij) are computed according this modiied structure.
Tree 3: Rooted tree as an inclined cladogram modifying the edges
The third proposed tree has the same combination process between species of Tree 1, with the only difference being the addition of a ponderation for more distant species pairs in the computation of the
number of edges. The ωij is computed by: ωij = 2* (j – i)
edges, for i = 0, and ωij = 2* (j – i) +1 edges, for i > 0 (Carvalho et al., 2016).
After this step, 54 features were extracted ((1 original image + 2 quantizations) x (5 internal masks + 4 external masks) x 2 indexes) for each tree architecture described above. Figure 4 details this process. The creation of phylogenetic trees and the computation of taxonomic diversity and distinction indexes are applied on the quantized regions and original regions.
Classiication
SVM is a powerful, state-of-the-art algorithm with strong theoretical foundations based on the Vapnik-Chervonenkis theory. SVM has strong
Figure 3. Rooted tree in the shape of inclined cladogram.
regularization properties that inluence the generalization
of the model to new data. This is the main reason
for applying this classiier in the present study.
The accuracy of a SVM model is largely dependent on the selection of the kernel parameters such as C, controls the tradeoff between margin maximization
and error minimization, and γ, deines how far the inluence of a single training example reaches, for a RBF. A small C makes the cost of misclassiication
low, while a large C aims at classifying all training examples correctly by giving the model freedom to select more samples as support vectors and a small
γ means a Gaussian with a large variance and low bias, while a large γ means a low variance and large
bias, implying the support vector does not have
widespread inluence (Duda and Hart, 1973). It was used the software LibSVM (Chang and Lin, 2011) to estimate these two parameters. All of the values in the sample were normalized between -1 and 1 to improve the performance of the SVM. This way, a shorter processing time without mischaracterizing the original value of the feature is made possible (Duda
and Hart, 1973).
Database separation
In order to evaluate the methodology, the database was divided into two groups: training and test, with the following proportions: 20% and 80%, 40% and 60%, 60% and 40%, and 80% and 20%. For each group, the individuals were randomly chosen and proportionally for training and testing. The purpose of these groups is showing that the methodology performs well with the best (80% and 20%) and the worst (20% and 80%) training and testing cases.
Validation
After the conclusion of the classiication stage, it is
necessary to validate and discuss the results. The method uses metrics commonly used in CADe / CADx systems that are widely accepted for performance analysis of image processing-based systems. These metrics
include sensitivity, speciicity, accuracy and area under the ROC curve (AUC) (Duda and Hart, 1973). In addition to these metrics, the standard deviation was used to analyze the amount of variation of the four proportions of training and test.
Equations 3, 4, 5 represent the formulas used to calculate the sensitivity, speciicity and accuracy,
respectively.
TP Sensitivity
TP FN
= + (3)
TN Specificity
TN FP
= + (4)
TP TN Accuracy
TP TN FP FN
+
= + + + (5)
where TP is true positive, FN is false negative, TN is true negative, and FP is false positive.
Results
This section presents the results obtained with the proposed methodology with reference to the lung nodules diagnosis in CT exams, by applying a set of 1,405 nodules (of which 1,011 benign and
394 malignant). Due to the unbalanced data, different
penalty parameters in the SVM formulation were used for classes’ regularization, to which 1.0 for benign
class and 3.0 for malignant class. The SVM performs ive classiications for each proportion of training and
test, described in Subsection Database Separation,
that are evaluated by means of sensitivity, speciicity, accuracy and AUC. The results of each tree and all
trees together are provided next.
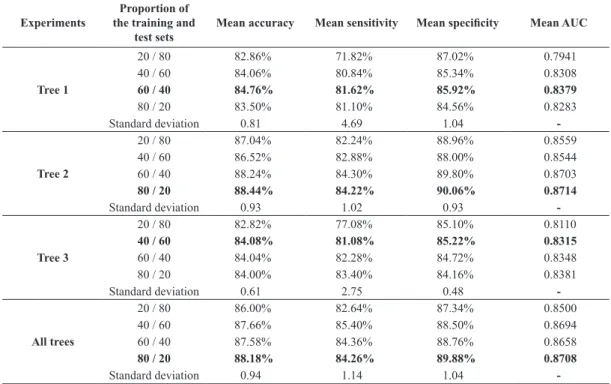
Table 2 shows the results for all experiments, including the means of accuracy, sensitivity,
speciicity and AUC for the ive tests performed on
each proportion, followed by the respective standard
deviations, for each tree. The inal experiment was
based on a combination of the all of trees presented. For the experiments of Tree 1, we obtained the best mean accuracy for the 60/40 proportion, with standard deviation less than one, indicating that the values have little variation among proportions. However, the standard deviation in the mean sensitivity has high value compared with other experiments, indicating a high variation for the malignant nodules
classiication. Tree 2 presents its best mean accuracy
for the 80/20 proportion. All metrics obtained low standard deviations, indicating the results’ robustness
in all proportions. For Tree 3, the best mean accuracy
was found for the 40/60 proportion, notwithstanding
the best mean AUC was found in the 60/40 proportion.
The combination of the all of trees presented its best mean accuracy for the 80/20 proportion, nevertheless the best mean sensitivity of all experiments, test’s ability to correctly detect malignant nodules, was found for the 40/60 proportion. The worst results of all experiments were obtained for the 20/80 proportion, due to the small amount of nodules used in training.
The ideal CADx system has a good balance among the three metrics used for evaluation (accuracy, sensitivity
and speciicity), since a good methodology must be
the experiments of Tree 2, for the 80/20 proportion. This can be attributed to the elimination of species with no individuals. In this way, in a community in which the species actually have individuals and are organized according to them, the diversity among the species becomes higher (Magurran, 2004). Table 3 presents the SVM parameters for the best results of
each tree; i.e., parameters C and γ of the ive tests
comprising each experiment performed.
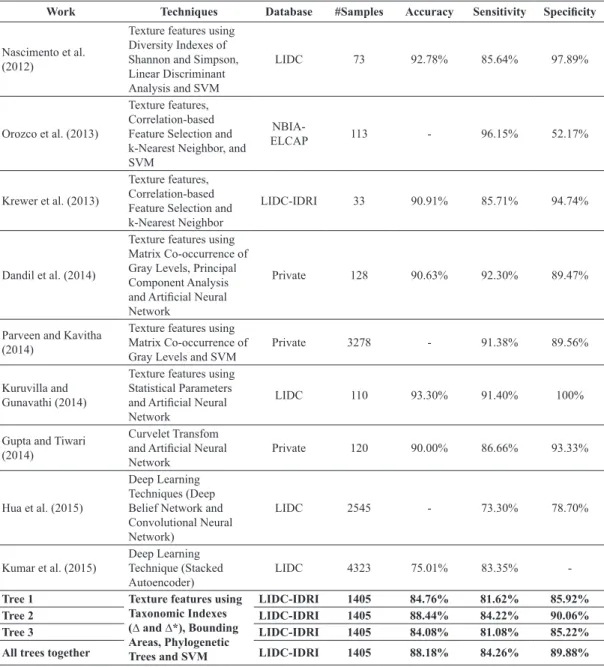
Comparison with related works
Table 4 shows a comparison between the results found on this paper and some of the related works. It is important to emphasize that to perform a reliable comparison with these previous works, it would be necessary to use the same image database, same training
and test exams, and same settings for the classiiers,
among other parameters. Even if we compared studies
with the same image database, only (Krewer et al.,
2013) used LIDC-IDRI. The methodology proposed by Krewer et al. (2013) shows a value superior to those presented here for all experiments for sensitivity,
speciicity and accuracy. However, our methodology
used 1,405 samples of nodules whereas Krewer’s
methodology used only 33 samples of nodules, and
yet obtained results close to his work.
Analysis of published studies revealed that the proposed methodology achieves results comparable to the most reliable previously reported studies, as shown in Table 4. However, sometimes, some values are lower for some metrics, indicating that the
experiments performed for the classiication of lung
nodules as benign or malignant appear promising. This encourages further study, even for the use in conjunction with other existing methodologies.
Table 2. Overall results of the experiments.
Experiments
Proportion of the training and
test sets
Mean accuracy Mean sensitivity Mean speciicity Mean AUC
Tree 1
20 / 80 82.86% 71.82% 87.02% 0.7941
40 / 60 84.06% 80.84% 85.34% 0.8308
60 / 40 84.76% 81.62% 85.92% 0.8379
80 / 20 83.50% 81.10% 84.56% 0.8283
Standard deviation 0.81 4.69 1.04
-Tree 2
20 / 80 87.04% 82.24% 88.96% 0.8559
40 / 60 86.52% 82.88% 88.00% 0.8544
60 / 40 88.24% 84.30% 89.80% 0.8703
80 / 20 88.44% 84.22% 90.06% 0.8714
Standard deviation 0.93 1.02 0.93
-Tree 3
20 / 80 82.82% 77.08% 85.10% 0.8110
40 / 60 84.08% 81.08% 85.22% 0.8315
60 / 40 84.04% 82.28% 84.72% 0.8348
80 / 20 84.00% 83.40% 84.16% 0.8381
Standard deviation 0.61 2.75 0.48
-All trees
20 / 80 86.00% 82.64% 87.34% 0.8500
40 / 60 87.66% 85.40% 88.50% 0.8694
60 / 40 87.58% 84.36% 88.76% 0.8658
80 / 20 88.18% 84.26% 89.88% 0.8708
Standard deviation 0.94 1.14 1.04
-Table 3. SVM parameters for the best results of each experiment.
#Exp Tree 1 Tree 2 Tree 3 All Tree
C γ C γ C γ C γ
1 128 0.0078125 0.5 0.125 8 0.125 32 0.0078125
2 32768 0.000488281 32 0.0078125 32 0.125 2 0.03125
3 512 0.0078125 32 0.0078125 2048 0.0078125 8 0.0078125
4 32 0.03125 2 0.5 8 0.125 32 0.0078125
Discussion
High rates of deaths and records of lung cancer occurrences in Brazil and around the world demonstrate the importance of developing methods for early diagnosis of the disease, thereby enabling more effective treatment. Accurate diagnosis confers a considerable increase on the survival probability of the patients. In our research group, Carvalho et al. (2014) proposed a method for automatic detection of lung nodules, using quality threshold clustering, genetic algorithm and diversity indexes such as, Simpson’s and Shannon’s indexes. In order to reduce the number of false positives, Carvalho et al. (2016)
proposed a method for classiication of lung regions
extracted from CT images as nodule and non-nodule using different diversity indexes such as taxonomic diversity and taxonomic distinction, to improve the performance of CADe system. As a next step to improve and incorporate into CADx systems, we proposed
the use of taxonomic diversity (∆) and taxonomic distinction (∆*) indexes to classify and differentiate
lung nodules into benign or malignant, acting as a
second opinion for the experts in the inal diagnosis.
The proposed method was evaluated over
1,405 nodules (of which 1,011 benign and 394 malignant)
from the LIDC-IDRI database, which were divided
Table 4. Comparison with other publications with respect to the classiication of lung nodules in benign and malignant tumors.
Work Techniques Database #Samples Accuracy Sensitivity Speciicity
Nascimento et al. (2012)
Texture features using Diversity Indexes of Shannon and Simpson, Linear Discriminant Analysis and SVM
LIDC 73 92.78% 85.64% 97.89%
Orozco et al. (2013)
Texture features, Correlation-based Feature Selection and k-Nearest Neighbor, and SVM
NBIA-ELCAP 113 - 96.15% 52.17%
Krewer et al. (2013)
Texture features, Correlation-based Feature Selection and k-Nearest Neighbor
LIDC-IDRI 33 90.91% 85.71% 94.74%
Dandil et al. (2014)
Texture features using Matrix Co-occurrence of Gray Levels, Principal Component Analysis and Artiicial Neural Network
Private 128 90.63% 92.30% 89.47%
Parveen and Kavitha (2014)
Texture features using Matrix Co-occurrence of Gray Levels and SVM
Private 3278 - 91.38% 89.56%
Kuruvilla and Gunavathi (2014)
Texture features using Statistical Parameters and Artiicial Neural Network
LIDC 110 93.30% 91.40% 100%
Gupta and Tiwari (2014)
Curvelet Transfom and Artiicial Neural Network
Private 120 90.00% 86.66% 93.33%
Hua et al. (2015)
Deep Learning Techniques (Deep Belief Network and Convolutional Neural Network)
LIDC 2545 - 73.30% 78.70%
Kumar et al. (2015)
Deep Learning Technique (Stacked Autoencoder)
LIDC 4323 75.01% 83.35%
-Tree 1 Texture features using
Taxonomic Indexes
(∆ and ∆*), Bounding Areas, Phylogenetic
Trees and SVM
LIDC-IDRI 1405 84.76% 81.62% 85.92%
Tree 2 LIDC-IDRI 1405 88.44% 84.22% 90.06%
Tree 3 LIDC-IDRI 1405 84.08% 81.08% 85.22%
into the following training and testing proportions: 20/80, 40/60, 60/40, 80/20. The experimental results allowed the formulation of the following conclusions:
1. The use of taxonomic indexes ∆ and ∆*
combined with phylogenetic trees led to
good results in terms of classiication of
lung nodules as benign and malignant.
2. The use of uniform quantization to represent the image at different gray scale levels (8 and 12 bits, besides the original image) produced better results than using only the original image (16 bits).
3. The use of regions extracted based on internal
and external masks produced good results when they were combined.
4. Tree 2 achieved the best result of the proposed methodology, with a mean accuracy of 88.44%, mean sensitivity of 84.22%, mean
speciicity of 90.06% and mean AUC of 0.8714.
5. Finally, it is important to highlight that the LIDC-IDRI database is extremely complex and diverse, containing countless different cases of lung nodules. This database has exams that were extracted by various
tomography methods, leading to dificulty in the detection, classiication or even
diagnosis through CADe / CADx systems.
All of the above-mentioned attributes aggregate value to this methodology. The properties of the texture
analysis through taxonomic indexes of diversity (∆) and distinction (∆*) combined with phylogenetic trees
showed good response to the experiments. Additionally, the complexity of the LIDC-IDRI database allows a more precise conclusion on the results.
Finally, the results demonstrate the promising performance of the texture extraction techniques by the indexes presented. Another important result was the creation of the phylogenetic tree. In other words, the usage of this tree performed well in the separation of benign and malignant nodules. Although the database used is highly robust and ensures great diversity of nodules to be analyzed, more tests are necessary in other databases to improve the methodology, making it more robust and generic. The methodology presented in this work could integrate a CADx system to be applied in the diagnosis of lung nodule, making the
analysis of exams by experts more eficient and less
exhaustive.
Acknowledgements
The authors acknowledge CAPES and CNPq for
the inancial support. The authors acknowledge the
National Cancer Institute and the Foundation for the National Institutes of Health for their critical role in the creation of the free, public available LIDC-IDRI database used in this study.
References
Armato SG 3rd, McLennan G, Bidaut L, McNitt-Gray MF, Meyer CR, Reeves AP, Zhao B, Aberle DR, Henschke CI, Hoffman EA, Kazerooni EA, MacMahon H, Van Beeke EJ, Yankelevitz D, Biancardi AM, Bland PH, Brown MS, Engelmann RM, Laderach GE, Max D, Pais RC, Qing DP, Roberts RY, Smith AR, Starkey A, Batrah P, Caligiuri P, Farooqi A, Gladish GW, Jude CM, Munden RF, Petkovska I, Quint LE, Schwartz LH, Sundaram B, Dodd LE, Fenimore C, Gur D, Petrick N, Freymann J, Kirby J, Hughes B, Casteele AV, Gupte S, Sallamm M, Heath MD, Kuhn MH, Dharaiya E, Burns R, Fryd DS, Salganicoff M, Anand V, Shreter U, Vastagh S, Croft BY. The Lung Image Database Consortium (LIDC) and Image Database Resource Initiative (IDRI): a completed reference database of lung nodules on CT scans. Medical Physics. 2011; 38(2):915-31. http:// dx.doi.org/10.1118/1.3528204. PMid:21452728. Carvalho AO Fo, Sampaio WB, Silva AC, Paiva AC, Nunes RA, Gattass M. Automatic detection of solitary lung nodules using quality threshold clustering, genetic algorithm and diversity index. Artificial Intelligence in Medicine. 2014; 60(3):165-77. http://dx.doi.org/10.1016/j.artmed.2013.11.002. PMid:24332156.
Carvalho AO Fo, Silva AC, Paiva AC, Nunes RA, Gattass M. Lung-nodule classification based on computed tomography using taxonomic diversity indexes and an SVM. Journal of Signal Processing Systems for Signal, Image, and Video Technology. 2016. In press.
Chang CC, Lin CJ. LIBSVM: a library for support vector machines. ACM Transactions on Intelligent Systems and Technology. 2011; 2(3):27. http://dx.doi. org/10.1145/1961189.1961199.
Dandil E, Cakiroglu M, Eksi Z, Ozkan M, Kurt OK, Canan A. Artificial neural network-based classification system for lung nodules on computed tomography scans. In: Proceedings of the 6th International Conference of Soft Computing and Pattern Recognition (SoCPaR); 2014; Tunis, Tunisia. USA: IEEE Transaction on Pattern Analysis and Machine Intelligence; 2014. p. 382-6.
Duda RO, Hart PE. Pattern classification and scene analysis. 3rd ed. New York: Wiley; 1973.
by multiregion sequencing. The New England Journal of Medicine. 2012; 366(10):883-92. http://dx.doi.org/10.1056/ NEJMoa1113205. PMid:22397650.
Gonzalez RC, Woods RE. Digital image processing. 3rd ed. Upper Saddle River: Prentice Hal; 2007.
Gupta B, Tiwari S. Lung cancer detection using curvelet transform and neural network. International Journal of Computers and Applications. 2014; 86(1):15-7. http:// dx.doi.org/10.5120/14949-3082.
Hua K-L, Hsu C-H, Hidayati SC, Cheng WH, Chen YJ. Computer-aided classification of lung nodules on computed tomography images via deep learning technique. OncoTargets and Therapy. 2015; 8:2015-22. http://dx.doi.org/10.2147/ OTT.S80733. PMid:26346558.
Instituto Nacional do Câncer. INCA. Tipos de câncer: pulmão [internet]. Brasília: INCA; 2015. [cited 2015 Mar 20]. Available from: http://www2.inca.gov.br/wps/wcm/ connect/tiposdecancer/site/home/pulmao
Jabon SA, Raicu DS, Furst JD. Content-based versus semantic-based retrieval: an LIDC case study. SPIE Medical Imaging. 2009; 7263:1-8.
Krewer H, Geiger B, Hall LO, Goldgof DB, Gu Y, Tockman M, Gillies RJ. Effect of texture features in computer aided diagnosis of pulmonary nodules in low-dose computed tomography. In: Proceedings of the IEEE International Conference on Systems, Man, and Cybernetics (SMC); 2013; Manchester, United Kingdom. USA: IEEE; 2013. p. 3887-91.
Kumar D, Wong A, Clausi DA. Lung nodule classification using deep features in CT images. In: Proceedings of the 12th Conference on Computer and Robot Vision (CRV); 2015; Halifax, Nova Scotia. USA: IEEE; 2015. p. 133-8. Kuruvilla J, Gunavathi K. Lung cancer classification using neural networks for CT images. Computer Methods and Programs in Biomedicine. 2014; 113(1):202-9. http:// dx.doi.org/10.1016/j.cmpb.2013.10.011. PMid:24199657. Magurran AE. Measuring biological diversity. African Journal of Aquatic Science. 2004; 29(2):285-6. http://dx.doi. org/10.2989/16085910409503825.
Moura H, Viana G. Phylogenetic Trees Drawing Web Service. In: Proceedings of the 3rd International Conference on Bioinformatics, Biocomputational Systems and Biotechnologies (BIOTECHNO 2011); 2011; Venice, Italy. Wilmington: IARIA; 2011. p. 73-7.
Nascimento LB, Paiva AC, Silva AC. Lung nodules classification in CT images using Shannon and Simpson diversity indices and SVM. In: Perner P. Machine learning and data mining in pattern recognition. Heidelberg: Springer Berlin Heidelberg; 2012. p. 454-66.
Oliveira FSS, Carvalho AO Fo, Silva AC, Paiva AC, Gattass M. Classification of breast regions as mass and non-mass based on digital mammograms using taxonomic indexes and SVM. Computers in Biology and Medicine. 2015; 57:42-53. http://dx.doi.org/10.1016/j.compbiomed.2014.11.016. PMid:25528696.
Orozco MH, Villegas OOV, Dominguez HJO, Sanchez VGC. Lung nodule classification in CT thorax images using support vector machines. In: Proceedings of the 12th Mexican International Conference on Artificial Intelligence (MICAI); 2013; Mexico City, Mexico. USA: IEEE; 2013. p. 277-83. Parveen SS, Kavitha C. Classification of lung cancer nodules using SVM Kernels. International Journal of Computers and Applications. 2014; 95(25):25-8. http:// dx.doi.org/10.5120/16751-7013.
Pienkowski MW, Watkinson AR, Kerby G, Clarke KR, Warwick RM. A taxonomic distinctness index and its statistical properties. Journal of Applied Ecology. 1998; 35(4):523-31. http://dx.doi.org/10.1046/j.1365-2664.1998.3540523.x. Srichai MB. Lung cancer. In: Naidich DP, Müller NL, Webb WR, editors. Computed tomography and magnetic resonance of the thorax. 4th ed. Philadelphia: Lippincott Williams & Wilkins; 2007.
Tan BB, Flaherty KR, Kazerooni EA, Iannettoni MD. The solitary pulmonary nodule. Chest. 2003; 123(1 Suppl):89S-96S. http://dx.doi.org/10.1378/chest.123.1_suppl.89S. PMid:12527568.
Authors
Giovanni Lucca França da Silva1*, Antonio Oseas de Carvalho Filho1, Aristófanes Corrêa Silva1, Anselmo Cardoso
de Paiva1, Marcelo Gattass2
1 Computer Science Department, Universidade Federal do Maranhão – UFMA, Av. dos Portugueses, s/n, Campus do Bacanga, Bacanga, CEP 65085-580, São Luís, MA, Brazil.