www.atmos-chem-phys.net/10/8601/2010/ doi:10.5194/acp-10-8601-2010
© Author(s) 2010. CC Attribution 3.0 License.
Chemistry
and Physics
Novel method of generation of Ca(HCO
3
)
2
and CaCO
3
aerosols and
first determination of hygroscopic and cloud condensation nuclei
activation properties
D. F. Zhao1,2, A. Buchholz2, Th. F. Mentel2, K.-P. M ¨uller2, J. Borchardt2, A. Kiendler-Scharr2, C. Spindler2, R. Tillmann2, A. Trimborn3, T. Zhu1, and A. Wahner2
1State Key Joint Laboratory of Environmental Simulation and Pollution Control, College of Environmental Sciences and
Engineering, Peking University, Beijing, 100871, China
2Forschungszentrum J¨ulich, Institut f¨ur Chemie und Dynamik der Geosph¨are – 2: Troposph¨are, 52425 J¨ulich, Germany 3Aerodyne Research Inc., 45 Manning Rd, Billerica, MA 01821, USA
Received: 10 March 2010 – Published in Atmos. Chem. Phys. Discuss.: 26 March 2010 Revised: 12 August 2010 – Accepted: 16 August 2010 – Published: 14 September 2010
Abstract. Atmospheric mineral aerosols contain CaCO3as
a reactive component. A novel method to produce CaCO3
aerosol was developed by spraying Ca(HCO3)2 solution,
which was generated from a CaCO3 suspension and CO2.
By aerosol mass spectrometry the freshly sprayed and dried aerosol was characterized to consist of pure Ca(HCO3)2
which under annealing in a tube furnace transformed into CaCO3. Transmission Electron Microscopy demonstrated
that the particles produced were spherical. The method was able to generate aerosol of sufficient concentration and proper size for the study of physiochemical properties and investigations of heterogeneous reactions of mineral aerosol. The dried Ca(HCO3)2 particles were somewhat more
hygroscopic than CaCO3 particles. However, during
hu-midification a restructuring took place and ∼2/3 of the Ca(HCO3)2 was transformed to CaCO3. The mixed
Ca(HCO3)2/CaCO3(s) particles were insoluble with a
growth factor of 1.03 at 95% (hygroscopicity parameter
κ=0.011±0.007) relative humidity. This compares to a cor-responding growth factor of 1.01 for CaCO3(s) (κ=0.0016±
0.0004). Mass spectrometric composition analysis, restruc-turing, and insolubility of the mixed particles suggested that solid Ca(HCO3)2(s) was observed. This would be in contrast to the current belief that Ca(HCO3)2(s) is thermodynami-cally instable. The CCN activity of Ca(HCO3)2(s) aerosol
Correspondence to:Th. F. Mentel ([email protected])
(κ≈0.15) is remarkably higher than that of CaCO3aerosol
(κ=0.0019±0.0007) and less than that of Ca(NO3)2. The
no-ticeable but limited solubility of Ca(HCO3)2of≈0.01 mol/l
explains limited hygroscopic growth and good CCN activity. Experiments in the Large J¨ulich Aerosol Chamber indi-cated that Ca(HCO3)2(s) could exist for several hours un-der dry atmospheric conditions. However, it was likely buried in a protective layer of CaCO3(s). We conclude
that Ca(HCO3)2may be formed in the atmosphere in cloud
droplets of activated mineral dust by reaction of CaCO3with
CO2and H2O. The presence of Ca(HCO3)2and as a
conse-quence an enhanced CCN activity may alter the influence of mineral aerosol on global climate.
1 Introduction
On the regional scale, mineral dust has an impact on the vis-ibility, air quality, and human health. On the global scale, it can not only influence radiative transfer by absorption and scattering of solar radiation, but also affect the cloud for-mation and cloud optical properties. Thus, mineral aerosols influence the global climate ultimately by direct and indi-rect radiative forcing. During long range transport, mineral aerosols can undergo various heterogeneous reactions and their deposition has an impact on the ocean ecosystem and the overall biogeochemical cycling. CaCO3 is a common
component of mineral dust, especially in East Asia and is generally regarded as the most reactive component in min-eral particles (Krueger et al., 2003; Laskin et al., 2005; Sul-livan et al., 2007; Usher et al., 2003). It is present at sig-nificant concentrations in both mineral aerosols (Okada et al., 2005; Zhang et al., 2003) and in surface soils (at least 5–10% by mass) of most of the major global dust sources (Claquin et al., 1999). It was found that CaCO3 is among
the few “volatile” components in mineral aerosols which can undergo heterogeneous reactions with atmospheric trace acids to form CO2(Krueger et al., 2003; Laskin et al., 2005,
Santschi and Rossi, 2006). Many researchers have investi-gated the heterogeneous reactions of CaCO3 as a surrogate
for mineral dust and its impact on the physiochemical prop-erties of mineral particles (Krueger et al., 2003; Liu et al., 2008a, b; Gibson et al., 2006). To study the physiochemical properties of mineral aerosols, the generation of surrogates of mineral aerosol components is often helpful. At present, there are two main methods to generate CaCO3aerosols, dry
dispersion of solid powders (Sullivan et al., 2009a, b; Prince et al., 2007) and atomizing aqueous suspension of CaCO3
powder (Gibson et al., 2006, 2007). Both methods are not easy to handle and it is difficult to generate a stable output of proper size and sufficient mass concentration. Moreover, it was observed by several groups that mineral particles gen-erated by spray-drying of suspension are more hygroscopic than those from dry beds (Herich et al., 2009, Koehler et al., 2007, 2009, Sullivan et al., 2010). Sullivan et al. (2010) re-ported that for sub-100nm, wet-generated CaCO3 particles
the hygroscopicity parameterκ is 100 times larger than that from the dry bed generated CaCO3particles.
Compared to the method of dry dispersion of solid pow-ders, generating aerosol by atomizing solutions does not need complex instrumentation and is easier to operate and control. However, most of the mineral dust components are charac-terized by very low solubility which makes atomization from solution difficult. Vlasenko et al. (2006) have used atom-ization of a saturated solution of CaCO3to produce CaCO3
aerosol. However due to the low solubility of CaCO3in
wa-ter, the number concentration of the obtained aerosol is of-ten not high enough and the size distribution has its maxi-mum at too small diameters considering the need of studies of physiochemical properties, such as hygroscopicity using HTDMA and CCN activation.
In order to study chemical reactions on CaCO3 particles
and to determine microphysical properties of the processed aerosols it would be advantageous to have at disposal an easy to handle and reproducible method for generation of CaCO3aerosol with sufficiently high particle concentration
at proper size. Here we describe a novel method to generate CaCO3 aerosol by atomization of solutions with enhanced
amounts of dissolved Ca(HCO3)2. The basic idea is to make
use of the equilibrium of CaCO3and the water-soluble form
Ca(HCO3)2 in the presence of CO2 (Reaction R1). This
equilibrium is ubiquitous in natural waters when dissolved CO2is in contact with rocks containing CaCO3. The process
of dissolution of CaCO3 leads e.g. to the formation of
sta-lactites, stalagmites, columns, and other speleothems within caves when CO2in the water is lost and CaCO3sediment is
produced (Fairchild et al., 2006; Murray, 1954).
CaCO3(s)+CO2+H2O⇄Ca(HCO3)2(aq) (R1)
At high CO2concentrations (R1) will proceed in the forward
direction and cause the dissolution of the solid CaCO3. On
the other hand, when CO2is decreasing, the backward
reac-tion will produce solid CaCO3. In this study, pure CO2was
bubbled into a slurry of CaCO3powder in order to promote
the dissolution of CaCO3and formation of a Ca(HCO3)2
so-lution.
We will show in the following that atomizing Ca(HCO3)2
solutions, drying and annealing of the aerosol promote CaCO3 formation. The aerosols produced were
character-ized by Scanning Mobility Particle Sizing, Aerosol Mass Spectrometry, and Transmission Electron Microscopy in or-der to investigate the size distribution, typical concentra-tions, chemical composition and morphology of the aerosol. At the same time, the aerosols before und after annealing were characterized with respect to their hygroscopicity and cloud condensation activity (CCN) activity using a Hygro-scopicity Tandem Differential Mobility Analyzer (HTDMA) and a Cloud Condensation Nuclei Counter (CCNC). Here we took advantage of the different solubilities of CaCO3
(0.00015 mol/l) and Ca(HCO3)2(0.008 mol/l) at room
tem-perature (Gmelin, 1961).
To our best knowledge this method of generating CaCO3
aerosols from a CO2containing solution of Ca(HCO3)2has
not been described before. Moreover, not much attention has been paid to the possible importance of Ca(HCO3)2 which
could be formed in the atmosphere in cloud droplets of acti-vated mineral dust containing CaCO3by reaction with CO2
and H2O.
2 Experimental
2.1 Preparation of Ca(HCO3)2solution
Ca(HCO3)2 solutions were prepared at room
tempera-ture (∼22◦C) by bubbling CO2 (Praxair Industriegase
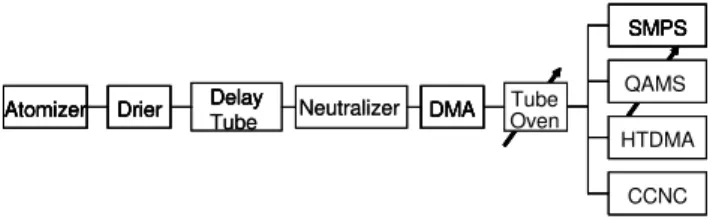
Delay
Atomizer Drier Oven
AMS SMPS
DMA
HTDMA
CCNC Neutralizer
Delay Tube
Atomizer Drier Tube
Oven
QAMS SMPS
DMA
HTDMA
CCNC Delay
Atomizer Drier Oven
AMS SMPS
DMA
HTDMA
CCNC Neutralizer
Delay Tube
Atomizer Drier Tube
Oven
QAMS SMPS
DMA
HTDMA
CCNC
Fig. 1.Schematics of experimental set up (details see text).
20 mbar from the cylinder into 1 L of water (Milli-Q, 18.2 Mcm, TOC<5 ppb) containing 2 g CaCO3 powder
(pro analysis, ≥99%, Merck). During CO2 bubbling the
slurry was stirred using a magnetic stirrer to promote the sus-pension of solid CaCO3 in the water. After bubbling, the
slurry was allowed to settle for 5 min and the supernatant clear Ca(HCO3)2solution was decanted.
In order to characterize the reproducibility of the method and the stability of the solution for aerosol generation, dif-ferent CO2 bubbling durations were applied and the
solu-tions were atomized over longer periods. The aerosol was dried and the number density and the count median of the size distribution were determined. It was found that stirring the slurry helped to reach the equilibrium faster.
In order to avoid introducing possible contaminants to the aerosol, careful measures in preparing solutions and subse-quent spraying were taken into account. This included using high purity agents, gas, water and careful cleaning of bottles, tubes and atomizer to our best effort.
2.2 Generation of CaCO3particles
The Ca(HCO3)2solution was sprayed by a constant output
atomizer (TSI, Model 3076) using synthetic air (Linde LiPur 6.0, purity 99.9999%). The generated aerosol passed through a diffusion drying tube filled with silica gel (final RH<5%) and a delay tube to equilibrate charges (Dinar et al., 2006), as shown in Fig. 1. The number size distribution of the resulting aerosol was measured by an SMPS system (TSI, DMA 3071, CPC 3022A).
At room temperature Ca(HCO3)2 should be
thermody-namically unstable as a solid and only exist in solution as Ca2+ and HCO−3 (Keiser and Leavitt, 1908; Miller, 1952; House, 1981). Upon drying, it is supposed to convert to CaCO3 very easily at room temperature. However, as
shown in the following, the aerosols generated from spraying Ca(HCO3)2solutions still contained a significant amount of
Ca(HCO3)2after drying. We therefore used a tube furnace at
300◦C in order to promote the transformation of Ca(HCO3)2
to CaCO3aerosol. The temperature of the tube furnace was
set to 300◦C because at this temperature Ca(HCO3)2should already decompose to form CaCO3 (Reaction R2) while
CaCO3is still stable (Keiser and Leavitt, 1908; Sanders and
Gallagher, 2002).
Ca(HCO3)2(s)→CaCO3(s)+CO2+H2O (R2)
The whole setup as used is shown in Fig. 1. After the de-lay tube the aerosol was neutralized (TSI, 3077) and size selected by a DMA (TSI, DMA 3071). The size-selected aerosol passed the tube furnace which was either at room temperature or set to 300◦C. After the furnace the aerosol flow was split and directed to the different instruments. A Quadrupole Aerosol Mass Spectrometer (Q-AMS, Aerodyne Research Inc., Jayne et al., 2000) was used to characterize the composition of aerosols. HTDMA and CCNC (Droplet Measurement Technologies, DMT-100) were used to investi-gate the hygroscopicity and CCN activity.
2.3 Characterization of chemical composition and morphology of the aerosol
Chemical characterization of the aerosols was provided by the Q-AMS by measuring H2O and CO2evaporating off the
particles. In the Q-AMS a focused particle beam is generated by an aerodynamic lens. This beam impacts on the heated surface of a vaporizer which is located in the ionization re-gion of a Quadrupole Mass Spectrometer. The ionization of the vapor is achieved by electron impact ionization with electrons of 70 eV. The Q-AMS is routinely operated in two alternating modes. In the so called MS-mode, the size in-tegrated particle composition is measured. In the so called pToF-mode (particle time of flight mode), the size resolved composition is observed for a set of selected mass to charge ratios (m/z). From the combination of the MS-mode and the pToF-mode data, which were measured alternating with 5 min time resolution, the size dependent chemical composi-tion over the accessible particle size range is retrieved. De-tails of the mode of operation of the Q-AMS are described in Jayne et al. (2000).
Water, mainly detected on them/z18 (H2O+), and CO2,
mainly detected atm/z44 (CO+2), served to determine the bi-carbonate and bi-carbonate content. Water and CO2were
quan-tified from the MS spectra as described in Allan et al. (2004). The relative ionization efficiency (RIE) of CO2 was set to
1.4, for H2O we applied an RIE of 2 which was recently
de-termined by Mensah et al. (2010). Blank measurements with a HEPA filter in line were conducted before each experiment and them/z18 andm/z44 were lower than 0.3 µg m−3and 0.04 µg m−3, respectively. During experiments the value of m/z18 andm/z44 for the aerosols was up to tens of µg m−3. The detection and discrimination of Ca(HCO3)2 and CaCO3by the Q-AMS was accomplished by tuning the
tem-perature of the vaporizer to 300◦C or 900◦C according to the thermal properties of Ca(HCO3)2and CaCO3. When the
temperature of the vaporizer was set to 300◦C, Ca(HCO3)2
in the aerosol decomposed at the vaporizer according to (Re-action R2) and was detected in the form of CO2 and H2O.
When the temperature of the vaporizer was set to 900◦C, both Ca(HCO3)2and CaCO3are decomposed Reactions (R3,
H2O per formula unit, whereas CaCO3is supposed to
evap-orate only one CO2per formula unit.
Ca(HCO3)2(s)→CaO(s)+2CO2+H2O (R3)
CaCO3(s)→CaO(s)+CO2 (R4)
By interplay of the annealing temperature of the tube fur-nace and the temperature of the vaporizer of the Q-AMS the content of CaCO3 and Ca(HCO3)2 in the aerosol was
de-termined according to Reactions (R2–R4). (Defactowe by-passed the tube furnace for the measurements at room tem-perature, i.e. we measured before and after annealing in the tube furnace.). Because of the gas-phase suppression factor of 107of the Q-AMS, the contribution of H2O(g) and CO2(g)
evaporating from Ca(HCO3)2in the furnace onm/z18 and m/z44 is negligible.
The particle mass distribution as function of the vacuum aerodynamic diameter was observed in the pToF mode of the Q-AMS. By comparing the modal positions of this particle mass distribution and of the particle volume size distribution calculated from the number size distribution measured by the SMPS, the effective particle density was obtained (DeCarlo et al., 2004).
In order to get information about the morphology of the particles, aerosol was sampled before and after annealing on a copper grid using a home-built aerosol sampling device (Marquardt et al., 1992) and characterized by Transmission Electron Microscopy (TEM). In the sampling device, a high voltage was applied and aerosol particles were deposited in the electric field onto the copper grid which was positioned in the centre of the gas flow.
2.4 HTDMA operation
The hygroscopic growth of the particles was measured with a home built HTDMA (Buchholz, 2007). With the first DMA (TSI 3071) particles were selected from the dried polydis-perse aerosol with an electromobility diameter of 150 nm. The second DMA (TSI Model 3071) was operated in a scan mode and the particles were detected by a condensation par-ticle counter (TSI CPC 3022A). Both DMA were operated with 0.3 lpm aerosol sample flow and 3 lpm sheath air flow.
The size selected aerosol and the sheath air of the second DMA were humidified at a temperature of 27◦C to almost the same relative humidity (RH) with the sheath air being at slightly higher RH. The second DMA is placed in an insu-lated box and cooled to 20◦C. Before entering the second DMA both aerosol and sheath air were cooled down to the same temperature and thus the RH increased to its final value. The particles remained for approximately 20 s in contact with the final humidity before they enter the SMPS which was op-erated with sheath air of the same humidity. To determine the RH inside the second DMA the absolute humidity was cal-culated from RH and T data of two Vaisala HMP235 sensors
before and after the insulated area. In addition the tempera-tures of the air flows inside the insulated area were measured with PT100 sensors directly before or after they entered or left the DMA. For calibration ammonium sulfate aerosol was used.
2.5 CCN operation and evaluation
To determine the CCN activity, the polydisperse aerosol was size selected by scanning a DMA between 10 and 450 nm. For each size bin the total number of particles (CN) was detected with an ultrafine water CPC (UWCPC, TSI 3786) and the number of activated particles (CCN) at different su-persaturations (SS) was measured in parallel with a continu-ous flow CCNC (Droplet Measurement Technologies, DMT-100). The ratio of CCN to CN is called activated frac-tion. Since a DMA selects electromobility diameters, mul-tiple charged particles with accordingly larger diameters en-tered the CCN counter, too. The fraction of these particles contributes to activation at the small diameters. For a correct interpretation of activation diameters the fraction of multi-ple charged particles was calculated according to a natural charge distribution (Wiedensohler, 1988). The activated frac-tion was then determined for each charge class separately and an error function was fitted to the data. The dry activation di-ameter (or critical dry didi-ameter,Dcrit)is the turning point of this distribution.
For each SS at least three scans were performed and the resultingDcritwere averaged. For calibrationDcritof ammo-nium sulfate was measured for five different SS.
2.6 Aerosol chamber experiments
The long term behavior of the carbonate aerosols was studied in the J¨ulich Large Aerosol Chamber (Mentel et al., 1996). Before any experiment with Ca(HCO3)2/CaCO3 we
deter-mined the background concentration of HNO3in the
cham-ber by sampling a continuous air stream of 1 lpm through a stripping solution (1% CaCl2w/w) in a washing bottle. The
stripping solution was backed-up by a second washing bottle with the same solution. The nitrate content of the stripping and the backup solution were analyzed by ion chromatogra-phy. The background HNO3concentration was estimated to
be 1.1±0.5 ppb at a RH of 30%.
In order to generate the aerosols the solution containing Ca(HCO3)2 was prepared as described above and sprayed by ten two-fluid nozzles against the walls of a small pre-chamber to impact larger droplets (Wahner et al., 1998). The generation air stream of 140 lpm served to flush the submi-cron portion of the Ca(HCO3)2(aq) into the large chamber.
10x104
8
6
4
2
0
N
u
m
b
er
C
o
ncen
tr
at
ion
[
c
m
-3 ]
10 2 3 4 5 6 7 8 9100 2 3 4 5 6 7 8 91000
Diameter [nm]
Fig. 2. Typical dry size distribution of aerosols generated by at-omizing the Ca(HCO3)2solutions with a TSI3076 constant output
nebulizer. The aerosols were dried to RH<5% in a diffusion drier using Silica gel as desiccant.
We performed three types of experiments. In the first experiment the large aerosol chamber was flushed for sev-eral hours with dry synthetic air (Linde LiPur 6.0, pu-rity 99.9999%) without CO2 (final RH<3%) and only the
aerosol was added in one step. The experiment lasted 36 h and was repeated once wherein the aerosol was monitored for 24 h. In the second experiment the chamber was flushed with particle free outside air leading to a RH of 40%. The outside air contained about 400 ppm CO2. The aerosol was
added to the chamber in two steps with 3 h in between. In the third experiment the chamber was flushed with dry synthetic air without CO2, but then humidified by evaporating water
(MilliQ) to approximately 40% RH. Initially 370 ppb NO, 100 ppb NO2, and 370 ppb O3 were filled into the chamber
and after 2 h the aerosol was added. In all cases we measured the size distribution, CCN activation, hygroscopic growth, and the ratio Ca(HCO3)2/CaCO3.
3 Results and discussions
3.1 Size distribution and stability of aerosol generation
Different CO2bubbling durations were applied at room
tem-perature to determine the time required for formation of suf-ficient Ca(HCO3)2 and for the dissolving process to reach
equilibrium. For this, the total number concentrationNtot
of the dried aerosol generated from the respective solutions served as a measure.Ntotincreased fast with increasing
bub-bling duration but leveled off after>2 h of bubbling. After 1 h of CO2 treatment the aerosol number concentration has
reached 80% of the maximum concentration.
To ensure equilibrium, CO2 was bubbled through the
stirred, aqueous CaCO3 suspension for 3 h to prepare the
Ca(HCO3)2solutions. A typical size distribution of aerosol
4.0x10⁶
3.0
2.0
1.0
0
Tota
l Conc
entr
ati
on [cm
-3 ]
140 120 100 80 60 40 20 0
Time [min.]
120
100
80
60
40
20
0
Me
an Si
ze [nm]
Fig. 3.Change with spraying time of the total number concentration (blue, left axis) and the mean size (red, right axis) of dry aerosols generated by atomizing Ca(HCO3)2solution.
generated from Ca(HCO3)2solution is shown in Fig. 2. The
number concentration peaked at∼120 nm with a geometric standard deviation of∼1.8.
The stability of the solution was tested by continuous spraying of the same solution over a longer period. Ntotand the count median diameter of the number size distribution served as a measure of stability (Fig. 3). First the number concentration of the aerosol decreased with spraying time and then leveled off after 100 min. Meanwhile, the median size of aerosol decreased gradually from 120 nm to∼80 nm over 2 h. During spraying of the solution a white deposit was formed in the storage bottle and the connecting tubes. This can be explained, since the solution was sprayed with syn-thetic air, free of CO2. The solution lost excess CO2 and
solid CaCO3was formed. As CaCO3deposits from the
solu-tion, the concentration of Ca(HCO3)2aerosol was decreased
resulting in a decrease of both the number concentration and median size of the particles.
3.2 Particle density and morphology
The particles were size selected at an electromobility diam-eter of 150 nm (Fig. 4). The peaks at 150 nm, 233 nm, and 300 nm corresponded to the single, double and triple charged particles. After passing the tube furnace at 300◦C, the size of the particles decreased to 138 nm, 216 nm, and 279 nm, respectively.
A corresponding decrease of the vacuum aerodynamic size was observed in the pToF mode of the Q-AMS as can be recognized in Fig. 5. From the mode positions of the mass size distribution (Dmax va)measured by Q-AMS and of the
volume size distribution (Dmax em)derived from the SMPS
data, an effective density (ρeff)was obtained according to
ρeff=
Dmax va Dmax em
Fig. 4. Size distribution of neutralized, dry particles, electro-mobility selected at 150 nm,before(blue) andafter (red) anneal-ing at 300◦C in the tube furnace. The particles were generated by atomizing a Ca(HCO3)2solution.
The respectiveρeffwere 1.83±0.1 g/cm3before the furnace and 1.79±0.1 g/cm3after the furnace, thus the same within the errors. The effective density of the generated aerosol is lower than the bulk density of calcite or aragonite of 2.71 and 2.83 g/cm3, respectively, which implies that it is not compact crystalline CaCO3.
TEM was used to obtain images of the particles as shown in Fig. 6. Aerosol particles generated from the Ca(HCO3)2
solution were spherical with a heterogeneous distribution of round structures, some of which look like hollow pits on the surface or spherical structures inside. After annealing in the furnace, these round structures became much finer and evenly distributed on the surface implying that the particles restructured during the annealing process.
3.3 Particle chemical composition
The composition of the aerosols was retrieved from the Q-AMS data. Remember, that we alternated the combination of two heated devices: the tubefurnaceat 300◦to anneal the aerosols before the Q-AMS measurement and thevaporizer of the Q-AMS to flash-evaporate the particles for detection. (We will strictly use these notationsfurnaceandvaporizer in the following.) We compared the following four combina-tions (see also Table 1): Q-AMS vaporizer at 300◦C probing before(case 1) andafter(case 2) tube furnace at 300◦C, Q-AMS vaporizer at 900◦C probingbefore(case 3) andafter (case 4) the tube furnace at 300◦C.
The Q-AMS data were converted from mass to mole num-bers and normalized to the Ca content retrieved from the respective SMPS data as follows. To get the aerosol mass concentrations, the volume size distributions were integrated from 60 nm–700 nm and multiplied withρeff. Dividing by
the molecular weights of Ca(HCO3)2and CaCO3gives the
number of moles of the salts thus of Ca per unit volume of
120
100
80
60
40
20
0
dM
/dlog(D
va
) [µ
g/m
3 ]
6 7 8 9
100
2 3 4 5 6 7 8 9
1000
2
Vacuum Aerodynamic Diameter Dva [nm]
Fig. 5. Mass size distributions derived from the CO+2 signal in the pToF mode of the Q-AMS. Blue: aerosol before annealing, AMS vaporizer at 300◦C (case 1), black: aerosolafter annealingat 300◦C, Q-AMS vaporizer at 300◦C (case 2), green: aerosolbefore annealing, Q-AMS vaporizer 900◦C (case 3), , red: aerosolafter annealingat 300◦C, Q-AMS vaporizer 900◦C (case 4).
Fig. 6. TEM images of aerosol particles before(a)and after(b) annealing at 300◦C in the tube furnace. The aerosol particles were generated by atomizing the Ca(HCO3)2solutions and dried before deposition on the TEM grids.
Table 1.Species detected at different temperaturesT of tube furnace and Q-AMS vaporizer
Case No. Tfurnace Tvaporizer Species detected nCO2 nH2O 1 22◦C 300◦C Ca(HCO3)2before furnace x x+z
(bypass) (R2)
2 300◦C 300◦C Ca(HCO3)2after furnace no no
(R2)
3 22◦C 900◦C Ca(HCO3)2+CaCO3before 2x+y x+z
(bypass) furnace (R3, R4)
4 300◦C 900◦C Ca(HCO3)2+ CaCO3after x+y no
furnace(R3, R4)
nCO2andnH2O: detectable mole numbers of CO2and H2O per formula unit ofxCa(HCO3)2·yCaCO3·zH2O
The molar ratios CO2/Ca, H2O/Ca based on
Q-AMS/SMPS and the molar ratio of H2O to CO2based on the
Q-AMS data only are shown in Fig. 7a, b and c, respectively. The error bar represents the standard deviation of repeated measurements. As mentioned above, at the Q-AMS vapor-izer temperature of 300◦C we expect to detect Ca(HCO3)2
by one CO2and one H2O by the Q-AMS, because of the
in-complete thermal decomposition (R2). At the vaporizer tem-perature of 900◦C thermal decomposition (R3) is complete and two CO2and one H2O should be detected. CaCO3is not
detected at 300◦C but at 900◦C where one CO2is formed.
For the aerosol before annealing significant amounts of CO2were detected at 300◦C Q-AMS vaporizer temperature
(case 1, Fig. 7a). The measured amount doubled when the vaporizer was turned to 900◦C (case 3, Fig. 7a). The de-tected amount of H2O was the same for both vaporizer
tem-peratures (Fig. 7b). The molar ratio of H2O to CO2 was
close to 1 at 300◦C and close to 0.5 for 900◦C, respectively (Fig. 7c). This means that before annealing the aerosol con-sisted of nearly pure Ca(HCO3)2with no additional water in
the particles and that all Ca(HCO3)2 was destroyed on the
vaporizer of the Q-AMS at 300◦C. Nevertheless, the ratios CO2/Ca and H2O/Ca in cases 1 and 3 are only half as large
as expected from stoichiometry indicating a reduced CE of the Q-AMS.
For particles that were annealed in the tube furnace to 300◦C neither CO2 nor H2O was detected at 300◦C
va-porizer temperature (case 2), because all thermally available CO2 and H2O were already driven out in the tube furnace
(Fig. 7a and b). This also means that after annealing in the furnace, the aerosol consisted of nearly pure CaCO3. In case
2 small values near the detection level were leading to the large errors bars in Fig. 7c. At 900◦ vaporizer temperature (case 4) we observed only a very small amount of H2O, but
a large signal of CO2(Fig. 7b and 7a).
If the particles consisted of pure Ca(HCO3)2 before
an-nealing and of pure CaCO3 thereafter, one CO2 is lost by
conversion of Ca(HCO3)2 to CaCO3 (Reaction R2) in the
tube furnace. Therefore we should observe for Q-AMS va-porizer temperatures of 900◦C only half of the CO2 after
annealing. However, comparing the cases 3 and 4 the CO2
signals before and after annealing have the same magnitude. This cannot be due to incomplete conversion of Ca(HCO3)2
to CaCO3 because only little water is observed in case 4.
Also large shape factor effects can be excluded since the particles kept their overall spherical shape after passing the furnace (Fig. 6). Theobserved as expected mole ratios of H2O/CO2in cases 1 and 3 (Fig. 7c) andthe observed as ex-pecteddoubling of the CO2amount going from case 1 to case
3 excludes simple effects of the different vaporizer tempera-tures.
The observed CO2/Ca ratios (Fig. 7a) and H2O/Ca ratios
(Fig. 7b) indicate that the CE of the Q-AMS must be dif-fered between the cases. The data are consistent with a CE of about 50% in cases 1 and 3 and near 100% in case 4. This is dissatisfying. Collection efficiencies for solid particles be-low 100% have been observed before. This is explained by solid particles bouncing off the vaporizer surface before full evaporation (Matthew et al., 2008). Note in Fig. 5 that our mass distributions were within the transmission window of 60–600 nm, and the little tailing at large diameters into the fall off range of the aerodynamic lens cannot cause effects of a factor of two. Unfortunately, we intrinsically cannot ob-serve a signal in case 2. This prevents testing if annealing of the particles at 300◦C and conversion from Ca(HCO3)2
to CaCO3 has led to higher CE. However, higher CE for
tempered solid particles compared to freshly dried particles seems to be somewhat anti-intuitive. We repeated the experi-ments with virtually the same results, i.e. enhanced CO2and
CE in case 4 is not a singular artifact. It remains unexplained for the moment, but adds only little uncertainty to our find-ings. All other evidence supported that we produced pure Ca(HCO3)2aerosol by spraying the solution and drying the
aerosol to RH<5% and that we were able to convert it to CaCO3by annealing it at 300◦C. Moreover, because of the
H2O/CO2stoichiometry in cases 1 and 3 (Fig. 7c) and the
ab-sence of excess water (Fig. 7b, c), we can rule out inclusions of aqueous phase and the formation of metastable CaCO3
(a)
(b)
(c)
Fig. 7. Mole numbers of CO2(nCO2,a), H2O (nH2O,b) detected at different temperatures of the Q-AMS vaporizer before and after annealing in the tube furnace. The mole numbers of CO2and H2O were derived by AMS and in (a) and (b) normalized to the Ca mole number (nCa)derived from SMPS measurements. The mole ratio
nH2O/nCO2 (c)is based on AMS data only. Error bars are the stan-dard deviations from repeated AMS measurements, respective the accordingly propagated errors in (c).
The general composition of the generated carbonate aerosols can be written as xCa(HCO3)2·yCaCO3·zH2O.
The combination of furnace temperature and the Q-AMS va-porizer temperature and the corresponding species detected are listed in Table 1. If the total calcium salt is normalized to unity, theny equals 1−x. The parametersx,y,zthen can be obtained from the Eqs. (2–7):
Table 2.Composition of aerosol before and after the furnace.
Tfurnace[◦C] x y z
Before furnace 22 1.05 −0.05 −0.032
After furnace 300 0.027 0.97 –
formula unit:xCa(HCO3)2·yCaCO3·zH2O
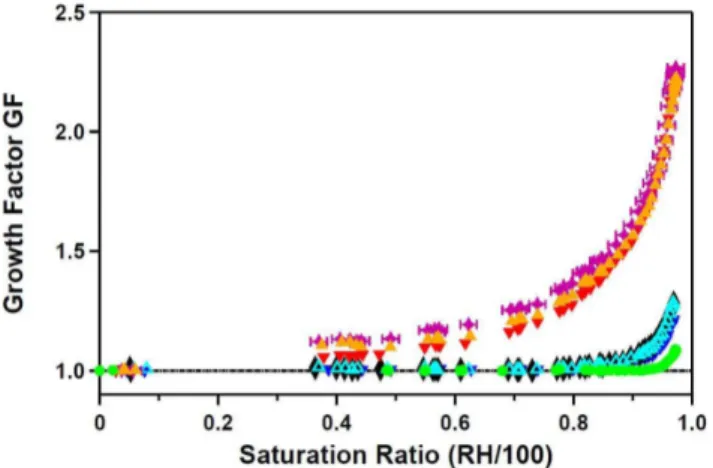
Fig. 8. Humidograms of calcium carbonate aerosols size selected at an electromobility diameter of 150 nm. CaCO3 (red dots),
Ca(HCO3)2 (blue triangles), Ca(HCO3)2 normalized to the min-imum diameter at RH 89.5% (black triangles), and Ca(HCO3)2
pre-conditioned at 100% RH and dried before size selection (green squares). Measurement errors: saturation ratio±0.014, GF±0.005.
nnCO2(900 ◦)
nnCO2(300 ◦)=
1+x
x (2)
r1=nnCO2(900 ◦)
nnCO2(300
◦) (3)
x= 1
r1−1
(4)
nnH2O(300 ◦)
nnCO2(300 ◦)=
x+z
x (5)
r2=nnH2O(300 ◦)
nnCO2(300
◦) (6)
z=(r2−1)·x (7)
HereinnnCO2(900
◦) is the mole number of CO
2in the aerosol normalizedto the aerosolmassconcentration before anneal-ing (22◦C) detected at 900◦C in the AMS andnnH2O(300
◦ ) andnnCO2 (300
◦
) are the mole numbers of H2O and CO2
normalized in the same way but detected at 300◦C in the AMS.
Table 3.Measured and calculated normalized massmn(CO2)andmn(H2O).
Case No TVAPORIZER measured calc. meas. measured calc. meas. mn(CO2) mn(CO2) /calc. mn(H2O) mn(H2O) /calc.
1 300◦C 0.146 0.272 0.53 0.056 0.111 0.51
before furnace
2 300◦C 0.012 0 – 0.001 0 –
after furnace
3 900◦C 0.280 0.543 0.52 0.059 0.111 0.54
before furnace
4 900◦C 0.446 0.440 1.01 0.005 0 –
after furnace
The measured mass concentrations of CO2and H2O were normalized to the aerosol mass concentration derived from SMPS volume and effective densityρeff. Calc. refers to the
compositions obtained in Table 2.
zero within the error limits (the value ofxshould be less than or equal to 1 andx, y,z should be positive) which means almost the whole particle consisted of Ca(HCO3)2. The ratio of z toxwas near zero indicating there is no additional water. In contrast, after the furnace, the particle consists of almost pure CaCO3 with very little Ca(HCO3)2 being left. This is
consistent with the analysis discussed above.
From the composition of the aerosol in Table 2, the mass concentration of CO2, H2O normalized to the aerosol mass
concentration were calculated as a theoretical value and com-pared with the measured value (Table 3). The ratio of mea-sured to calculated concentrations gives an estimate of CE supporting the above mentioned values of∼50% in cases 1 and 3 and of 100% in case 4.
Based on the analysis of the composition of the aerosol above, we will refer to the dried aerosol before annealing in the furnace as Ca(HCO3)2aerosol and to the aerosol after
an-nealing as CaCO3aerosol in the following. We hypothesize
that the Ca(HCO3)2particles were solid, although it is known that solid Ca(HCO3)2is thermodynamically instable at ambi-ent conditions. The CaCO3particles were pure solids within
the errors of the analysis but may have contained traces of Ca(HCO3).
3.4 Hygroscopicity of the aerosol
The humidograms of the laboratory generated aerosols are shown in Fig. 8. CaCO3(s) aerosol (red dots) took up only
very little water at very high RH and deliquescence was not observed up to RH of 97.4(±1.4)%. We calculated hy-groscopicity parameters κ according to the one parameter representation of the K¨ohler equation proposed by Petters and Kreidenweis (2007). By averagingκ in the range 97– 97.4% RH we obtained aκGFCO3of 0.0016±0.0004.
Dried Ca(HCO3)2aerosols (blue triangles) showed a
dif-ferent growth behavior. Up to RH of 71(±1.4)% the par-ticle diameter increased by 1%. Between 71% and 78% the growth factor (GF) decreased and reached a minimum
of 0.95 at RH 89.5(±1.4)%. Thereafter the particles grew continuously with increasing RH without showing a distinct deliquescence point. Condensation of small amounts of wa-ter (GF = 1.01 at 71% RH) obviously caused shrinking of the particles probably due to some water aided restructuring of the particles (compare the TEM image in Fig. 6a, which indi-cates inhomogeneities on or in the particles.). Shape effects can be excluded since the dried particles were already spher-ical.
To test the effect of wetting the dry Ca(HCO3)2
parti-cles, the aerosol was humidified to almost 100% and then dried againbefore entering the instruments. After the pre-conditioning (pc) the minimum in the growth curve dis-appeared and the particles did not grow until ca. 92% (Fig. 8, green squares). The uptake of water already oc-curred at lower RH and was higher than for CaCO3. No
distinct deliquescence point was observed. We calculatedκ
in the range 97–97.5%RH and obtained an averageκGFpcof 0.011±0.007 for the pre-conditioned Ca(HCO3)2aerosol.
When the growth curve of the non-conditioned (nc), dry Ca(HCO3)2 aerosol was shifted using the diameter of the
minimum at RH 89.5% as reference diameter (Fig. 8, black triangles), the high humidity branches at RH>93% for the particles with and without pre-conditioning agree within the errors, thus should have the same composition and morphol-ogy. We calculated an average κGFnc= 0.008±0.003 be-tween 97–97.5% RH for the non-conditioned Ca(HCO3)2
aerosol from the shifted humidogram. This is smaller than
κGFpcbut still agrees within the uncertainties.
The Q-AMS analysis showed that the pre-conditioned and then dried again particles consisted of ∼67% CaCO3 and
∼33% Ca(HCO3)2. The conditioning process can be
imag-ined as dissolving some bicarbonate in the water layer, where it decays and CO2evaporates. This is the same process as
oc-curring in weathering of carbonate rocks. In comparison to the pure CaCO3, the presence of Ca(HCO3)2 increased the
Table 4.Critical parameter of CCN activation observed in the lab-oratory study.
SScrit[%] CaCO3 Ca(HCO3)2 CaCO3/Ca(HCO3)2
Dcrit[nm] Dcrit[nm] (67%/33%)Dcrit[nm]
0.10 256 210
0.15 174 162
0.20 139 127
0.24 118 110
0.29 102 100
0.48 72 74
0.57 239 67
0.67 202 60
0.76 173 55
0.85 152
0.95 136 46 48
The moderate growth at RH<71 % of the non-conditioned, dried Ca(HCO3)2 particles and the restructur-ing supports our hypothesis that these particles were solid. It must be a metastable solid phase; the sudden evaporation of water in the drying process seems to hinder the formation of thermodynamically stable CaCO3. Also the pre-conditioned,
mixed particles did not show growth at RH<92% although they contained 33% Ca(HCO3)2. This indicates that these
mixed particles were also solid.
Ca(HCO3)2(s) seemed to become unstable at RH>71%
even on the short time scales of the HTDMA measure-ment. It is likely that with increasing humidity the com-position of the particles shifted towards∼67% CaCO3 and
∼33% Ca(HCO3)2, as indicated by the similarity ofκGFpc
andκGFnc. Because of this instability the hygroscopic growth
behavior of pure Ca(HCO3)2could not be determined.
How-ever, it should be much more hygroscopic than CaCO3(s) and
the CaCO3/Ca(HCO3)2(s) mixed salt as indicated by the GF
of 1.01 at RH 71% (see Fig. 8, blue triangles).
We can estimate κHCO3 for Ca(HCO3)2 under the
assumptions of constant composition of the mixed CaCO3/Ca(HCO3)2(s) aerosol over duration of the
suc-ceeding humidogram and a homogenous distribution of Ca(HCO3)2 and CaCO3 within the particles, thus equal
availability for the condensing water:
κGFpc=fCO3·κCO3+fHCO3·κHCO3
κHCO3=
κGFpc−fCO3·κCO3
fHCO3 (8)
Herein fx are the volume fractions of CaCO3 and
Ca(HCO3)2, respectively. For simplicity we assume that
CaCO3and Ca(HCO3)2feature the same density, in
agree-ment with the equalρeff of dried Ca(HCO3)2 and annealed
CaCO3 particles. Moreover, volume additivity (ideality) is
intrinsically assumed in theκ approach. Assuming the value of κGFCO3= 0.0016 is applicable to CaCO3, we obtained
κ κ
κ
κ κ
κ
κ κ
κ
Fig. 9. Critical supersaturation as function of the activated dry di-ameter: CaCO3(red dots), Ca(HCO3)2(s) (blue dots), and mixed
CaCO3/Ca(HCO3)2(s) (green dots). Red, blue and green solid lines
represent one parameter K¨ohler calculations assumingκ=0.0019, κ= 0.16 andκ= 0.14, respectively. For comparison results of Sul-livan et al. (2009b) are given for CaCO3(red open squares) with κ= 0.0011 (red dotted line) and Ca(NO3)2 (black open squares)
withκ= 0.051 (black dotted line). The shaded area comprises the range of expectation for activation of atmospheric mineral dust ac-cording to Koehler et al. (2009). The dashed lines are one parameter K¨ohler representations of their suggested medianκof 0.03 (black), Arizona Test Dust (κ= 0.025, blue) and Saharian Dust (κ= 0.054, brown) (Koehler et al., 2009). The red dashed line represents the av-erageκCO3 based on the combination of this study and of Sullivan et al. (2009b).
κHCO3= 0.030 from Eq. (8). If we apply κCO3= 0.0011± 0.0004 reported by Sullivan et al. (2009b), we yield only a little largerκHCO3= 0.031. However, κHCO3= 0.03 is
prob-ably only a lower limit, since our experiments in the dry Large Aerosol Chamber indicated the preferential formation of CaCO3(s) in the outer layer of the particles (see below). 3.5 CCN activity of aerosol
We determined the dry diameter of those particles which are activated at a given supersaturation (SS) with a CCN counter. We will call this the critical dry diameter (Dcrit)which is dif-ferent from another often used definition ofDcrit as diame-ter of the droplet at the maximum of the K¨ohler curve. The measuredDcrit are shown in Table 4 and in Fig. 9. CaCO3
particles (red filled squares) activated at significantly larger diameters than the Ca(HCO3)2(s) particles (blue dots) and
the CaCO3/Ca(HCO3)2(s) mixed particles (green dots).
TheDcritof our spray-dried-annealed CaCO3agreed well
with observations of Sullivan et al. (2009b), who measured CaCO3 aerosol generated by dispersing dry powder (open
red squares). The red solid line represents one parameter K¨ohler calculations with the average κCNNCO3 of 0.0019±
0.0007 for CaCO3 from this study. The values of κGFCO3
agree well within the error limits. Sullivan et al. (2009b) de-termined the corresponding averageκCO3= 0.0011±0.0004 (red dotted line). The results of our study feature systemat-ically largerκCO3, thus somewhat easier droplet activation. However, the average values of both studies agree within the error limits. The red dashed line in Fig. 9 represents the av-erageκCO3 based on the combination of results of this study and of Sullivan et al. (2009b).
Wet generated water-insoluble or mineral particles often exhibit a severely enhanced hygroscopicity and cloud droplet activation compared to dry generated particles (Herich et al., 2009; Koehler et al., 2007, 2009; Sullivan et al., 2010), which was suggested to be due to the soluble materials on min-eral particles introduced by atomizing aqueous suspensions. Impurities also have been suggested to be one explanation for inconsistencies among CCN measurements for adipic acid aerosols generated by atomization of aqueous solutions (Hings et al., 2008). Sullivan et al. (2010) reported aκof 0.1 for wet-dispersed CaCO3compared toκCO3= 0.0011 of dry-dispersed CaCO3aerosols. Considering this huge difference
of a factor of 100 inκ, the small difference within the errors between the CaCO3aerosol generated by our method and the
dry-dispersed method of Sullivan is negligible. Both results agree very well, although trace amounts of impurities may also be present in this study, either from the solution or im-ported with the mineral particle that is concentrated when the droplets dry. This indicates that impurity interference is not important in this study. Moreover, the impurity content in the particles was estimated roughly. To prepare the Ca(HCO3)2
solutions, 2 g of CaCO3with a purity of≥99% were added
to 1 L of Milli-Q-water (total organic carbon<5 ppb, total ion concentration<0.05 ppb), i.e. the maximum impurity in the solution is 0.002%. The number mean droplet diameter of the atomizer specified by the manufacturer is 350 nm for water, and the mean particle diameter after drying is 120 nm, therefore the concentrating factor is∼25. If the same den-sity is assumed for the impurity and CaCO3/Ca(HCO3)2, it
would account for a maximum of 0.05% of the particle mass. Therefore, we conclude that our CaCO3 aerosol is of
suffi-cient quality as required by hygroscopicity and CCN studies. To our best knowledge there are no studies of the CCN activation of Ca(HCO3)2 as it was always thought to be too unstable under ambient atmospheric conditions. We are confident that we delivered pure Ca(HCO3)2(s) parti-cles (non-conditioned, nc) and CaCO3/Ca(HCO3)2(s)
par-ticles (pre-conditioned, pc) to the CCN spectrometer. The pre-conditioning leading to the CaCO3/Ca(HCO3)2(s) mixed
salt did not cause large effects on the CCN activity at SS
>0.25% (compare blue and green dots in Fig. 9). Obviously, the presence of 33% Ca(HCO3)2(s) in the mixed particles
was sufficient to cause onset of CCN activation at almost the same critical parameters as in the pure Ca(HCO3)2(s)
parti-cles. The blue and the green solid lines are K¨ohler calcula-tions withκCCNpc= 0.14 andκCCNnc= 0.16. With exception
of one point at the lowest SS all data points fall on bothκ
-lines within their errors. In any case dried Ca(HCO3)2(s) and mixed CaCO3/Ca(HCO3)2(s) particles were a factor of
60–70 better CCN than CaCO3particles.
Both, κCCNpc= 0.14 and κCCNnc= 0.16 are much larger
than the correspondingκGFpc andκGFnc of 0.011 and 0.08.
This can be explained by the limited solubility of Ca(HCO3)2
described in the literature. The solubility of CaCO3 is
≈0.015 g/l = 1.5·10−4mol/l in a CO2free atmosphere at 25◦
(Gmelin 1961, p. 933). Raising the CO2pressure up to 1 bar
(e.g. by bubbling CO2to CaCO3slurry) increases the
solu-bility by a factor of 50 to about 0.008 mol/l (Gmelin 1961, p. 933). The additionally dissolved CaCO3 with
increas-ing CO2pressure exists as HCO−3 in the solutions (Gmelin
1961, p. 927). We approximate the saturation concentration of Ca(HCO3)2by about 0.01 mol/l at room temperature and the according saturation mole fraction by 0.01/(0.01+55.5) ≈0.0002. The corresponding saturation ratio for an ideal solution would be 0.9998. We thus estimate a deliques-cence humidity of Ca(HCO3)2 around 99% RH. This
esti-mate is reconcilable with our observations of minimal hy-groscopic growth for the mixed salt below 92%RH and the absence of deliquescence below 97.5%RH (Fig. 8, green squares). Ca(HCO3)2appears to be a non-hygroscopic salt
below 97.5%RH, because of its high deliquescence point, but a good CCN because of its still notable solubility.
Ca(HCO3)2is somewhat less CCN active than Ca(NO3)2
(black open squared symbols in Fig. 9, taken from Sullivan et al., 2009b), but it is a better CN than natural mineral dust samples. This is shown in Fig. 9 where the shaded area com-prises the range of expectation for CCN activation of atmo-spheric mineral dust and the black dashed line the medianκ
of 0.03 suggested by Koehler et al. (2009). In additionκ is given for Arizona Test Dust (κ= 0.025, blue dashed line) and Saharian Dust (κ= 0.054, brown dashed line) (Koehler et al., 2009).
Ca(HCO3)2 is the expected product of the reaction of
CaCO3with CO2and H2O, which have high concentrations
in the atmosphere. Thus, especially in cloud droplets of ac-tivated mineral dust some Ca(HCO3)2may be formed.
Sev-eral studies on the water soluble inorganic ions in aerosols conducted during ACE-Asia have suggested the co-existence of Ca and carbonate/bicarbonate based on the high correla-tion between Ca2+and the difference of total cations and an-ions (Maxwell-Meier et al., 2004; Song et al., 2005). Unfor-tunately, carbonate and bicarbonate were not measured and could not be differentiated in the particle-into-liquid sampler coupled to a dual-channel ion chromatograph (PILS-IC). The significant enhancement of CCN activity going from CaCO3
to Ca(HCO3)2 indicates that CaCO3 could become much
Table 5.Overview of the experiments in the Large Aerosol Chamber.
Type Duration RH Air supply CO2 NOY FinalκCCN
Dry 1 35 h <5% Synth. 6.0 no 1 ppb HNO3 0.07
Dry 2 23 h <5% Synth. 6.0 no 1 ppb HNO3 0.1 Humid 1 19 h 40% J¨ulich ambient yes 1 ppb HNO3 0.45
Humid 2 23 h 40% Synth. 6.0 no 370 ppb NO, 0.45 100 ppb NO2
370 ppb O3
200
150
100
50
0
A
c
ti
vat
e
d
D
ry D
iam
et
er
D
crit
[nm]
00:00 06:00 12:00 18:00 24:00 30:00 36:00
Time [h] second spraying
Fig. 10. Time series of activated dry diameters (Dcrit) of
cal-cium carbonate aerosols at 0.2% SS measured in the Large Aerosol Chamber filled with dry synthetic air (two experiments: red and black), with particle free outside air (containing CO2(g)) at∼40%
RH (blue) and synthetic air at RH∼40% and 470 ppb NOx(green),
dashed line:Dcrit(Ca(NO3)2)by Sullivan et al. (2009b), grey area:
Dcrit(Ca(HCO3)2from this study. Error bars are the standard
de-viation of each measurement interval.
3.6 Long term experiments in the Large J ¨ulich Aerosol Chamber
Ca(HCO3)2(aq) was introduced into the Large Aerosol Chamber and kept there for up to 36 h. CCN activation, hy-groscopic growth factors, and chemical composition by Q-AMS were monitored to capture the long time evolution of the carbonate aerosols under dry and humid conditions. Ta-ble 5 provides an overview of the experimental conditions.
The critical diameters Dcrit at 0.2% SS of the carbon-ate particles are shown in Fig. 10. In the two dry ex-periments Dcrit at 0.2% SS was 127 nm (κ ≈0.17)
di-rectly after generating the Ca(HCO3)2 aerosol, which is
about the expected value of κ≈0.15 for Ca(HCO3)2(s)
and CaCO3/Ca(HCO3)2(s) according to our laboratory scale
study above. Thus we assume that we formed some Ca(HCO3)2(s). During the first 3.5 h the activation diameter
increased to 150 nm at 0.2% SS (κ≈0.1) and stayed constant thereafter for the next 5 h. The results of the two
experi-ments differ in that the red curve approaches the final value of 150 nm at 0.2% SS within 2 h and stays constant there-after, whereas the black curve took somewhat longer to reach the same value. After 10 h the black curve started to rise again and reached values of 170 nm at 0.2% SS (κ≈0.07) within 6 h. We have no explanation for this different behav-ior, which is not related to changes of RH or T in the cham-ber. However, we can state that after 22 h/36 h the hygro-scopicity parametersκof 0.1/0.07 were smaller thanκ≈0.15 observed for the mixed CaCO3/Ca(HCO3)2(s) from the
lab-oratory study. Still, the chamber particles were much better CCN than pure CaCO3particles withκ= 0.0019±0.0007.
Since the tendency for droplet activation was lower than that of the mixed CaCO3/Ca(HCO3)2(s) one would expect
that the hygroscopic growth was also smaller. However, as is shown in Fig. 11 the aerosol from the chamber (blue trian-gles, black rhombs, and turquoise triangles) had significantly higher GF than the mixed CaCO3/Ca(HCO3)2(s) after
pre-conditioning (green dots). Still, at 95% RH the GF is only 1.165 which translates intoκ= 0.18.
The Q-AMS data showed that the aerosol in the dry cham-ber after 14 h contained ∼40% Ca(HCO3)2, whereas the
mixed CaCO3/Ca(HCO3)2(s) aerosol after pre-conditioning
contained only 33% bicarbonate. We detected some nitrate uptake of background HNO3, which was initially about 2%
of the CO+2 mass and increased slowly to about 4% of the CO+2 within 14 h. Therefore, besides residual Ca(HCO3)2,
also Ca(NO3)must have contributed to the GF and the CCN
activity of the particles after 14 h.
These observations can be rationalized by the following considerations. Upon spraying the Ca(HCO3)2solution and drying it by mixing with the dry air in the chamber primarily Ca(HCO3)2(s) aerosol was formed. Favored by the low RH and CO2free synthetic air in the chamber the particles lost
water and CO2over several hours and were slowly converted
to the thermodynamically stable CaCO3. However, even
af-ter 36 h the particles were much betaf-ter CCN (κof 0.1 or 0.07, respectively) than CaCO3(κ= 0.0019±0.0007). Therefore
a large portion of Ca(HCO3)2was still left in the particles.
This is supported by Q-AMS data that showed that after 14 h the Ca(HCO3)2 accounted still for ∼40% of the total
Fig. 11.Humidograms of calcium carbonate aerosols size selected at an electromobility diameter of 150 nm measured in the dry Large Aerosol Chamber (blue: after 1 h, black rhomb: after 16 h, turquoise open triangles: after 20 h). The same in the humidified chamber at 40%RH with 470 ppb NOxand 370 ppb O3 added (red triangles:
after 3 h, magenta rhombs: after 18 h, orange triangles: after 20 h). In case of the measurements after 20 h the aerosol was addition-ally dried before entering the HTDMA. For comparison the humi-dogram of calcium carbonate aerosolpre-conditioned with water from the laboratory study (green dots) is shown. Measurement er-rors: saturation ratio 0.014, GF 0.005 (shown exemplary for one data set).
instantaneously by the fresh aerosols. Due to the low HNO3
background and the residual 5% RH, we exclude the for-mation of significant amounts of surface adsorbed carbonic acid as observed by Al-Hosney and Grassian (2004) at much larger HNO3partial pressures. Thereafter nitrate increased
only slowly in the dry experiments and had obviously no or small influence since theDcritincreasedwith time. We
sug-gest that the surface of the particles reacted quickly accord-ing to (Reaction R2), protectaccord-ing the core of the particles from further conversion. Thus after the relatively fast initial rise the activation diameter increased only slowly. Such a surface to bulk kinetic constrain was suggested before by Vlasenko et al. (2009) for the reaction of nitric acid dust with Arizona Test Dust. Overall Ca(HCO3)2(s) existed much longer under
dry conditions and at room temperature than commonly ex-pected from its thermodynamic stability. Based on the signif-icant difference in CCN activity between Ca(HCO3)2(s) and
CaCO3(s), a longer existence of Ca(HCO3)2(s) could have
important implications for the influence of mineral aerosol on climate.
In the humid chamber (flushed with particle free out-side air)Dcrit at 0.2% SS reached 135 nm (κ= 0.14) within
the first 15 min (blue curve in Fig. 10) which agreed well with Ca(HCO3)2(s) from our laboratory study (see above).
Thereafter we observed a fast decrease of Dcrit. A
sec-ond addition of fresh aerosols induced the same behavior. After 20 h activation diameters of 92(±3) nm at 0.2% SS
60
50
40
30
20
10
0
CO
2
and NO
3
- Con
cent
rat
ion [
µ
g/m
3 ]
18:00 11.08.2009
00:00 12.08.2009
06:00 12:00
Time
120
100
80
60
40
20
0
Tot
al
Aer
o
sol
M
ass [
µ
g
/m
3
]
°
Fig. 12.Experiment in the humidified Large Aerosol Chamber with 470 ppb NOxadded. Time series of CO2(green, left axis), NO−3
(blue, left axis) mass concentrations measured at 900◦C Q-AMS vaporizer temperature and total aerosol mass concentration (black, right axis) calculated from SMPS volume assuming a density of 1.8 g cm−3. Light blue areas: AMS vaporizer at 300◦C. Yellow area: the aerosol was dried with a silica gel diffusion drier before entering the Q-AMS.
(κ= 0.45) were reached which were only slightly higher than the 87.5(±3) nm for pure Ca(NO3)2 (κ= 0.5) according to
Sullivan et al. (2009b) (black dashed line in Fig. 10). In the second humid experiment NO, NO2 and O3were
added on purpose to the aerosols. In this mixture HNO3
was formed by heterogeneous reaction of NO2 and N2O5
on the particle surfaces and on the chamber walls. The alkaline Ca(HCO3)2 then obviously reacted with NO2 and
HNO3to Ca(NO3)2. Dcritshowed the same fast decay and
approached the Ca(NO3)2values as described above (green curve in Fig. 10).
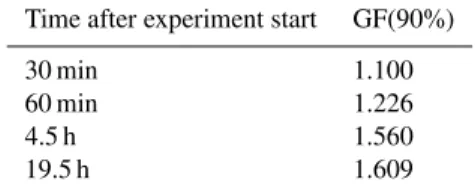
Also the GF at 90% RH increased rapidly with time and then levelled off (Table 6). The water uptake represented as growth curves (Fig. 11, red and orange) was significantly lower than the water uptake measured for pure Ca(NO3)2by
Gibson et al. (2006), who find a GF already of 1.77 at 85% RH.
In both humid experiments increasing nitrate was detected at m/z= 30 and m/z= 46 by the Q-AMS, which replaced HCO−3. This is demonstrated in Fig. 12 for the experi-ment with NO, NO2, and O3addition. However, even after
23 h, still nominal 6% (mole) Ca(HCO3)2and 30% CaCO3
can be detected by switching the vaporizer temperature of the AMS between 900◦C and 300◦C. Together the carbon-ate (including bicarboncarbon-ate) contributed about∼36% of to-tal calcium salt. Ca(NO3)2 was determined to account for
Table 6.Growth factors at 90% RH, experiment Humid 2.
Time after experiment start GF(90%)
30 min 1.100
60 min 1.226
4.5 h 1.560
19.5 h 1.609
These observations demonstrated that a substantial het-erogeneous conversion into the more soluble Ca(NO3)2
oc-curred. We suggest that in early stages of the experiment this took only place on the surface of the particles. But since the nitrate is much more hygroscopic and much better soluble than both, carbonate and bicarbonate, the particles took up water forming a concentrated solution on the surface (Krueger et al., 2003). This further increased the uptake of HNO3which is larger on wet particles (Liu et al., 2008a) and
also dissolved the upper layers of carbonate. The conver-sion of Ca(HCO3)2 to Ca(NO3)2thus was accelerated and the reaction of bicarbonate to carbonate was promoted as no protective layer of CaCO3(s) could be formed as suggested
for the dry chamber case. Carbonate/bicarbonate decreased as the reaction proceeded but were not completely depleted over the time period of the chamber experiment. Therefore the hygroscopic growth was lower than that of pure nitrate. Theκ= 0.45 for droplet activation of chamber particles at the final stages was only 10% less than that of pure Ca(NO3)2as
the reaction to nitrate was much faster than that conversion to carbonate.
4 Conclusions
In this study, a novel, easy to operate method was devel-oped using atomization of a Ca(HCO3)2solution to produce CaCO3aerosol, one of the most reactive components in
min-eral aerosol. In this procedure CO2 was bubbled through
a slurry of CaCO3dissolving it as bicarbonate. The
super-natant solution was decanted, sprayed with an atomizer and dried. Annealing the aerosol in a tube furnace at 300◦C pro-moted the conversion back to CaCO3.
Q-AMS measurements confirmed that the particles af-ter annealing consisted of pure CaCO3. By hygroscopic
growth measurements we derived a hygroscopicity param-eterκ(97%RH) of 0.0016±0.0004 for the CaCO3particles,
which agreed with the κ of 0.0019±0.0007 obtained by measurements of CCN activation. The κ from both meth-ods agree very well within the errors and with the κ of 0.0011±0.0004 reported by Sullivan et al. (2009b) for dry-dispersed CaCO3powder. The new method is suited to
gen-erate CaCO3 aerosol of sufficiently high concentration and
proper size for studies of hygroscopicity, CCN activity and aerosol chemistry studies in simulation chambers.
Q-AMS measurements further confirmed that the parti-cles obtained by spraying Ca(HCO3)2 solutions and
dry-ing the aerosol to RH<5% consisted of pure Ca(HCO3)2.
This finding could be highly interesting as we have indica-tion that these particles were solid, although Ca(HCO3)2(s)
is thermodynamically unstable under ambient conditions. TEM showed that the Ca(HCO3)2particles were solid and
spherical like the CaCO3particles, with Ca(HCO3)2(s)
par-ticles having some internal structures, bubbles or hollow pits. Since in the Q-AMS study pure Ca(HCO3)2 was ob-served without excess water, we can rule out inclusions of Ca(HCO3)2solution or the formation of metastable hydrates. In addition, in HTDMA measurements Ca(HCO3)2(s) fea-tured restructuring at 71% RH, which should not be observed in case of liquid particles. Processing the Ca(HCO3)2(s)
par-ticles at 100% RH and drying it again to<5% RH produced mixed CaCO3)2/Ca(HCO3)2(s) particles. These mixed
par-ticles must have been solid too, since they did not show no-ticeable hygroscopic growth below 92% RH and GF at 95% was only 1.03. The mixed particles and pure Ca(HCO3)2(s)
were much better CCN (κ=0.15±0.02) than pure CaCO3
(κ=0.0019±0.0007). The difference in CCN activation and hygroscopic growth can be deduced to the limited solubil-ity of Ca(HCO3)2(s) and a deliquescence point larger than 97.5% RH, which was not assessable by our HTDMA. We therefore hypothesize that we have observed a new, solid phase of Ca(HCO3)2(s). This must have been a metastable phase and the formation of CaCO3according the back
Reac-tion (R1) may be hindered when water of the soluReac-tion evap-orates rapidly in the diffusion dryer.
In the dry Large Aerosol Chamber Ca(HCO3)2(s) was
converted over hours to a mixed salt containing ≈40% Ca(HCO3)2(s) and≈60% CaCO3. The uptake of HNO3was
slow, probably due to a similar kinetic hindrance suggested before on the solid Arizona Test Dust particles (Vlasenko et al., 2009). In the dry chamber Ca(HCO3)2(s) could
proba-bly only persist, because it was protected by a CaCO3
coat-ing. Ca(HCO3)2(s) was shorter lived at 40% RH in ambient J¨ulich air in the presence of HNO3(≈1 ppb) as well as in
syn-thetic air in presence of several hundred ppb NOxand O3. In
the latter case, carbonate contributed still about∼36% (in-cluding 6% bicarbonate) after about one day and nitrate ac-counted for∼64% (molar content) of the total calcium salt.
The chamber experiments showed that Ca(HCO3)2can ex-ist longer under atmospheric conditions than conventionally expected from its thermodynamic stability, especially under dry conditions. In the atmosphere Ca(HCO3)2can be formed
through the reaction of CaCO3with CO2and H2O, in
partic-ular in cloud droplets of activated mineral. A significant in-crease of CCN activity in going from CaCO3to Ca(HCO3)2
areas where competing heterogeneous reactions with pollu-tant trace gases are missing. Ca(HCO3)2may be present in
the atmosphere for longer times, and likely is faster converted into water soluble salts (e.g. nitrates) than CaCO3.
Acknowledgements. The authors thank the support of the Junior Scientist Exchange Program between the China Scholarship Council and the Helmholtz Association of German Research Centers. We thank both reviewers for the constructive comments which helped to improve the manuscript.
Edited by: M. Ammann
References
Al-Hosney, H. A. and Grassian, V. H.: Carbonic acid: An impor-tant intermediate in the surface chemistry of calcium carbonate, J. Am. Chem. Soc., 126, 8068–8069, doi:10.1021/ja0490774, 2004.
Allan, J. D., Delia, A. E., Coe, H., Bower, K. N., Alfarra, M. R., Jimenez, J. L., Middlebrook, A. M., Drewnick, F., Onasch, T. B., Canagaratna, M. R., Jayne, J. T., and Worsnop, D. R.: A gen-eralised method for the extraction of chemically resolved mass spectra from aerodyne aerosol mass spectrometer data, J. Aerosol Sci., 35, 909–922, 2004.
Brecevic, L. and Kralj, D.: On calcium carbonates: from funda-mental research to application, Croat. Chem. Acta, 80, 467–484, 2007.
Buchholz, A.: Entwicklung eines Ger¨ats zur Untersuchung des hy-groskopischen Wachstums von organischen Aerosolen, Diploma Thesis, Department of Chemistry, University of Cologne, Cologne, 2007.
Claquin, T., Schulz, M., and Balkanski, Y. J.: Modeling the mineral-ogy of atmospheric dust sources, J. Geophys. Res., 104, 22243– 22256, 1999.
DeCarlo, P. F., Slowik, J. G., Worsnop, D. R., Davidovits, P., and Jimenez, J. L.: Particle morphology and density characterization by combined mobility and aerodynamic diameter measurements. Part 1: Theory, Aerosol Sci. Technol., 38, 1185–1205, 2004. Dinar, E., Mentel, T. F., and Rudich, Y.: The density of humic acids
and humic like substances (HULIS) from fresh and aged wood burning and pollution aerosol particles, Atmos. Chem. Phys., 6, 5213–5224, doi:10.5194/acp-6-5213-2006, 2006.
Fairchild, I. J., Smith, C. L., Baker, A., Fuller, L., Spotl, C., Mat-tey, D., and McDermott, F.: Modification and preservation of environmental signals in speleothems, Earth-Science Rev., 75, 105–153, 2006.
Gibson, E. R., Hudson, P. K., and Grassian, V. H.: Physicochemical properties of nitrate aerosols: Implications for the atmosphere, J. Phys. Chem. A, 110, 11785–11799, 2006.
Gibson, E. R., Gierlus, K. M., Hudson, P. K., and Grassian, V. H.: Generation of internally mixed insoluble and soluble aerosol par-ticles to investigate the impact of atmospheric aging and hetero-geneous processing on the CCN activity of mineral dust aerosol, Aerosol Sci. Technol., 41, 914–924, 2007.
Gmelin: Das System CaO – CO2– H2O, Gmelins Handbuch der
anorganischen Chemie 8, System Nummer 28, Calcium, Teil B, Weinheim, Verlag Chemie, 928–935, 1961.
Herich, H., Tritscher, T., Wiacek, A., Gysel, M., Weingartner, E., Lohmann, U., Baltensperger, U., and Cziczo, D. J.: Water up-take of clay and desert dust aerosol particles at sub- and super-saturated water vapor conditions, Phys. Chem. Chem. Phys., 11, 7804–7809, doi:10.1039/b901585j, 2009.
Hings, S. S., Wrobel, W. C., Cross, E. S., Worsnop, D. R., Davi-dovits, P., and Onasch, T. B.: CCN activation experiments with adipic acid: effect of particle phase and adipic acid coatings on soluble and insoluble particles, Atmos. Chem. Phys., 8, 3735– 3748, doi:10.5194/acp-8-3735-2008, 2008.
House, W. A.: Kinetics of crystallization of calcite from calcium bicarboante solutions, J. Chem. Soc. Farad. Trans. I, 77, 341– 359, 1981.
Jayne, J. T., Leard, D. C., Zhang, X. F., Davidovits, P., Smith, K. A., Kolb, C. E., and Worsnop, D. R.: Development of an aerosol mass spectrometer for size and composition analysis of submi-cron particles, Aerosol Sci. Technol., 33, 49–70, 2000.
Jonas, P. R., Charlson, R. J., and Rodle, H.: Climate change 1994: radiation of Climate Change and An Evaluation of the Changes, Cambridge University Press, Cambridge, 1995.
Keiser, E. H. and Leavitt, S.: On the preparation and the composi-tion of the acid carbonates of calcium and barium, J. Am. Chem. Soc., 30, 1711–1714, 1908.
Koehler, K. A., Kreidenweis, S. M., DeMott, P. J., Prenni, A. J., and Petters, M. D.: Potential impact of Owens (dry) Lake dust on warm and cold cloud formation, J. Geophys. Res., 112, D12210, doi:10.1029/2007jd008413, 2007.
Koehler, K. A., Kreidenweis, S. M., DeMott, P. J., Petters, M. D., Prenni, A. J., and Carrico, C. M.: Hygroscopicity and cloud droplet activation of mineral dust aerosol, Geophys. Res. Lett., 36, L08805, doi:10.1029/2009gl037348, 2009.
Krueger, B. J., Grassian, V. H., Laskin, A., and Cowin, J. P.: The transformation of solid atmospheric particles into liq-uid droplets through heterogeneous chemistry: laboratory in-sights into the processing of calcium containing mineral dust aerosol in the troposphere, Geophys. Res. Lett., 30(4), L1148, doi:10.1029/2002GL016563, 2003.
Laskin, A., Iedema, M. J., Ichkovich, A., Graber, E. R., Taraniuk, I., and Rudich, Y.: Direct observation of completely processed calcium carbonate dust particles, Farad. Discuss., 130, 453–468, 2005.
Liu, Y., Gibson, E. R., Cain, J. P., Wang, H., Grassian, V. H., and Laskin, A.: Kinetics of heterogeneous reaction of CaCO3 parti-cles with gaseous HNO3over a wide range of humidity, J. Phys. Chem. A, 112, 1561–1571, 2008a.
Liu, Y. J., Zhu, T., Zhao, D. F., and Zhang, Z. F.: Investigation of the hygroscopic properties of Ca(NO3)2and internally mixed
Ca(NO3)2/CaCO3particles by micro-Raman spectrometry,
At-mos. Chem. Phys., 8, 7205–7215, doi:10.5194/acp-8-7205-2008, 2008b.
Marquardt, A., Hackfort, H., Borchardt, J., Schober, T., and Friedrich, J.: TEM-Untersuchungen der Mikrostrukturen von Verbrennungsaerosolen, Berichte des Forschungszentrums J¨ulich; JUEL-2700, ISSN 0366-0885, 1992.