BGD
10, 1793–1829, 2013Phytoplankton along a temperature
gradient
W. H. van de Poll et al.
Title Page
Abstract Introduction
Conclusions References
Tables Figures
◭ ◮
◭ ◮
Back Close
Full Screen / Esc
Printer-friendly Version Interactive Discussion
Discussion
P
a
per
|
Dis
cussion
P
a
per
|
Discussion
P
a
per
|
Discussio
n
P
a
per
|
Biogeosciences Discuss., 10, 1793–1829, 2013 www.biogeosciences-discuss.net/10/1793/2013/ doi:10.5194/bgd-10-1793-2013
© Author(s) 2013. CC Attribution 3.0 License.
Open Access
Biogeosciences
Discussions
Geoscientiic Geoscientiic
Geoscientiic Geoscientiic
This discussion paper is/has been under review for the journal Biogeosciences (BG). Please refer to the corresponding final paper in BG if available.
Phytoplankton biomass, composition,
and productivity along a temperature and
stratification gradient in the Northeast
Atlantic Ocean
W. H. van de Poll1, G. Kulk2, K. R. Timmermans1, C. P. D. Brussaard1, H. J. van der Woerd3, M. J. Kehoe4, K. D. A. Mojica1, R. J. W. Visser2, and A. G. J. Buma2
1
Department of Biological Oceanography, Royal Netherlands Institute for Sea Research (NIOZ), P.O. Box 59, 1790 AB, Den Burg, The Netherlands
2
Department of Ocean Ecosystems, Energy and Sustainability Research Institute Groningen, University of Groningen, Nijenborgh 7, 9747 AG Groningen, The Netherlands
3
Institute for Environmental Studies (IVM), VU University Amsterdam, De Boelelaan 1087, 1081 HV, Amsterdam, The Netherlands
4
BGD
10, 1793–1829, 2013Phytoplankton along a temperature
gradient
W. H. van de Poll et al.
Title Page
Abstract Introduction
Conclusions References
Tables Figures
◭ ◮
◭ ◮
Back Close
Full Screen / Esc
Printer-friendly Version Interactive Discussion
Discussion
P
a
per
|
Dis
cussion
P
a
per
|
Discussion
P
a
per
|
Discussio
n
P
a
per
|
Received: 14 January 2013 – Accepted: 19 January 2013 – Published: 31 January 2013
Correspondence to: W. H. van de Poll ([email protected])
BGD
10, 1793–1829, 2013Phytoplankton along a temperature
gradient
W. H. van de Poll et al.
Title Page
Abstract Introduction
Conclusions References
Tables Figures
◭ ◮
◭ ◮
Back Close
Full Screen / Esc
Printer-friendly Version Interactive Discussion
Discussion
P
a
per
|
Dis
cussion
P
a
per
|
Discussion
P
a
per
|
Discussio
n
P
a
per
|
Abstract
The North Atlantic Ocean experiences considerable variability in sea surface tem-perature (SST, >10 m) on seasonal and inter-annual time-scales. Relationships be-tween SST and vertical density stratification, nutrient concentrations, and phytoplank-ton biomass, composition, and absorption were assessed in spring and summer from
5
latitudes 30–62◦N. Furthermore, a bio-optical model was used to estimate productivity for five phytoplankton groups. Nutrient concentration (integrated from 0–125 m) was in-versely correlated with SST in spring and summer. SST was also inin-versely correlated with near surface (0–50 m) Chlaand productivity for stratified stations. However, near surface Chlashowed an exponential relationship with SST, whereas a linear
relation-10
ship was found for productivity and SST. The response of phytoplankton to changes in SST is therefore most likely to be observed by changes in Chla rather than produc-tivity. The discrepancy between relationships of Chla and productivity were probably related to changes in phytoplankton cell size. The contribution of cyanobacteria to water column productivity correlated positively with SST and inversely with nutrient
concen-15
tration. This suggests that a rise in SST (over a 13–23◦C range) stimulates productivity by cyanobacteria at the expense of haptophytes, which showed an inverse relationship to SST. At higher latitudes, where rising SST may prolong the stratified season, hapto-phyte productivity may expand at the expense of diatom productivity. Depth integrated Chla (0–410 m) was greatest in the spring at higher latitudes, where stratification in
20
the upper 200 m was weakest. This suggests that stronger stratification does not nec-essarily result in higher phytoplankton biomass standing stock in this region.
1 Introduction
Phytoplankton growth in the oceans ultimately depends on seasonal and inter-annual climatological cycles that determine the availability of nutrients and light. In the open
25
BGD
10, 1793–1829, 2013Phytoplankton along a temperature
gradient
W. H. van de Poll et al.
Title Page
Abstract Introduction
Conclusions References
Tables Figures
◭ ◮
◭ ◮
Back Close
Full Screen / Esc
Printer-friendly Version Interactive Discussion
Discussion
P
a
per
|
Dis
cussion
P
a
per
|
Discussion
P
a
per
|
Discussio
n
P
a
per
|
availability for phytoplankton growth. Stabilization of the water column allows phyto-plankton to exploit higher irradiance intensities near the surface. However, stratification also inhibits exchange with nutrient rich deep water, potentially leading to nutrient lim-itation of phytoplankton near the surface. In the absence of stratification (winter, early spring) the depth range of vertical mixing due to wind and convection can expand by
5
more than one order of magnitude, reducing phytoplankton light availability, and in-creasing nutrient concentrations. Furthermore, stratification may affect predator-prey and viral-algal host interactions by influencing encounter rates (Behrenfeld, 2010; Bau-doux et al., 2008). Moreover, stratification is also an important factor in the seasonal development of phytoplankton composition in the open ocean. Changes in
phytoplank-10
ton composition often coincide with changes in cell size, because an increased surface-to-volume ratio is advantageous under low nutrient concentrations typical of a stratified water column (Chisholm and Morel, 1991). High nutrient concentrations and turbu-lence due to winter mixing supports the growth of larger phytoplankton species such as diatoms, whereas the onset of stratification in spring leads to a succession towards
15
smaller phytoplankton species (Litchman et al., 2007; Claustre et al., 2005). Low nu-trient availability in the (sub)tropical oligotrophic ocean results in the dominance of cyanobacteria like Synechococcus and Prochlorococcus over pico-eukaryotic phyto-plankton species (Li, 1994; Johnson et al., 2006). The changes in phytophyto-plankton com-position can affect productivity and carbon storage to the deep ocean (Claustre et al.,
20
2005; Martin et al., 2011).
Apart from pronounced seasonal changes, the North Atlantic experiences fluctua-tions in sea surface temperature (SST,>10 m) on inter-annual to multi-decadal scales due to the influence of the North Altantic Oscillation and the Atlantic Multi decadal Os-cillation (changes in the range of 0.5◦C, Drinkwater et al., 2003; Enfield et al., 2001;
25
BGD
10, 1793–1829, 2013Phytoplankton along a temperature
gradient
W. H. van de Poll et al.
Title Page
Abstract Introduction
Conclusions References
Tables Figures
◭ ◮
◭ ◮
Back Close
Full Screen / Esc
Printer-friendly Version Interactive Discussion
Discussion
P
a
per
|
Dis
cussion
P
a
per
|
Discussion
P
a
per
|
Discussio
n
P
a
per
|
the upper oceans (Steinacher et al., 2010; Hofmann et al., 2011), thereby reducing the depth of the mixed layer and decreasing nutrient exchange with the deep ocean. Re-mote sensing derived, globally averaged Chla and productivity showed a significant negative relationship with density differences in the upper oligotrophic open ocean (Behrenfeld et al., 2006; Polovina et al., 2008). However, long term monitoring sites
5
and historical records for estimated Chla showed conflicting trends for the North At-lantic and other oceanic regions (Chavez et al., 2010; Boyce et al., 2010). Furthermore, no evidence for the inter-annual control of phytoplankton biomass and productivity by stratification was observed in the subtropical North Pacific and North Atlantic, although stratification correlated on a seasonal timescale with phytoplankton productivity (Dave
10
and Lozier, 2010; Lozier et al., 2011). At mid and higher latitudes in the North Atlantic, stratification has been associated with bloom formation (Dutkiewicz et al., 2001). Here, termination of convection and the onset of stratification initiate the phytoplankton spring bloom (Siegel et al., 2002; Taylor and Ferrari, 2011; Mahadevan et al., 2012). Earlier onset of stratification in the subpolar North Atlantic may prolong the phytoplankton
15
bloom season (Racault et al., 2012). As such, different responses to stratification can be expected between the sub-polar and subtropical North Atlantic (Richardson and Schoeman, 2004).
A pronounced gradient in SST and stratification can be observed from low (30◦N) to higher (62◦N) latitudes in the North Atlantic (Jurado et al., 2012a,b). We
investi-20
gated seasonal changes in biomass, productivity, and composition of North Atlantic phytoplankton along this gradient in relation to stratification, sea surface temperature, nutrient concentration, and light availability. Furthermore, a model was used to esti-mate daily water column productivity in the euphotic zone, using in situ phytoplankton biomass (Chla), phytoplankton composition (pigments), light, and temperature as
vari-25
BGD
10, 1793–1829, 2013Phytoplankton along a temperature
gradient
W. H. van de Poll et al.
Title Page
Abstract Introduction
Conclusions References
Tables Figures
◭ ◮
◭ ◮
Back Close
Full Screen / Esc
Printer-friendly Version Interactive Discussion
Discussion
P
a
per
|
Dis
cussion
P
a
per
|
Discussion
P
a
per
|
Discussio
n
P
a
per
|
2 Methods
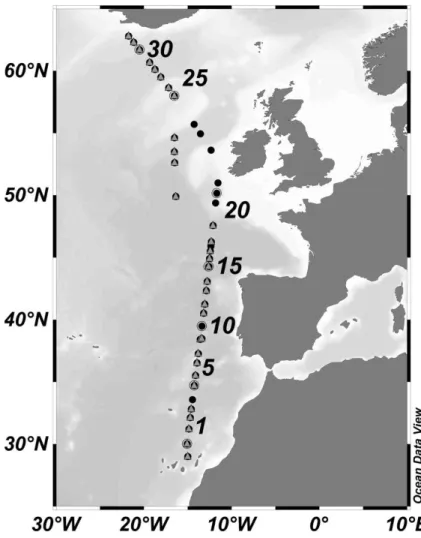
Two cruises were performed in the North Atlantic Ocean onboard the RV Pelagia cov-ering the area between the Canary Islands and Iceland (summer: July/August 2009; spring: April/May 2011). The cruise track covered subtropical, temperate, and sub-polar sections in the North Atlantic Ocean (Fig. 1). Samples were collected with a trace
5
metal clean CTD frame equipped with 12 (summer) and 27 L (spring) sample bottles. Samples for macro nutrients, pigments, and chlorophyll specific absorption (see below) were obtained in a dedicated clean container.
2.1 Stratification index
The stratification index (Behrenfeld et al., 2006; Dave and Lozier, 2010; Lozier et al.,
10
2011) was used as a measure of stratification. The stratification index was calculated as the difference in potential density (sigma-theta) between the upper 10 m (0–10 m average) and 200 m using the salinity and temperature profiles obtained by the CTD (Seabird 9+). When the difference in potential density was smaller than 0.125, the upper 200 m was considered as non-stratified (De Boyer Montegut et al., 2004).
15
2.2 Nutrients
Nutrient samples (6 mL) were obtained from multiple bottles, sampling between 4 and 7 depths. The samples were filtered through 0.2 µm Acrodisc filters and measured onboard for inorganic PO4, NH4, NO2, and NOx using a Bran & Luebbe Quaatro auto analyzer. Depth profiles of PO4 and NO3 (calculated by subtracting NO2 from NOx)
20
were fitted with a three or a five parameter sigmoidal function by non-linear regression (Sigma plot 11.0). Using the obtained function, nutrient concentrations were calculated over one meter depth intervals for the potential (0–125 m), upper (0–50 m), and lower (50–125 m) euphotic zone. Furthermore, N : P ratios were calculated for the upper and lower euphotic zone as (NO3+NH4)/PO4for the respective depth intervals.
BGD
10, 1793–1829, 2013Phytoplankton along a temperature
gradient
W. H. van de Poll et al.
Title Page
Abstract Introduction
Conclusions References
Tables Figures
◭ ◮
◭ ◮
Back Close
Full Screen / Esc
Printer-friendly Version Interactive Discussion
Discussion
P
a
per
|
Dis
cussion
P
a
per
|
Discussion
P
a
per
|
Discussio
n
P
a
per
|
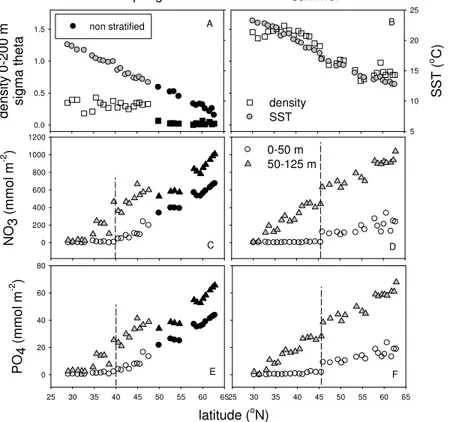
In the present study, oligotrophic and mesotrophic stations were distinguished based on concentration of NO3in the upper euphotic zone (0–50 m). We defined oligotrophic stations as those stations where NO3in the upper euphotic zone was below the detec-tion limit, whereas nutrients were detectable in the upper euphotic zone of mesotrophic stations (Fig. 2).
5
2.3 Chlorophyll specific absorption
Samples (5–10 L) for Chlaspecific absorption were obtained from the chlorophyll max-imum (oligotrophic stations:∼70 m, mesotrophic stations:∼40 m) and from the
sub-surface (oligotrophic stations:∼15–30 m, mesotrophic stations:∼10–15 m). The
sam-ples were filtered through 47 mm GF/F (Whatman), frozen in liquid nitrogen, and stored
10
at −80◦C. Transmission and reflection from the filter was measured between 350–
800 nm on a Varian CARY 3E UV/VIS double beam spectrophotometer with integrating sphere over 1 nm intervals, before and after bleaching with 1 % sodium hypochloride (Tassan and Ferrari, 1995). Chlorophyll specific absorption (a∗
ph) was calculated be-tween 400–700 nm using the filter clearance area, sample volume, Chlaconcentration
15
(separate HPLC sample, see below), and the amplification factorβ(set at 2 for all sam-ples). The spectrally weighted mean specific absorption coefficient (a∗) was calculated as the sum ofa∗ph between 400–700 nm and corrected by a normalized solar spectrum (maximum set to one).
2.4 Pigment composition
20
Four to seventeen samples (5–10 L) were obtained from multiple depths at each station and filtered through 47 mm GF/F (Whatman) under mild vacuum (0.3 mbar), frozen in liquid nitrogen, and stored at−80◦C. Prior to analysis, filters were freeze dried (48 h)
and pigments were extracted in 90 % acetone (v/v) (48 h, 4◦C, darkness). Pigments were separated on a Waters 2695 HPLC using a Zorbax Eclipse XDB-C8 column
25
BGD
10, 1793–1829, 2013Phytoplankton along a temperature
gradient
W. H. van de Poll et al.
Title Page
Abstract Introduction
Conclusions References
Tables Figures
◭ ◮
◭ ◮
Back Close
Full Screen / Esc
Printer-friendly Version Interactive Discussion
Discussion
P
a
per
|
Dis
cussion
P
a
per
|
Discussion
P
a
per
|
Discussio
n
P
a
per
|
(Waters 996) and retention time were used for pigment identification and the sys-tem was calibrated against standards (DHI, Denmark) for chlorophylla1, divinyl (dv) chlorophylla2, chlorophyllb, chlorophyllc2, chlorophyllc3, 19-butanoyloxyfucoxanthin, 19-hexanoyloxyfucoxanthin, fucoxanthin, neoxanthin, prasinoxanthin, and zeaxanthin. Total Chla(sum of Chla1 and dv Chla) obtained from HPLC analysis served as
phy-5
toplankton biomass indicator and was used to calibrate the fluorescence sensor from the CTD (Chelsea Aquatracka Mk III). A single relationship between HPLC Chla and Chlafluorescence values was used for the summer cruise. However, during the spring cruise, the relationship between Chla fluorescence and HPLC Chl a was more vari-able and three different relationships were used to calibrate the fluorescence profiles
10
for data from latitude 28–40◦N, 40–47◦N, and 48–62◦N. The calibrated fluorescence profiles were then used to calculate Chl a over 1 m depth intervals. Depth integrated Chla was calculated for the euphotic zone and for defined depth intervals: Chl a in-tegrated over 0–50 m (Chla0–50 m) and total depth integrated Chl a (surface to 200– 410 m, Chl at). The euphotic zone was defined as the depth with 0.1 % of surface
ir-15
radiance. The 0.1 % light depth was calculated from the vertical attenuation coefficient (Kd), which was determined from linear regression of natural log transformed PAR vs. depth (PAR: photosynthetically active radiation, 400–700 nm, measured by a 2π Sat-lantic PAR sensor on the CTD).
2.5 Phytoplankton composition
20
Phytoplankton taxonomic composition was determined using CHEMTAX (Mackey et al., 1996) as described by Mojica et al. (submitted). In short, 13 pigments (Chla, dv Chl a, Chl b, Chl c2, Chl c3, peridinin, fucoxanthin, 19-butanoyloxyfucoxanthin, 19-hexanoyloxyfucoxanthin, neoxanthin, prasinoxanthin, alloxanthin, and zeaxanthin) were used to distinguish 8 taxonomic groups (cyanobacteria, prochlorophytes,
hap-25
BGD
10, 1793–1829, 2013Phytoplankton along a temperature
gradient
W. H. van de Poll et al.
Title Page
Abstract Introduction
Conclusions References
Tables Figures
◭ ◮
◭ ◮
Back Close
Full Screen / Esc
Printer-friendly Version Interactive Discussion
Discussion
P
a
per
|
Dis
cussion
P
a
per
|
Discussion
P
a
per
|
Discussio
n
P
a
per
|
chlorophyll maximum. In accordance, separate CHEMTAX analysis were performed for oligotrophic samples with depth<50 m and>50 m, using high light and low light acclimated initial pigment ratios, respectively. Mesotrophic stations showed no diff er-ences between sub-surface and chlorophyll maximum Chlaspecific absorption, and for these stations, low light acclimated pigment ratios were used for all depths.
Contribu-5
tions of the taxonomic groups were expressed relative to Chla. Initial pigment ratios for CHEMTAX were obtained from published pigment ratios (Zapata et al., 2004; Laviale and Neveux, 2011; Kulk et al., 2011, 2012) and from exponentially growing batch cul-tures (haptophytes:E. huxleyi,P. globosa, and diatoms:D. brightwelii,T. pseudonana, unpublished results). The current study focused on five phytoplankton groups used in
10
the primary production model. Further details on phytoplankton species composition were published by Mojica et al. (2013).
2.6 Primary production
Depth integrated daily primary production in the euphotic zone (PPZeu) and in the upper 50 m (PP0–50 m) was calculated for each station using a diagnostic bio-optical model
15
comparable to Claustre et al. (2005) and Uitz et al. (2008). The model uses in situ temperature, light, light attenuation, and Chla profiles to estimate primary productiv-ity of different oceanic phytoplankton groups. In contrast to the model presented by Claustre et al. (2005) and Uitz et al. (2008), the current model uses CHEMTAX based taxonomic groups and laboratory determined primary production rates. In situ Chl a
20
specific absorption was used to reveal potential vertical structures in photoacclimation characteristics.
2.6.1 In situ data
In situ measurements obtained during the two cruises in the North Atlantic Ocean were used to set the irradiance climate, temperature, and biomass in the model. The
25
BGD
10, 1793–1829, 2013Phytoplankton along a temperature
gradient
W. H. van de Poll et al.
Title Page
Abstract Introduction
Conclusions References
Tables Figures
◭ ◮
◭ ◮
Back Close
Full Screen / Esc
Printer-friendly Version Interactive Discussion
Discussion
P
a
per
|
Dis
cussion
P
a
per
|
Discussion
P
a
per
|
Discussio
n
P
a
per
|
Moderate Resolution Imaging Spectroradiometer (MODIS) satellite. The time resolved surface PAR was then calculated using the formulations for the diurnal variation of solar irradiance from Kirk et al. (1994). PAR attenuation for 1 m depth intervals was calculated using theKddetermined from PAR profiles of the CTD (see above).
The in situ SST (CTD temperature at 10 m depth) during the spring and summer
5
cruise in the North Atlantic Ocean ranged from 7.7–23.3◦C. Because the model is based on laboratory measurements at 20◦C, a temperature correction was applied. A linear relationship between carbon fixation and temperature was assumed. A mean slope (−0.045 mg C m−2d−1◦C−1) obtained from growth versus temperature
experi-ments was used (Montagnes and Franklin, 2001).
10
Phytoplankton biomass (Chla) was obtained from in situ fluorescence profiles (1 m depth intervals), which were calibrated to HPLC Chl a concentrations as described above.
2.6.2 Primary production calculations
Based on the taxonomic composition estimated by CHEMTAX, five different groups
15
were distinguished to model primary production: group 1: Prochlorococcus, group 2:
Synechococcus, group 3: Prasinophyceae, Pelagophyceae, and Cryptophyceae, group
4: Haptophyceae and Dinophyceae, and group 5: diatoms. Photosynthetic characteris-tics for these functional groups were obtained from14C based photosynthesis versus irradiances (PE) measurements ofProchlorococcus marinus (group 1),
Synechococ-20
cussp. (group 2),Ostreococcussp. (group 3),Emiliania huxleyi (group 4), and Thalas-siosira oceanica(group 5) (Kulk et al., 2011). Photosynthetic characteristic of low light (50 µmol photons m−2s−1) and high light (125 µmol photons m−2s−1) acclimated phyto-plankton were used to calculate carbon fixation rates. To this end, a vertical structure in photosynthetic characteristics was assumed at oligotrophic stations, as was observed
25
BGD
10, 1793–1829, 2013Phytoplankton along a temperature
gradient
W. H. van de Poll et al.
Title Page
Abstract Introduction
Conclusions References
Tables Figures
◭ ◮
◭ ◮
Back Close
Full Screen / Esc
Printer-friendly Version Interactive Discussion
Discussion
P
a
per
|
Dis
cussion
P
a
per
|
Discussion
P
a
per
|
Discussio
n
P
a
per
|
whereas low light acclimated phytoplankton (50 µmol photons m−2s−1) were assumed below this depth. In addition, phytoplankton were assumed to be low light acclimated when surface Chla exceeded 0.5 mg m−3
. Depth integrated primary production was calculated according to Platt et al. (1980) for a 24 h period over 1 h time intervals in the euphotic zone (0.1 % PAR) for the five functional phytoplankton groups.
5
2.7 Statistics
Relationships between nutrient concentration (NO3and PO4integrated over 0–125 m: N, P0–125 m), SST, density differences (0–200 m), phytoplankton biomass, and phyto-plankton productivity were assessed by calculating the Spearman rank order correla-tion coefficient (SigmaPlot 11.0, Systat Software). We used the following indicators
10
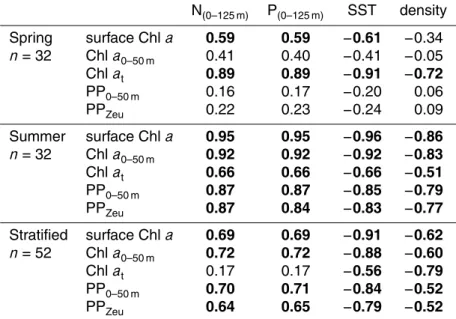
for phytoplankton biomass: Chl a concentration in samples from 10–20 m (surface Chl a), Chl a integrated over 0–50 m (Chl a0–50 m), and total depth integrated Chl a (surface down to 200–410 m, Chlat). The daily integrated productivity in the euphotic zone (PPZeu) and the daily productivity integrated over 0–50 m (PP0–50 m) was used as a measure for productivity. In addition, relationships between contributions of five
15
taxonomic groups to productivity were assessed.
Summer and spring cruises were tested separately (n=32). Furthermore, relation-ships were assessed for stratified (spring and summer cruise pooled,n=52) and non-stratified (spring,n=12) stations. Chlaspecific absorption data from oligotrophic and mesotrophic stations were pooled (sub-surface and Chl a maximum separately) and
20
BGD
10, 1793–1829, 2013Phytoplankton along a temperature
gradient
W. H. van de Poll et al.
Title Page
Abstract Introduction
Conclusions References
Tables Figures
◭ ◮
◭ ◮
Back Close
Full Screen / Esc
Printer-friendly Version Interactive Discussion
Discussion
P
a
per
|
Dis
cussion
P
a
per
|
Discussion
P
a
per
|
Discussio
n
P
a
per
|
3 Results
3.1 Vertical density stratification
In summer, all stations were stratified, whereas weaker stratification was found in spring (Fig. 2). In spring, the upper 200 m of the 12 stations above 47◦N were considered to be non-stratified (density difference<0.125). In both seasons, the stratification index
5
was highest at low latitudes and declined at higher latitudes, but the latitudinal gradi-ent was less pronounced in spring compared to summer. The correlation between the stratification index (difference in potential density between the surface and 200 m) and SST (<10 m) was stronger in summer than in spring (correlation coefficient 0.87 vs. 0.78, data not shown).
10
3.2 Nutrient standing stock
Oligotrophic conditions were encountered up to latitude 45◦N in summer and 39◦N in spring. N and P concentrations in the lower euphotic zone (50–125 m) increased linearly with latitude and did not show significant differences between spring and sum-mer (Fig. 2). N and P in the upper euphotic zone (0–50 m) of mesotrophic stations
15
increased with latitude and concentrations were higher in spring than in summer. N, P0–125 m showed strong inverse correlations with SST in spring and summer and for stratified (summer and spring combined) and non-stratified stations (Table 1). The cor-relations between stratification index and N, P0–125 m were stronger in summer than in spring and were not significant for stratified (summer and spring combined) and
non-20
stratified stations. Integrated N and P concentrations in the euphotic zone were on average five times higher in non-stratified stations compared to stratified stations (data not shown).
Average N : P ratios for the upper euphotic zone of oligotrophic stations were 10.5 and 11.4 for spring and summer, respectively (data not shown). Four oligotrophic
sta-25
BGD
10, 1793–1829, 2013Phytoplankton along a temperature
gradient
W. H. van de Poll et al.
Title Page
Abstract Introduction
Conclusions References
Tables Figures
◭ ◮
◭ ◮
Back Close
Full Screen / Esc
Printer-friendly Version Interactive Discussion
Discussion
P
a
per
|
Dis
cussion
P
a
per
|
Discussion
P
a
per
|
Discussio
n
P
a
per
|
from the N : P calculations. At mesotrophic stations, the average N : P ratio of the upper euphotic zone was 15.3 and 13.2 for spring and summer. Average N : P ratios for the lower euphotic zone were 14.0 and 18.7 for spring and summer in oligotrophic stations and 15.9 and 16.3 spring and summer in mesotrophic stations, respectively.
3.3 Phytoplankton Chlaspecific absorption
5
At oligotrophic stations, the spectrally weighted mean specific absorption coefficient (a∗) was significantly (p <0.01) higher in samples from the sub-surface compared to the chlorophyll maximum in spring and summer (Fig. 3). In mesotrophic stations, a∗
was not different between samples from the sub-surface and chlorophyll maximum in spring and summer. Chl a specific absorption was on average 37 % lower in spring
10
compared to summer (p <0.001).
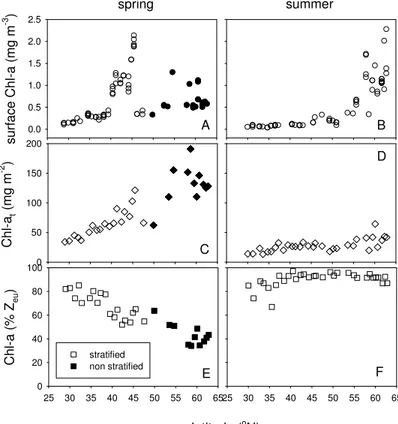
3.4 Phytoplankton biomass
Oligotrophic stations showed low surface Chla, whereas higher concentrations were found in a deep chlorophyll maximum (DCM). Mean surface Chlawas higher in spring (0.23±0.07 mg Chlam−3) than in summer (0.08±0.03 mg Chlam−3) for oligotrophic
15
stations (Fig. 4). More variability in surface Chlawas observed in mesotrophic stations, with maximal surface concentrations (2.0 mg Chlam−3) at mid-latitudes during spring and at higher latitudes during the summer. Mean depth integrated Chl a (Chl at) for oligotrophic stations was 49±11 and 23±6 mg Chlam−2for spring and summer,
re-spectively. Stronger seasonal differences were found in Chlatof mesotrophic stations
20
with on average 112±36 and 33±11 mg Chlam−2in spring and summer, respectively.
Non-stratified stations showed highest Chlat (up to 190 mg Chlam− 2
, integrated over 410 m). Depth integrated Chla in the euphotic zone declined with increasing latitude from 80 to 30 % in spring, whereas 90 % of Chla was found in the euphotic zone in summer (Fig. 4). In spring, Chla in the euphotic zone correlated positively with SST
25
BGD
10, 1793–1829, 2013Phytoplankton along a temperature
gradient
W. H. van de Poll et al.
Title Page
Abstract Introduction
Conclusions References
Tables Figures
◭ ◮
◭ ◮
Back Close
Full Screen / Esc
Printer-friendly Version Interactive Discussion
Discussion
P
a
per
|
Dis
cussion
P
a
per
|
Discussion
P
a
per
|
Discussio
n
P
a
per
|
Surface Chl a and Chl a0–50 m correlated with N, P0–125 m, whereas inverse corre-lations were observed with SST (Table 2, Fig. 5). Correcorre-lations between these vari-ables were weaker in spring compared to summer. In spring, Chlat correlated with N, P0–125 m, SST, and the stratification index. When tested for stratified stations (spring and summer combined), surface Chlaand Chla0–50 mshowed significant inverse
cor-5
relations with SST and a positive correlation with N, P0–125 m, whereas this was not found for the stratification index (Table 2). The relationships between Chl a (surface Chlaand Chla0–50 m) and SST was best described by an exponentially declining func-tion (Fig. 5). Chlaconcentrations of non-stratified stations were not correlated with N, P0–125 m, SST, and stratification index (data not shown).
10
3.5 Primary production
Daily primary production in the euphotic zone (PPZeu) of oligotrophic stations showed about 2-fold lower carbon fixation in summer than in spring (on average 457±242 and
979±236 mg C m−2d−1, respectively, Fig. 6). However, for mesotrophic stations, PPZeu showed no significant differences between spring and summer (on average 1210±225
15
and 1330±232 mg C m−2d−1, respectively). In summer, PPZeuand PP0–50 mcorrelated positively with N, P0–125 m, and inversely with SST and the stratification index (n=32, Table 2). These correlations were weaker or not significant in spring (n=32). PPZeu and PP0–50 m showed an inverse correlation with SST in stratified stations (summer and spring combined) (Table 2, Fig. 5), and a positive correlation with N, P0–125 m
(Ta-20
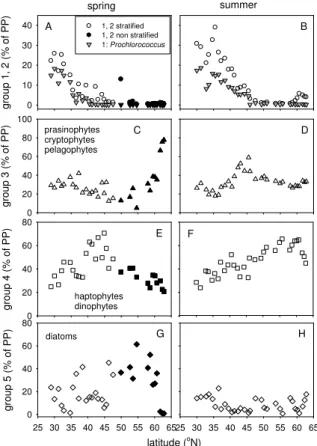
ble 2). There was a weak inverse correlation between productivity and the stratification index for stratified stations (Table 2). Productivity of non-stratified stations showed no correlations with N, P0–125 m and SST (data not shown).
Cyanobacteria contributed up to 30 % to productivity of oligotrophic stations (group 1 and 2 combined, Fig. 7). At stratified stations (summer and spring combined), the
25
BGD
10, 1793–1829, 2013Phytoplankton along a temperature
gradient
W. H. van de Poll et al.
Title Page
Abstract Introduction
Conclusions References
Tables Figures
◭ ◮
◭ ◮
Back Close
Full Screen / Esc
Printer-friendly Version Interactive Discussion
Discussion
P
a
per
|
Dis
cussion
P
a
per
|
Discussion
P
a
per
|
Discussio
n
P
a
per
|
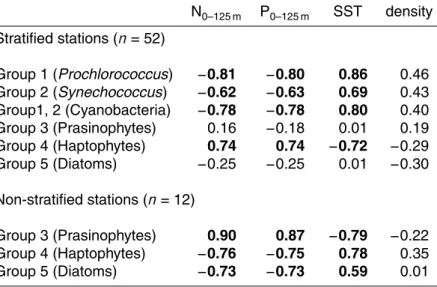
(Fig. 7). On average 30 % of group 3 (prasinophytes, pelagophytes and cryptophytes) consisted of prasinophytes (data not shown). Group 3 showed a relatively stable contri-bution to productivity of stratified stations (on average 30 %). In non-stratified stations the contribution of group 3 increased up to 73 % and showed positive correlations with N, P0–125 m and an inverse correlation with SST (Table 3). Haptophytes were the most
5
important contributor of group 4 (haptophytes, dinophytes) in spring (91 %) and sum-mer (75 %). On average, group 4 accounted for 50 % of the production in mesotrophic stations, whereas this was 37 % in oligotrophic stations (Fig. 7). At stratified stations (summer and spring), the contribution of group 4 correlated positively with N, P0–125 m and inversely with SST (Table 3). At non-stratified stations, group 4 showed inverse
10
correlations with N, P0–125 m and a positive correlation with SST. The contribution of diatoms to productivity (groups 5) was maximal at higher latitudes (up to 60 %) during the spring compared to summer (on average 8 %, Fig. 7). The contribution of diatoms to the productivity in stratified stations did not show correlations with N, P0–125 m and SST (Table 3). At non-stratified stations, this group was inversely correlated with N,
15
P0–125 m and positively correlated with SST (Table 3).
4 Discussion
4.1 Phytoplankton biomass and productivity in relationship to SST,
stratification, and nutrients
The summer and spring comparison of open ocean stations in the North Atlantic (30–
20
62◦N) showed that phytoplankton biomass, productivity, and composition were corre-lated with N and P concentrations and SST. In the present study, the potential nutrient availability for phytoplankton was estimated by integration of nutrient concentrations over 0–125 m (N, P0–125 m). The positive correlation between N, P0–125 mand Chla sug-gested that open ocean phytoplankton biomass and productivity were controlled by the
25
BGD
10, 1793–1829, 2013Phytoplankton along a temperature
gradient
W. H. van de Poll et al.
Title Page
Abstract Introduction
Conclusions References
Tables Figures
◭ ◮
◭ ◮
Back Close
Full Screen / Esc
Printer-friendly Version Interactive Discussion
Discussion
P
a
per
|
Dis
cussion
P
a
per
|
Discussion
P
a
per
|
Discussio
n
P
a
per
|
with phytoplankton biomass and productivity and with N, P0–125 m. This suggests that SST is important in determining nutrient availability for phytoplankton by influencing vertical exchange with deeper nutrient rich water. The relationships were stronger with SST than with the stratification index. A possible explanation for this may be that tem-perature influences phytoplankton growth rates (nutrient utilization) in addition to
influ-5
encing nutrient availability in the water column. Correlations between SST and phy-toplankton biomass and productivity were weaker under the weakly and non-stratified conditions in spring. Moreover, the fraction of the phytoplankton biomass in the eu-photic zone correlated with SST. Combined, this indicates that convective and wind mixing exerted a stronger influence on the water column distribution of Chlain spring.
10
The inverse relationships between SST and near surface phytoplankton biomass and PP0–50 m for stratified stations suggests that within the SST range of 13–23◦C, North Atlantic open ocean phytoplankton productivity can co-vary with seasonal, inter annual, and multi-decadal SST changes. This also implies that anthropogenic warming of the ocean has a negative influence on phytoplankton biomass and productivity in the
strat-15
ified open ocean within this temperature range. The relationship between productivity and SST in stratified stations indicated that a 0.5◦C increase in SST causes a 6.5 % decline in daily productivity in the upper 50 m. Gregg et al. (2003) reported a similar decline in productivity (6–7 %) in the central and northern section of the North Atlantic from a 0.3–0.7◦C SST increase. In addition, the non-linear response of Chl ato SST
20
observed in the present study suggested that a SST rise of 0.5◦C would correspond to a 13–15 % decline in near surface Chla(surface Chla, Chla0–50 m) for stratified condi-tions between 13–23◦C. Moreover, the non-linear nature of this relationship suggests that responses to changes in SST are more likely to be detected in Chlacompared to productivity.
25
BGD
10, 1793–1829, 2013Phytoplankton along a temperature
gradient
W. H. van de Poll et al.
Title Page
Abstract Introduction
Conclusions References
Tables Figures
◭ ◮
◭ ◮
Back Close
Full Screen / Esc
Printer-friendly Version Interactive Discussion
Discussion
P
a
per
|
Dis
cussion
P
a
per
|
Discussion
P
a
per
|
Discussio
n
P
a
per
|
be caused by increased pigment packaging due to the presence of larger phytoplankton species such as diatoms. Furthermore, the relationships between Chla fluorescence (CTD) and HPLC determined Chlaconcentrations showed a decreased Chlaspecific fluorescence yield in spring as compared to summer (data not shown), providing ad-ditional evidence for seasonal differences in the Chla package effect. Most variability
5
in Chla specific absorption has been associated with changes in phytoplankton size structure (Bricaud et al., 2004). In the present study, reduced nutrient concentrations coincided with a shift to smaller phytoplankton species, which was also found in other studies (Bouman et al., 2011; Agawin et al., 2000). Smaller species contain less Chla
per cell and therefore show less pigment packaging (Ciotti et al., 2002). Therefore,
10
changes in phytoplankton cell size may contribute to the observed non-linear relation-ship between Chlaand SST. However, acclimation to different light and nutrient condi-tions can also influence cellular Chlaand Chlaspecific absorption, but the magnitude of these changes can vary among phytoplankton species (Geider et al., 1993; Kulk et al., 2011). Stronger turbulence in spring (Jurado et al., 2012b) may have reduced
15
the light dose experienced by the phytoplankton, thereby increasing cellular pigment concentrations compared to the more stable summer conditions. Therefore, contribu-tions of phytoplankton composition and photoacclimation on pigment concentracontribu-tions and packaging cannot be fully separated in the present study.
4.2 Stratification mediated shifts in phytoplankton biomass, productivity,
20
and composition
In spring, stations above 47◦N showed minimal stratification, with potential density differences in the upper 200 m of 0.029±0.02 kg m−3. This is less than the reported
0.12 kg m−3difference for eddy driven stratification that preceded thermal stratification in the same region in 2008 (Mahadevan et al., 2012), but corresponds with values
25
BGD
10, 1793–1829, 2013Phytoplankton along a temperature
gradient
W. H. van de Poll et al.
Title Page
Abstract Introduction
Conclusions References
Tables Figures
◭ ◮
◭ ◮
Back Close
Full Screen / Esc
Printer-friendly Version Interactive Discussion
Discussion
P
a
per
|
Dis
cussion
P
a
per
|
Discussion
P
a
per
|
Discussio
n
P
a
per
|
Chla was below the euphotic zone. Comparable observations were reported during late winter-early spring by Backhaus et al. (2003) for the Icelandic Basin. Inevitably, the occurrence of phytoplankton below the euphotic zone will slow down growth rates of the phytoplankton standing stock. However, productivity estimates for non-stratified stations in the present study were not significantly different compared to the stratified
5
mesotrophic stations in spring and summer.
Increased surface Chlain response to stratification of the water column represents the classical view of the spring bloom at mid and higher latitudes (Sverdrup, 1953). However, the present study suggests that the pre-bloom conditions, with minimal strat-ification in the upper 200 m (beginning of May, latitude 49–62◦N), were more
produc-10
tive in terms of depth integrated Chl a (129±32 mg Chl am−2) compared with
sur-face blooms at mid-latitudes in spring (44–45◦N, up to 112±13 mg Chl am−2) and
surface blooms at higher latitudes in summer (59–62◦N: 42±13 mg Chl am−2). This
also illustrates that surface Chl a concentration can be a poor indicator of phyto-plankton standing stock, since surface Chl a was lower during pre-bloom conditions
15
(0.7±0.3 mg Chl am−3) compared with spring (1.8±0.3 mg Chl am−3) and summer
(1.3±0.3 mg Chlam−3) blooms. It was earlier observed that phytoplankton growth
in-creased with increasing light in winter and early spring in the absence of stratification (Behrenfeld, 2010). This increase in Chl a can be masked by the diluting effect of deep convective and wind induced vertical mixing as proposed by Boss and
Behren-20
feld (2010).
Relationships between the contribution of taxonomic groups to productivity and SST were different for stratified and non-stratified stations. In the latter stations, productivity of group 3 (prasinophytes, cryptophytes) was inversely correlated with SST (7–12◦C), whereas group 4 (haptophytes) and 5 (diatoms) were positively correlated with SST.
25
BGD
10, 1793–1829, 2013Phytoplankton along a temperature
gradient
W. H. van de Poll et al.
Title Page
Abstract Introduction
Conclusions References
Tables Figures
◭ ◮
◭ ◮
Back Close
Full Screen / Esc
Printer-friendly Version Interactive Discussion
Discussion
P
a
per
|
Dis
cussion
P
a
per
|
Discussion
P
a
per
|
Discussio
n
P
a
per
|
nutrient (Si) limited and sink out of the euphotic zone (Alkire et al., 2012). Furthermore, contraction of the mixed layer and the euphotic zone due to stratification traps a large amount of the phytoplankton in the dark ocean (Backhaus et al., 2003). Estimated class-specific productivity from SeaWiFS observations showed that strongest produc-tivity anomalies occurred in early spring in the temperate and sub-polar North Atlantic,
5
coinciding with diatom productivity (Uitz et al., 2010). Therefore, it can be expected that differences in annual primary production are for a large part caused by variability in diatom productivity.
The nutrient concentrations in the euphotic zone of stratified stations were on av-erage five times lower compared to those of the non-stratified stations. Furthermore,
10
low N : P ratios indicated mostly N-limitation in the upper euphotic zone (0–50 m) of stratified stations. This is consistent with factorial nutrient addition experiments in the oligotrophic North Atlantic that have identified N as the primary limiting nutrient (Davey et al., 2008; Moore et al., 2008). Therefore, the ability to compete for nutrients can be expected to be an important driver of changes in phytoplankton composition in the
15
stratified North Atlantic. In the present study, changes in phytoplankton groups that contributed to primary production were observed along the latitudinal gradient in N, P0–125 m. Overall, the haptophyte pigment signature was dominant in spring and sum-mer. Moreover, an inverse correlation was observed for the contribution of group 4 (dominated by haptophytes) and SST, whereas there was a positive correlation
be-20
tween SST and group 1 and 2 (cyanobacteria) in stratified stations. This suggests that increased SST will increase the contribution of less productive species, such as
Prochlorococcus, at the expense of more productive species, such as haptophytes, at
low and mid-latitudes. Furthermore, the present study also suggests that haptophytes succeed diatoms after stratification in spring at higher latitudes. Therefore, earlier
strat-25
BGD
10, 1793–1829, 2013Phytoplankton along a temperature
gradient
W. H. van de Poll et al.
Title Page
Abstract Introduction
Conclusions References
Tables Figures
◭ ◮
◭ ◮
Back Close
Full Screen / Esc
Printer-friendly Version Interactive Discussion
Discussion
P
a
per
|
Dis
cussion
P
a
per
|
Discussion
P
a
per
|
Discussio
n
P
a
per
|
4.3 Productivity modeling and assumptions
Reported productivity in the North Atlantic subtropical gyre varied between 100– 350 mg C m−2d−1(Morel et al., 1996; Mara ˇn ´on et al., 2000, 2003). Claustre et al. (2005) estimated daily primary production rates of 939±223 and 393±80 mg C m−2d−1 for
spring and summer, respectively, in the North Atlantic between 39 to 45◦N, which
5
agrees well with our estimates for this region. In the present study, N and P were not depleted in summer in the upper euphotic zone (0–50 m) of mesotrophic stations. Therefore, wind events can temporarily raise nutrient concentration in the mixed layer in summer, making nutrient limitation less evident in these stations. At mesotrophic sta-tions, reported productivity values do not show clear differences between summer and
10
spring (500–2000 mg C m−2d−1, Bury et al., 2001; Weeks et al., 1993) and compared well to our estimates.
In the present study, several assumptions were made to model primary produc-tion from field measurements. Firstly, we applied a linear temperature correcproduc-tion to total modeled productivity. Typically, growth shows temperature dependence in specific
15
oceanic phytoplankton species (Moore et al., 1995; Kulk et al., 2012). Eppley (1972) suggested that the temperature dependence of growth is exponential, with growth in-creasing with inin-creasing temperature. However, compiled carbon fixation data and lab experiments suggest a linear response of productivity within the temperature range of 13–23◦C (Behrenfeld et al., 1997; Montagnes and Franklin, 2001). Secondly, the model
20
assumes that nutrient availability is reflected by differences in phytoplankton biomass and composition. This is in line with the observation that nutrient availability does not influence Chl a specific net primary production in Dunaliella Tertiolecta (Halsey, 2011). Finally, the model assumes a sinusoidal irradiance distribution during the day and therefore does not include effects of cloud cover and/or vertical mixing. However,
25
BGD
10, 1793–1829, 2013Phytoplankton along a temperature
gradient
W. H. van de Poll et al.
Title Page
Abstract Introduction
Conclusions References
Tables Figures
◭ ◮
◭ ◮
Back Close
Full Screen / Esc
Printer-friendly Version Interactive Discussion
Discussion
P
a
per
|
Dis
cussion
P
a
per
|
Discussion
P
a
per
|
Discussio
n
P
a
per
|
not possible in the present study. Therefore, the current productivity estimates should be viewed as potential productivity estimates, rather than actual measurements. Over-all, this study showed that the model approach can expand the use of phytoplankton pigments and provided useful insight in group specific productivity.
5 Conclusions
5
Our results show an inverse relationship between phytoplankton productivity and biomass with SST for the stratified North Atlantic Ocean with SST between 13 and 23◦C. Furthermore, increasing SST was associated with a change in phytoplankton species composition from haptophytes to cyanobacteria at mid and low latitudes. Since increases in North Atlantic SST are expected for the coming decades, we expect the
10
phytoplankton to respond accordingly. Due to the exponential decline of Chla and the linear decline in productivity with increasing SST, responses to a future temperature rise are more likely to be observed in Chlathan in productivity.
Increasing SST has been suggested to mediate different effects on phytoplankton biomass in subtropical (less productivity) and sub-polar regions (increased productivity
15
due to a longer growth season) in the North Atlantic. However, our data showed highest depth integrated Chlaat higher latitude non-stratified stations in spring, suggesting that phytoplankton blooms can start under minimal stratification. This indicated that possible earlier onset of stratification (and surface blooming) would not necessarily result in a longer and more productive season. In contrast, delayed stratification may prolong the
20
BGD
10, 1793–1829, 2013Phytoplankton along a temperature
gradient
W. H. van de Poll et al.
Title Page
Abstract Introduction
Conclusions References
Tables Figures
◭ ◮
◭ ◮
Back Close
Full Screen / Esc
Printer-friendly Version Interactive Discussion
Discussion
P
a
per
|
Dis
cussion
P
a
per
|
Discussion
P
a
per
|
Discussio
n
P
a
per
|
Acknowledgements. We thank the captain and crew of R/VPelagiaand the support of NIOZ-MRF on-shore and onboard. The cruise was supported by the Research Council for Earth and Life Sciences (ALW) with financial aid from the Netherlands Organization for Scientific Research (NWO). This work is part of Stratiphyt subproject 2, (project nummer 839.08.422) subsidised by ALW/NWO.
5
References
Agawin, N. S. R., Duarte, C. M., and Agust´ı, S.: Nutrient and temperature control of the con-tribution of picophytoplankton to phytoplankton biomass and production, Limnol. Oceanogr., 45, 591–600, 2000.
Alkire M. B., Asaro, E., Lee, C., Perry, M. J., Gray, A., Cetinic, I., Briggs, N., Rehma, E., Kallin, E.,
10
Kaiser, J., and Gonz ´alez-Posada, A.: Estimates of net community production and export using high-resolution, Lagrangian measurements of O2, NO3, and POC through the evolution of a spring diatom bloom in the North Atlantic, Deep-Sea Res. Pt. I, 64, 157–174, 2012. Backhaus, J. O., Hegseth, E. N., Wehde, H., Irigoien, X., Hatten, K., and Logemann, K.:
Con-vection and primary production in winter, Mar. Ecol. Prog. Ser., 251, 1–14, 2003.
15
Baudoux, A. C., Veldhuis, M. J. W., Noordeloos, A. A. M., van Noort, G., and Brussaard, C. P. D.: Estimates of virus- vs. grazing induced mortality of picophytoplankton in the North Sea during summer, Aquat. Microb. Ecol., 52, 69–82, 2008.
Behrenfeld, M. J.: Abandoning Sverdrup’s critical depth hypothesis, Ecology, 91, 977–989, 2010.
20
Berhenfeld, M. J. and Falkowski, P. G.: Photosynthetic rates derived from satellite-based chloro-phyll concentrations, Limnol. Oceanogr., 42, 1–20, 1997.
Behrenfeld, M. J., O’Malley, R. T., Siegel, D. A., McClain, C. R., Sarmiento, J. L., Feldman, G. C., Milligan, A. J., Falkowski, P. G., Letelier, R. M., and Boss, E. S.: Climate-driven trends in contemporary ocean productivity, Nature, 444, 752–755, 2006.
25
Boss, E. and Beherenfeld, M. J.: In situ evaluation of initiation of the North Atlantic phytoplank-ton bloom, Geophys. Res. Lett., 37, 1–5, 2010.
Bouman, H. A., Ulloa, O., Barlow, R., Li, W. K. W., Platt, T., Zwirglmaier, K., and Sathyen-dranath, S.: Water-column stratification governs the community structure of subtropical ma-rine picophytoplankton, Environ. Microb. Rep., 3, 473–482, 2011.
BGD
10, 1793–1829, 2013Phytoplankton along a temperature
gradient
W. H. van de Poll et al.
Title Page
Abstract Introduction
Conclusions References
Tables Figures
◭ ◮
◭ ◮
Back Close
Full Screen / Esc
Printer-friendly Version Interactive Discussion
Discussion
P
a
per
|
Dis
cussion
P
a
per
|
Discussion
P
a
per
|
Discussio
n
P
a
per
|
Boyce, D. G., Lewis, M. R. and Worm, B.: Global phytoplankton decline over the past century, Nature, 466, 752–755, 2010.
Bricaud, A., Claustre, H., Ras, J., and Oubelkheir, K.: Natural variability of phytoplanktonic absorption in oceanic waters: influence of the size structure of algal populations, J. Geophys. Res., 109, C11010, doi:10.1029/2004JC002419, 2004.
5
Bury, S. J., Boyd, P. W., Preston, T., Gavidge, G., and Owens, N. J. P.: Size-fractionated primary production and nitrogen uptake during a North Atlantic phytoplankton bloom: implications for carbon export estimates, Deep-Sea Res. Pt. I, 48, 689–720, 2001.
Chaves, F. P., Messi ´e, M., and Pennington, J. T.: Marine primary production in relation to climate variability and change, Ann. Rev. Marine Sci., 3, 227–260, 2010.
10
Chisholm, S. W. and Morel, F. M. M.: What controls phytoplankton production in nutrient-rich areas of the open sea?, Limnol. Oceanogr., 36, 1507–1511, 1991.
Chiswell, S. M.: Annual cycles and spring blooms in phytoplankton: don’t abandon Sverdrup completely, Mar. Ecol. Prog. Ser., 443, 39–50, 2011.
Ciotti, A. M., Lewis, M. R., and Cullen, J. J.: Assessment of the relationships between
domi-15
nant cell size in natural phytoplankton communities and the spectral shape of the absorption coefficient, Limnol. Oceanogr., 47, 404–417, 2002.
Claustre, H., Babin, M., Merien, D., Ras, J., Primeur, L., Dallot, S., Prasil, O., Dousova, H., and Moutin, T.: Towards a taxon-specific parameterization of bio-optical models of pri-mary production: a case study in the North Atlantic, J. Geophys. Res., 110, C07S12,
20
doi:10.1029/2004JC002634, 2005.
Dave, A. C. and Lozier, M. S.: Local stratification control of marine productivity in the subtropical North Pacific, J. Geophys. Res., 115, 1–16, 2010.
Davey, M., Tarran, G. A., Mills, M. M., Ridame, C., Geider, R. J., and LaRoche, J.: Nutrient limi-tation of picophytoplankton photosynthesis and growth in the tropical North Atlantic, Limnol.
25
Oceanogr., 53, 1722–1733, 2008.
De Boyer Montegut, C., Madec, G., Fischer, A. C., Lazar, A., and Ludicone, D.: Mixed layer depth over the global ocean: an examination of profile data and profile-based climatology, J. Geophys. Res., 109, C12003, doi:10.1029/2004JC002378, 2004.
Drinkwater, K. F., Belgrano, A., Borja, A., Conversi, A., Edwards, M., Greene, C. H., Ottersen,
30
BGD
10, 1793–1829, 2013Phytoplankton along a temperature
gradient
W. H. van de Poll et al.
Title Page
Abstract Introduction
Conclusions References
Tables Figures
◭ ◮
◭ ◮
Back Close
Full Screen / Esc
Printer-friendly Version Interactive Discussion
Discussion
P
a
per
|
Dis
cussion
P
a
per
|
Discussion
P
a
per
|
Discussio
n
P
a
per
|
Hurrell, J. W., Kushnir, Y., Ottersen, G., Visbeck, M., American Geophysical Union, Washing-ton, DC, 211–234, 2003.
Dutkiewicz, S., Follows, M., Marshall, J., and Gregg, W. W.: Interannual variability of phyto-plankton abundances in the North Atlantic, Deep-Sea Res. Pt. II, 48, 2323–2344, 2001. Enfield, D. B., Mestas-Nu ˇnez, A. M., and Trimble, P. J.: The Atlantic multidecadal oscillation
5
and its relation to rainfall and river flows in the continental US, Geophys. Res. Lett., 28, 2077–2080, 2001.
Eppley, R. W.: Temperature and phytoplankton growth in the sea, Fish. Bull., 70, 1063–1085, 1972.
Geider, R. J., LaRoche, J., Greene, R. M., and Olaizola, M.: Response of the photosynthetic
10
apparatus of Phaeodactylum tricornutum (Bacillariophyceae) to nitrate, phosphate, or iron starvation, J. Phycol., 29, 755–766, 1993.
Gleckler, P. J., Santer, D. B., Domingues, C. M., Pierce, D. W., Barnett, T. P., Church, J. A., Taylor, K. E., Boyer, M., Ishii, M., and Caldwell, P. M.: Human-induced global ocean warming on multidecadal timescales, Nat. Clim. Change, 2, 524–529, doi:10.1038/NCLIMATE1553,
15
2012.
Gregg, W. W., Conkright, M. E., Ginoux, P., O’Reilly, J. E., and Casey, N. W.: Ocean pri-mary production and climate: global decadal changes, Geophys. Res. Lett., 30, 1809, doi:10.1029/2003GL016889, 2003.
Halsey, K. H., Milligan, A. J., and Behrenfeld, M. J.: Linking time-dependent carbon-fixation
20
efficiencies in Dunaliella Tertiolecta(Chlorophyceae) to underlying metabolic pathways, J. Phycol., 47, 66–76, 2011.
Hofmann, M., Worm, B., Rahmstorf, S., and Schellnhuber, H. J.: Declining ocean chlorophyll under unabated anthropogenic CO2emissions, Environ. Res. Lett., 6, 1–7, 2011.
Hooker, S. B., Van Heukelem, L., Thomas, C. S., Claustre, H., Ras J., Schl ¨uter, L.,
25
Clementson, L., Van der Linde, D., Eker-Develi, E., Berthon, J., Barlow, R., Sessions, H., Ismail, H., and Perl, J.: The third SeaWiFS HPLC Analysis Round-Robin Experiment (SeaHARRE-3), NASA Tech. Memo 2009–215849, NASA Goddard Space Flight Center, Greenbelt, Maryland, USA, 2009.
Johnson, Z. I., Zinser, E. R., Coe, A., McNulty, N. P., Woodward, E. M. S., and Chisholm, S. W.:
30
BGD
10, 1793–1829, 2013Phytoplankton along a temperature
gradient
W. H. van de Poll et al.
Title Page
Abstract Introduction
Conclusions References
Tables Figures
◭ ◮
◭ ◮
Back Close
Full Screen / Esc
Printer-friendly Version Interactive Discussion
Discussion
P
a
per
|
Dis
cussion
P
a
per
|
Discussion
P
a
per
|
Discussio
n
P
a
per
|
Jurado, E., van der Woerd, H. J., and Dijkstra, H. A.: Microstructure measurements along a quasi-meridional transect in the northeast Atlantic, J. Geophys. Res., 117, C04016, doi:10.1029/2011JC007137, 2012a.
Jurado, E., Dijkstra, H. A., and van der Woerd, H. J.: Microstructure observations during the spring 2011 STRATIPHYT-II cruise in the northeast Atlantic, Ocean Sci., 8, 945–957,
5
doi:10.5194/os-8-945-2012, 2012b.
Kirk, J. T. O.: Light and photosynthesis in aquatic environments, in: Advances in Photosynthesis and Respiration, vol. 5, Cambridge University Press, 321–346, 1994.
Kulk, G., van de Poll, W. H., Visser, R. J. W., and Buma, A. G. J.: Distinct differences in pho-toacclimation potential between prokaryotic and eukaryotic oceanic phytoplankton, J. Exp.
10
Mar. Biol. Ecol., 398, 63–72, 2011.
Kulk, G., de Vries, P., van de Poll, W. H., Visser, R. J. W., and Buma, A. G. J.: Temperature-dependent growth and photophysiology of prokaryotic and eukaryotic oceanic picophyto-plankton, Mar. Ecol. Prog. Ser., 466, 43–55, 2012.
Laviale, M. and Neveux, J.: Relationships between pigment ratios and growth irradiance in 11
15
marine phytoplankton species, Mar. Ecol. Prog. Ser., 425, 63–77, 2011.
Li, W. K. W.: Primary production of prochlorophytes, cyanobacteria, and eukaryotic ultraphyto-plankton measurements from flowcytometric sorting, Limnol. Oceanogr., 39, 169–175, 1994. Litchman, E., Klausmeier, C. A., Schofield, O. M., and Falkowski, P. G.: The role of functional
traits and trade-offs in structuring phytoplankton communities: scaling from cellular to
ecosys-20
tem level, Ecol. Lett., 10, 1170–1181, 2007.
Lozier, S. M., Dave, A. C., Palter, J. B., Geber, L. M., and Barber, R. T.: On the relationship between stratification and primary production in the North Atlantic, Geophys. Res. Lett., 38, 1–6, 2011.
Mackey, M. D., Higgins, H. W., Mackey, D. J., and Wright, S. W.: CHEMTAX – a program for
25
estimating class abundances from chemical markers: application to HPLC measurements of phytoplankton, Mar. Ecol. Prog. Ser., 144, 265–283, 1996.
Mahadevan A., D’Asaro, E. D., Lee, C., and Perry, M. J.: Eddy-driven stratification initiates North Atlantic spring phytoplankton blooms, Science, 337, 54–58, 2012.
Mara ˇn ´on, E., Patrick, H., Holligan, M. M., Varela, B., Mourin, A. J., and Bale Maran, E.:
Basin-30
BGD
10, 1793–1829, 2013Phytoplankton along a temperature
gradient
W. H. van de Poll et al.
Title Page
Abstract Introduction
Conclusions References
Tables Figures
◭ ◮
◭ ◮
Back Close
Full Screen / Esc
Printer-friendly Version Interactive Discussion
Discussion
P
a
per
|
Dis
cussion
P
a
per
|
Discussion
P
a
per
|
Discussio
n
P
a
per
|
Mara ˇn ´on, E., Behernfeld, M. J., Gonz ´alez, N., Mouri ˇno, B., and Zubkov, M. V.: High variability of primary production in oligotrophic waters of the North Atlantic Ocean: uncoupling from phytoplankton biomass and size structure, Mar. Ecol. Prog. Ser., 257, 1–11, 2003.
Martin, P., Lampitt, R. S., Perry, M. J., Sanders, R., Lee, C., and D’Asaro, E.: Export and mesopelagic particle flux during a North Atlantic spring diatom bloom, Deep-Sea Res. Pt.
5
I, 58, 338–349, 2011.
Mojica, K. D. A., van de Poll, W. H., Kehoe, M., Witte, H., and Brussaard C. P. D.: Impact of strat-ification on phytoplankton biogeography in the Northeast Atlantic Ocean, Limnol. Oceanogr., submitted, 2013.
Montagnes, D. J. S. and Franklin, D. J.: Effect of temperature on diatom volume, growth rate,
10
and carbon and nitrogen content: reconsidering some paradigms, Limnol. Oceanogr., 46, 2008–2018, 2001.
Moore, C. M., Mills, M. M., Langois, R., Milne, A., Achterberg, E. P., LaRoche, J., and Gei-der, R. J.: Relative influence of nitrogen and phosphorous availability on phytoplankton physiology and productivity in the oligotrophic sub-tropical North Atlantic Ocean, Limnol.
15
Oceanogr., 53, 291–305, 2008.
Moore, L. R., Goericke, R., and Chisholm, S. W.: Comparative physiology ofSynechococcus andProchlorococcus: influence of light and temperature on growth, pigments, fluorescence and absorptive properties, Mar. Ecol. Prog. Ser., 116, 259–275, 1995.
Morel A., Antoine, D., Babin, M., and Dandonneau, Y.: Measured and modeled primary
produc-20
tion in the northeast Atlantic (EUMELI JGOFS program): the impact of natural variations in photosynthetic parameters on model predictive skill, Deep-Sea Res. Pt. I, 43, 1272–1304, 1996.
Platt, T., Gallegos, C. L., Harrison, W. G.: Photoinhibition of photosynthesis in natural assem-blages of marine-phytoplankton, J. Mar. Res., 38, 687–701, 1980.
25
Polovina, J. J., Howell, E. A., Abecassis, M.: Ocean’s least productive waters are expanding, Geophys. Res. Lett., 35, L03619, doi:10.1029/2007GL031745, 2008.
Racault, M. F., Le Qu ´er ´e, C. Buitenhuis, E., Sathyendranath, S., and Platt T.: Phytoplankton phenology in the global ocean, Ecol. Indic., 14, 152–163, 2012.
Richardson, A. J. and Schoeman, D. S.: Climate impact on plankton ecosystems in the
North-30
east Atlantic, Science, 305, 1609–1612, 2004.
BGD
10, 1793–1829, 2013Phytoplankton along a temperature
gradient
W. H. van de Poll et al.
Title Page
Abstract Introduction
Conclusions References
Tables Figures
◭ ◮
◭ ◮
Back Close
Full Screen / Esc
Printer-friendly Version Interactive Discussion
Discussion
P
a
per
|
Dis
cussion
P
a
per
|
Discussion
P
a
per
|
Discussio
n
P
a
per
|
Steinacher, M., Joos, F., Fr ¨olicher, T. L., Bopp, L., Cadule, P., Cocco, V., Doney, S. C., Gehlen, M., Lindsay, K., Moore, J. K., Schneider, B., and Segschneider, J.: Projected 21st century decrease in marine productivity: a multi-model analysis, Biogeosciences, 7, 979– 1005, doi:10.5194/bg-7-979-2010, 2010.
Sverdrup, H.: On conditions of vernal blooming of phytoplankton, J. Conseil, 18, 287–295,
5
1953.
Tassan, T. and Ferrari, G. M.: Proposal for the measurement of backscatter and total scattering by mineral particles suspended in water, Appl. Optics, 34, 8345–8353, 1995.
Taylor, J. and Ferrari, R.: Shutdown of turbulent convection as a new criterion for the onset of spring phytoplankton blooms, Limnol. Oceanogr., 56, 2293–2307, 2011.
10
Ting, M., Kushnir, Y., Seager, R., and Li, C.: Forced and internal twentieth-century SST trends in the North Atlantic, J. Climate, 22, 1469–1481, 2009.
Uitz, J., Huot, Y., Bruyant, F., Babin, M., and Claustre, H.: Relating phytoplankton photophysi-olofical properties to community structure on large scales, Limnol. Oceanogr., 53, 614–630, 2008.
15
Uitz, J., Claustre, H., Gentili, B., and Stramski, D.: Phytoplankton class-specific primary produc-tion in the world’s oceans: seasonal and interannual variability from satellite observaproduc-tions, Global Biogeochem. Cy., 24, 1–19, 2010.
Weeks, A., Conte, H. M., Harris, R. P., Bedo, A., Bellan, I., Burkhill, P. H., Edwards, E. S., Habour, D. S. Kennedy, H., Llewellyn, C., Mantoura, R. F. C., Morales, C. E., Pomroy, A. J.,
20
and Turley, C. M.: The physical and chemical environment and changes in community struc-ture associated with bloom evolution: the Joint Global Flux Study North Atlantic Bloom Ex-periment, Deep-Sea Res. Pt. II, 40, 347–368, 1993.
Zapata, M., Jeffrey, S. M., Wright, S. M., Rodriguez, F., Garrido, J. L., and Clementson, L.: Pho-tosynthetic pigments in 37 species (65 strains) of Haptophyta: implications for oceanography
25
BGD
10, 1793–1829, 2013Phytoplankton along a temperature
gradient
W. H. van de Poll et al.
Title Page
Abstract Introduction
Conclusions References
Tables Figures
◭ ◮
◭ ◮
Back Close
Full Screen / Esc
Printer-friendly Version Interactive Discussion
Discussion
P
a
per
|
Dis
cussion
P
a
per
|
Discussion
P
a
per
|
Discussio
n
P
a
per
|
Table 1.Spearman rank order correlation coefficients of sea surface temperature (SST) and density differences in the upper 200 m (density), between nitrate (N) and inorganic phosphate (P) concentration in the potential euphotic zone (0–125 m). Data are shown for spring and summer cruises (n=32) and for stratified (n=52) and non-stratified (n=12) stations from both cruises combined. Significant correlations are bold.
Spring Summer Stratified Non-stratified
SST density SST density SST density SST density