BGD
10, 4969–4993, 2013N2O production in a
monomictic south-alpine lake
C. V. Freymond et al.
Title Page
Abstract Introduction
Conclusions References
Tables Figures
◭ ◮
◭ ◮
Back Close
Full Screen / Esc
Printer-friendly Version
Interactive Discussion
Discussion
P
a
per
|
Dis
cussion
P
a
per
|
Discussion
P
a
per
|
Discussio
n
P
a
per
|
Biogeosciences Discuss., 10, 4969–4993, 2013 www.biogeosciences-discuss.net/10/4969/2013/ doi:10.5194/bgd-10-4969-2013
© Author(s) 2013. CC Attribution 3.0 License.
Open Access
Biogeosciences
Discussions
Geoscientiic Geoscientiic
Geoscientiic Geoscientiic
This discussion paper is/has been under review for the journal Biogeosciences (BG). Please refer to the corresponding final paper in BG if available.
NO
x
reduction is the main pathway for
benthic N
2
O production in a eutrophic,
monomictic south-alpine lake
C. V. Freymond1,*, C. B. Wenk1, C. H. Frame1, and M. F. Lehmann1
1
Department of Environmental Sciences, University of Basel, Bernoullistrasse 30, 4056 Basel, Switzerland
*
now at: Institute of Geology, ETH Z ¨urich, Sonneggstrasse 5, 8092 Z ¨urich, Switzerland
Received: 18 February 2013 – Accepted: 4 March 2013 – Published: 12 March 2013
Correspondence to: C. V. Freymond ([email protected]) and M. F. Lehmann ([email protected])
BGD
10, 4969–4993, 2013N2O production in a
monomictic south-alpine lake
C. V. Freymond et al.
Title Page
Abstract Introduction
Conclusions References
Tables Figures
◭ ◮
◭ ◮
Back Close
Full Screen / Esc
Printer-friendly Version
Interactive Discussion
Discussion
P
a
per
|
Dis
cussion
P
a
per
|
Discussion
P
a
per
|
Discussio
n
P
a
per
|
Abstract
Nitrous oxide (N2O) is a potent greenhouse gas, generated through microbial nitrogen
(N) turnover processes, such as nitrification, nitrifier denitrification, and denitrification. Previous studies quantifying natural sources have mainly focused on soils and the
ocean, but the potential role of terrestrial water bodies in the global N2O budget has
5
been widely neglected. Furthermore, the biogeochemical controls on the production
rates and the microbial pathways that produce benthic N2O in lakes are essentially
un-known. In this study, benthic N2O fluxes and the contributions of the microbial pathways
that produce N2O were assessed using
15
N label flow-through sediment incubations in the eutrophic, monomictic south basin of Lake Lugano in Switzerland. The sediments 10
were a significant source of N2O throughout the year, with production rates ranging
between 140 and 2605 nmol N2O h
−1
m−2, and the highest observed rates coinciding
with periods of water column stratification and stably anoxic conditions in the
overly-ing bottom water. Nitrate (NO−3) reduction via denitrification was found to be the major
N2O production pathway in the sediments under both depleted and
oxygen-15
replete conditions in the overlying water, while ammonium oxidation did not significantly
contribute to the benthic N2O flux. A significant portion (up to 15 %) of the total NO
−
3
consumed by denitrification was reduced only to N2O, without complete denitrification
to N2. These fluxes were highest when the bottom water had completely stabilized to
a low-oxygen state, in contrast with the notion that stable anoxia is particularly con-20
ducive to complete denitrification without accumulation of N2O. This study provides
evidence that lake sediments are a significant source of N2O to the overlying water
and may produce large N2O fluxes to the atmosphere during seasonal mixing events.
1 Introduction
Nitrous oxide (N2O) is a potent greenhouse gas with a global warming potential that is
25
∼300 times higher than that of CO
BGD
10, 4969–4993, 2013N2O production in a
monomictic south-alpine lake
C. V. Freymond et al.
Title Page
Abstract Introduction
Conclusions References
Tables Figures
◭ ◮
◭ ◮
Back Close
Full Screen / Esc
Printer-friendly Version
Interactive Discussion
Discussion
P
a
per
|
Dis
cussion
P
a
per
|
Discussion
P
a
per
|
Discussio
n
P
a
per
|
Furthermore, N2O is the most important stratospheric ozone-depleting substance
cur-rently being emitted to the atmosphere (Ravishankara et al., 2009). The atmospheric concentration has increased from 270 ppb in 1750 (Forster et al., 2007) to 323 ppb in 2011 (AGAGE, 2012), but there are still large uncertainties with regard to the relative contributions of the major sources and sinks (Forster et al., 2007). Microbiological pro-5
cesses in soils and the ocean are the most important natural N2O sources (Forster
et al., 2007). However, the recent increase in atmospheric N2O concentration is largely
due to human intervention in the nitrogen cycle, in particular through the agricultural use of synthetic nitrogen-based fertilizers (Codispoti et al., 2001; Bouwman et al., 2002; Mosier et al., 1998). In aquatic systems, anthropogenic fixed nitrogen (N) loading can 10
have multiple detrimental environmental effects, such as eutrophication, acidification,
and the reduction of biodiversity (Galloway et al., 2003). In these environments, micro-bial processes taking place in redox transition zones play an important role in removing fixed N. Denitrification, for example, can be an important mechanism for removing fixed
N along the land-ocean continuum by reducing it back to N2. N2O is a free intermediate
15
in this process that may be released to the environment under certain conditions. N2O
is also produced during other N transformation reactions (Galloway et al., 2003) such as nitrification (specifically, ammonia oxidation) and nitrifier denitrification.
Distinguishing the relative contributions of each of these major N2O production and
consumption pathways to the total N2O flux is often challenging in aquatic systems
20
because different types of microorganisms perform these pathways under overlapping
environmental conditions. Furthermore, certain microbes carry out more than one
path-way in response to changes in biogeochemical conditions. N2O is produced during the
aerobic oxidation of ammonium (NH+4) to nitrite (NO−2) when hydroxylamine (NH2OH),
an intermediate in the reaction, decomposes (Stein, 2011). Rates of ammonia oxida-25
tion depend primarily on substrate (NH+4) and oxygen (O2) availability (Ward, 2008).
However, in sediments, aerobic ammonia oxidation and nitrite oxidation to nitrate can
be closely coupled to anaerobic NO−3 reduction in the redox transition zone (coupled
BGD
10, 4969–4993, 2013N2O production in a
monomictic south-alpine lake
C. V. Freymond et al.
Title Page
Abstract Introduction
Conclusions References
Tables Figures
◭ ◮
◭ ◮
Back Close
Full Screen / Esc
Printer-friendly Version
Interactive Discussion
Discussion
P
a
per
|
Dis
cussion
P
a
per
|
Discussion
P
a
per
|
Discussio
n
P
a
per
|
a second mechanism known as nitrifier denitrification, an enzymatic pathway that
se-quentially reduces NO−
2 to nitric oxide (NO), and then N2O (Wrage et al., 2001). The
importance of nitrifier denitrification as a N2O source appears to be higher under
low-O2 conditions (Ritchie and Nicholas, 1972; Poth and Focht, 1985). However, unlike
denitrification, O2 does not seem to inhibit nitrifier denitrification to the same extent or
5
through the same mechanisms (Kool et al., 2011). Denitrification is the reduction of
NO−3 to N2via the gaseous intermediates NO and N2O (Knowles, 1982) under anoxic
or suboxic conditions (i.e. [O2]<2–5 µmol L−1
, Devol, 2008; Codispoti et al., 2001).
Denitrification can both produce and consume dissolved N2O, releasing N2O under
conditions that suppress the activity of the N2O reductase enzyme, e.g. under low O2
10
concentrations (Firestone et al., 1979; Otte et al., 1996). Furthermore, rapid transitions between oxic and suboxic conditions may cause “stop and go” denitrification, which
causes N2O accumulation in aquatic environments (Naqvi et al., 2000; Codispoti et al.,
2001).
In lacustrine sediments, microbial activity consumes O2 rapidly in the topmost
mil-15
limeters, leading to suboxic or anoxic conditions in deeper sediment horizons, where denitrification becomes an important redox process (Hunting and van der Geest, 2011).
The O2 penetration depth is closely related to the O2 concentration in the overlying
water and the sediment reactivity (Lehmann et al., 2009; Thibodeau et al., 2010). A
de-crease in bottom water O2concentration is reflected in a narrower oxygenated zone in
20
the sediment (Rasmussen and Jorgensen, 1992). Narrow redox zonation leads thus to an equally narrow succession of microbial processes (Stockdale et al., 2009). Changes
in the redox zonation may have profound consequences on N2O production (Otte et al.,
1996). Seasonal cycles of water column mixing and stagnation can influence the oxida-tion state of surface sediments and modulate the penetraoxida-tion of redox boundaries into 25
the sediments, potentially changing the redox environments of nitrifiers and denitrifiers
(Rasmussen and Jorgensen, 1992). The few studies that have quantified N2O fluxes
from freshwater sediments, indicate that lake sediments can be a significant source
BGD
10, 4969–4993, 2013N2O production in a
monomictic south-alpine lake
C. V. Freymond et al.
Title Page
Abstract Introduction
Conclusions References
Tables Figures
◭ ◮
◭ ◮
Back Close
Full Screen / Esc
Printer-friendly Version
Interactive Discussion
Discussion
P
a
per
|
Dis
cussion
P
a
per
|
Discussion
P
a
per
|
Discussio
n
P
a
per
|
benthic environment are still not clearly identified, particularly with regard to the rela-tive importance of nitrification, nitrifier denitrification, and denitrification (Mengis et al., 1996; Liikanen and Martikainen, 2003; Liikanen et al., 2003b; McCrackin and Elser, 2010).
In this study, N2O production pathways in lacustrine sediments were studied using
5
ex situ steady state flow-through incubations with intact sediment cores (Lavrentyev et al., 2000; McCarthy et al., 2007; Liikanen and Martikainen, 2003; Liikanen et al.,
2002a,b,c, 2003a,b) in combination with substrate15N labeling to assess benthic N2O
production rates and pathways. The experiments were conducted with sediments from a eutrophic, monomictic lake in southern Switzerland, the south basin (SB) of Lake 10
Lugano. Monomixis and the resulting intermittent anoxia and suboxia of the bottom
waters makes the SB an ideal study site for testing the effects of variable bottom
wa-ter oxygenation on the benthic N2O production in a lake. Furthermore, previous
mea-surements (Wenk, 2013) indicate high bottom water N2O accumulation in the deep
hypolimnion during thermal stratification in summer and fall, begging the question as 15
to what causes N2O accumulation in near bottom waters. Upon water column overturn
in winter, N2O-laden bottom waters may be advected to the surface, enhancing N2O
fluxes into the atmosphere.
The study’s objectives were (1) to estimate N2O fluxes from the sediments to the
overlying water column and to assess seasonal variations in these fluxes, (2) to iden-20
tify the dominant benthic N2O producing processes in the lake, and (3) to study the
possible impact of variable redox conditions of bottom waters during the seasonal
BGD
10, 4969–4993, 2013N2O production in a
monomictic south-alpine lake
C. V. Freymond et al.
Title Page
Abstract Introduction
Conclusions References
Tables Figures
◭ ◮
◭ ◮
Back Close
Full Screen / Esc
Printer-friendly Version
Interactive Discussion
Discussion
P
a
per
|
Dis
cussion
P
a
per
|
Discussion
P
a
per
|
Discussio
n
P
a
per
|
2 Sampling and methods
2.1 Site description
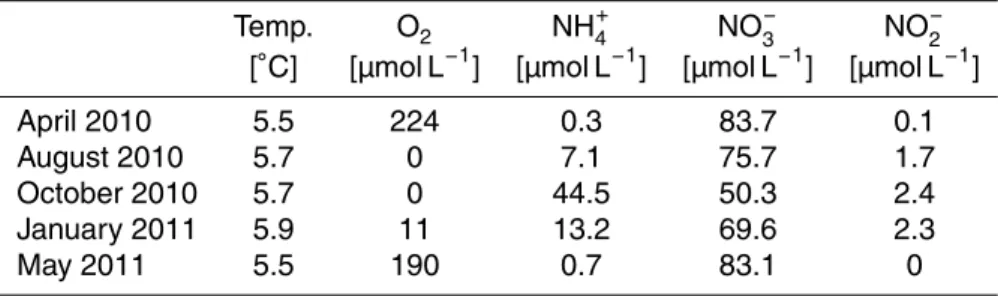
Lake Lugano is located in southern Switzerland/northern Italy at an altitude of 271 m above sea level (Fig. 1). It is divided into two main basins, the northern and southern basin. In addition, a smaller sub-basin of the southern basin is located in front of the 5
only outlet, the Tresa River (Barbieri and Polli, 1992; Lehmann et al., 2004a). Due to the limited water exchange, the basins are characterized by a distinct limnology, so that the northern and southern basins can be regarded as two separate lake systems that are connected by a narrow opening at Melide. A detailed overview of the lake’s limnology can be found in Barbieri and Polli (1992) and Barbieri and Simona (2001). 10
The SB mixes completely from January/February to April. It has an area of 20.3 km2,
a volume of 1.14 km3and a maximum depth of 95 m (Barbieri and Polli, 1992).
Lazzaretti and Hanselmann (1992) and Lehmann et al. (2004a,b) described in de-tail the changes in seasonal redox conditions in the southern basin. During the mixing period, the whole water column becomes oxygenated and oxic conditions are found at 15
the sediment/water interface until late spring. With the onset of thermo-stratification, generally in April, together with the increased phytoplankton production in surface wa-ters and organic matter export to the hypolimnion, oxygen concentrations in the deep hypolimnion decrease, and by June/July, the redox transition zone has migrated from within the sediments by several meters into the water column. Complete anoxia prevails 20
in the bottom waters until the water column turns over again in winter.
2.2 Sampling
Six∼50 cm sediment cores with 20 cm overlying bottom water were taken with a 5.7 cm
diameter mini gravity corer at a site (45◦57′N, 8◦54′E) west of the village of Figino,
close to the point of maximum water depth of this basin (Fig. 1) in 2010 (April, Au-25
BGD
10, 4969–4993, 2013N2O production in a
monomictic south-alpine lake
C. V. Freymond et al.
Title Page
Abstract Introduction
Conclusions References
Tables Figures
◭ ◮
◭ ◮
Back Close
Full Screen / Esc
Printer-friendly Version
Interactive Discussion
Discussion
P
a
per
|
Dis
cussion
P
a
per
|
Discussion
P
a
per
|
Discussio
n
P
a
per
|
during transport to the home laboratory on the day of sampling. In addition, 3×20 L
of bottom water were sampled using 10 L Niskin bottles. Bottom waters were stored in open 20 L plastic containers with headspace for samples taken during oxic con-ditions (April 2010, May 2011). During thermal stratification and anoxia in the deep hypolimnion, bottom waters were filled into gastight 25 L bags (Gas Sampling Tedlar 5
Bags, CEL Scientific Corporation, ITP-25) without headspace. In order to minimize the
risk of O2 contamination, only the lower three quarters of the Niskin bottle contents
were used, and in October 2010 and January 2011, the bags were additionally stored underwater. Within approximately 6 h from sampling and after transportation to the lab, the flow-through experiments were set up in a cold room at a near-in situ temperature 10
(6.5◦
C).
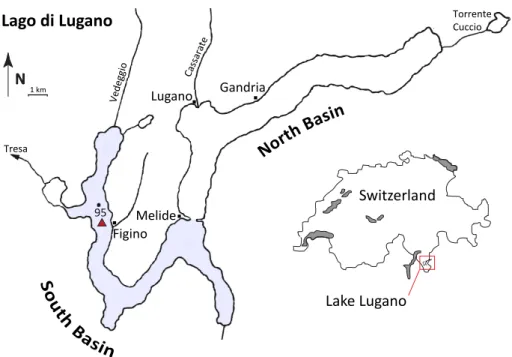
2.3 Steady state flow-through experiments
Steady state flow-through experiments were set up according to Gardner et al. (1991) and Lavretyev et al. (2000) (Fig. 2). The top caps on the liners were removed and re-placed with gastight, O-ring sealed PVC plungers containing two holes. The plungers 15
were lowered into the liners until all headspace air was released through the holes. Subsequently, the inlet water reservoir was connected to the core with gastight tubes (FEP, 0.8 mm inner diameter). A second tube connected the core with the sampling
vial. A constant flow of∼1 mL min−1was established with a peristaltic pump. For each
sampling campaign, three duplicate flow-through experiments were set up, where two 20
core incubations were supplied with water from one inlet water reservoir, respectively.
One of the three inlet water reservoirs was amended with15N-NH+4 (Ammonium
Chlo-ride,>99 %15N atom, Spectra Stable Isotopes), one with15N-NO−3 (Potassium Nitrate,
>99 %15N atom, Spectra Stable Isotopes) and one was left unamended as a control.
The labeled substrates were added so that the in situ concentrations were doubled 25
BGD
10, 4969–4993, 2013N2O production in a
monomictic south-alpine lake
C. V. Freymond et al.
Title Page
Abstract Introduction
Conclusions References
Tables Figures
◭ ◮
◭ ◮
Back Close
Full Screen / Esc
Printer-friendly Version
Interactive Discussion
Discussion
P
a
per
|
Dis
cussion
P
a
per
|
Discussion
P
a
per
|
Discussio
n
P
a
per
|
background NH+4 concentration was <1 µmol L−1 and 10 µmol L−1 of 15N-NH+4 label
was added (final15N content>90 %).
After a conditioning period of>24 h (Gardner and McCarthy, 2009), the in- and
out-flows were sampled daily. The presented results are the average of 2 (August 2010) or 3 incubation days (October 2010, January 2011, May 2011). In April 2010, samples for 5
N2O analysis were only taken on the last day of the experiment.
For N2O analyses, glass vials (21 mL) were filled from bottom to top, and allowed
to overflow for at least two bottle volumes to minimize N2O exchange with air. The
vials were capped with aluminium crimp caps with silicone septa (CS chromatographie service GmbH, Art. Nr. 300227). Subsequently, a 10 mL He headspace was added in 10
exchange with water. The samples were sterilized with 0.2 mL of 10 mol L−1 NaOH to
prevent further microbial activity (Sigman et al., 2001). Sample treatment was done within one hour after sampling. After adding NaOH, the samples were analyzed within 3 days.
2.4 Determination of N2O concentrations and benthic fluxes
15
N2O concentrations and stable isotope ratios were determined using an isotope
ra-tio mass spectrometer (IRMS, Thermo Finnigan Deltaplus XP), coupled to an
au-tomated purge and trap system (Thermo Finnigan GasBench II). N2O concentration
standards were produced using the denitrifier method (Sigman et al., 2001) to reduce
NO−3 to N2O. Six KNO3 solutions were produced to yield the following N2O
concen-20
tration standards: 0.03, 0.1, 0.2, 0.5, 1.0, 1.5 nmol N2O mL
−1
. Detector-sensitivity
cor-rected IRMS peak areas of N2O standards were compared to the respective
concentra-tions in a regression analysis, and the resulting transfer function was used to calculate
the N2O concentrations (in nmol L
−1
) based on the M/z 44, 45 and 46 detector
sig-nals. These correspond to the [14N14N16O], [14N15N16O +15N14N16O+ 14N14N17O],
25
and [15N15N16O+14N14N18O+14N15N17O+15N14N17O] isotopologues, respectively.
BGD
10, 4969–4993, 2013N2O production in a
monomictic south-alpine lake
C. V. Freymond et al.
Title Page
Abstract Introduction
Conclusions References
Tables Figures
◭ ◮
◭ ◮
Back Close
Full Screen / Esc
Printer-friendly Version
Interactive Discussion
Discussion
P
a
per
|
Dis
cussion
P
a
per
|
Discussion
P
a
per
|
Discussio
n
P
a
per
|
[15N15N16O]≫[14N14N18O+14N15N17O+15N14N17O], and we therefore assume that
any changes in the contributions of the natural abundance18O and17O isotopologues
were negligible.
Fluxes of N2O of masses 44, 45 and 46 [nmol h
−1
m−2] from the sediment to the water
column were then calculated from the concentration changes in the in- and out-flowing 5
water:
FluxN2O=
N2Oout
−N2O
in
×Q
A (1)
where [N2Oout/in] are the measured N2O concentrations (nmol L
−1
), Qis the average
flow rate (L h−1) andAis the sediment core surface area (m2). Positive fluxes indicate
10
a net increase in N2O concentration between the in- and out-flowing water, and thus
fluxes out of the sediments.
3 Results
3.1 Water column characteristics
The physical and chemical bottom water parameters at the five sampling dates are pre-15
sented in Table 1. In March and April 2010, the water column was well mixed so that
bottom waters were fully oxygenated, the NH+4 concentration was low (0.3 µmol L−1
)
and the NO−3 concentration was comparatively high (83.7 µmol L−1). By August 2010,
the lake was stratified, an anoxic near-bottom layer of about 2 m width had developed,
and the NH+4 concentration in the bottom water had risen (7.1 µmol L−1
). In October 20
2010, with ongoing stratification and organic matter decomposition, the anoxic
bot-tom layer expanded by another 6 to 7 m into the water column. NO−2 (2.4 µmol L−1) as
well as NH+4 (44.5 µmol L−1) accumulated in the bottom water, but NO−3 concentrations
(50.3 µmol L−1) decreased. In January 2011, samples were collected right at the
begin-ning of the winter overturn. The O2gradient started to collapse, and suboxic to hypoxic
BGD
10, 4969–4993, 2013N2O production in a
monomictic south-alpine lake
C. V. Freymond et al.
Title Page
Abstract Introduction
Conclusions References
Tables Figures
◭ ◮
◭ ◮
Back Close
Full Screen / Esc
Printer-friendly Version
Interactive Discussion
Discussion
P
a
per
|
Dis
cussion
P
a
per
|
Discussion
P
a
per
|
Discussio
n
P
a
per
|
concentrations of O2(11 µmol L
−1
) were measured in bottom waters. In May 2011, the water column was fully oxygenated again.
3.2 Benthic N2O fluxes
Net benthic N2O fluxes were calculated for the total N2O as well as the
unla-beled (14N14N16O), the singly- (14N15N16O,15N14N16O), and the doubly-labeled N2O
5
(15N15N16O) according to Eq. (1) (Fig. 3).
In almost all incubations, except in January 2011, average N2O fluxes were positive,
indicating that sediments released N2O to the overlying water column. N2O flux
mea-surements in unamended cores (core 1 and core 2), which represent N2O fluxes under
in situ NO−3 and NH+4 concentration conditions, increased from 831 and 140 nmol N2O
10
h−1
m−2
in April 2010 to 2426 and 2605 nmol N2O h−1
m−2
in October 2010. In January
and May 2011, average N2O fluxes were again relatively low (202 and 195 nmol N2O
h−1m−2 in January 2011 and 178 and 189 nmol N2O h
−1
m−2 in May 2011 for core 1
and core 2, respectively).
Overall, total N2O fluxes calculated from unamended cores showed strong
varia-15
tion between different months and between duplicate cores. In April and August 2010
the difference between the N2O fluxes of the replicate cores was most pronounced
(difference ∼ 700 and∼850 nmol N
2O h
−1
m−2
, respectively) probably reflecting the heterogeneity of the sediments (Fig. 3).
3.3 15N-N
2O recovery from the15N labeling experiments
20
15
N-label was detected as15N-N2O for all
15
N-NO−3 labeled sediment cores (Fig. 3).
Generally,15N-N2O fluxes in the15N-NH+4 labeled cores did not exceed natural
abun-dance levels. Total N2O fluxes in cores with
15
N-NH+4 and 15N-NO−3 additions were
BGD
10, 4969–4993, 2013N2O production in a
monomictic south-alpine lake
C. V. Freymond et al.
Title Page
Abstract Introduction
Conclusions References
Tables Figures
◭ ◮
◭ ◮
Back Close
Full Screen / Esc
Printer-friendly Version
Interactive Discussion
Discussion
P
a
per
|
Dis
cussion
P
a
per
|
Discussion
P
a
per
|
Discussio
n
P
a
per
|
in NH+4 or NO−3 concentrations. Enhanced N2O fluxes in
15
N-NO−3 labeled cores with
respect to control cores were only observed in April 2010.
4 Discussion
4.1 The sediments are a net source of N2O throughout the year
Lacustrine sediments are a known source of N2O (McCrackin and Elser, 2010; Liikanen
5
and Martikainen, 2003; Mengis et al., 1996). The N2O fluxes reported here ranged
be-tween 140 nmol N2O h
−1
m−2(April 2010) and 1115 nmol N2O h
−1
m−2(August 2010),
and were comparable to measurements reported previously for other eutrophic lakes. However, the October 2010 sampling stands out, with an exceptionally high
produc-tion rate of 2605 nmol N2O h
−1
m−2. Mengis et al. (1996), for example, measured net
10
benthic N2O fluxes of 458–542 nmol N2O h−1m−2 at the bottom of the artificially
oxy-genated Lake Baldegg in static chamber experiments. Liikanen and Martikainen (2003)
used microcosm incubation experiments with intact sediment cores to measure N2O
fluxes of up to 317 nmol N2O h
−1
m−2 in a eutrophic lake in Finland. McCrackin and
Elser (2010) reported an average N2O flux of 550 nmol N2O h−1
m−2
in Norwegian 15
lakes.
Comparison of the total N2O fluxes from unamended cores (Fig. 3) to the NH+4 or
NO−3 amended cores shows no obvious stimulation of N2O production pathways. This
suggests that the in situ microbial processes were not substrate-limited so that the rates
presented here are real rather than potential rates. The expectation that net N2O fluxes
20
vary seasonally, with potential links to water column stratification and oxygenation, was
partially supported. Total N2O fluxes increased during the stagnation period with
in-creasing anoxia from August to October 2010, when maximal values were reached.
Such high sedimentary N2O production during stratification can lead to accumulation
BGD
10, 4969–4993, 2013N2O production in a
monomictic south-alpine lake
C. V. Freymond et al.
Title Page
Abstract Introduction
Conclusions References
Tables Figures
◭ ◮
◭ ◮
Back Close
Full Screen / Esc
Printer-friendly Version
Interactive Discussion
Discussion
P
a
per
|
Dis
cussion
P
a
per
|
Discussion
P
a
per
|
Discussio
n
P
a
per
|
beginning of water column overturn in January 2011, together with the breakdown
of the O2 gradient, small amounts of O2 (11 µmol L−1
O2) were measured in bottom
waters, and only low benthic N2O fluxes were observed. The fact that more reduced
conditions during stratification foster N2O production, and that O2seems to hinder
ben-thic N2O production, implies denitrification as the dominant N2O production pathway
5
(see below). It has been suggested that the rapid injection of small quantities of O2into
O2-deficient environments may be conducive to N2O release by denitrifiers (Codispoti
et al., 2001). However, our results indicate that N2O production rates were in fact very
low during the initial phase of the destratification period (January 2011), the period
when pulses of O2-laden bottom waters would have been expected to cause this type
10
of perturbation of the denitrifiers’ redox environment. Rather, the reduced N2O
produc-tion in January 2011 suggests that the introducproduc-tion of low concentraproduc-tions of O2may, in
fact, inhibit N2O release.
We cannot rule out the possibility that other factors besides O2 also impacted the
activity of denitrifying bacteria. The likelihood of such impacts is raised by the fact that 15
N2O fluxes during the fully oxic April 2010 incubation were relatively high and
com-parable to those observed in the anoxic August 2010 incubation. Furthermore, fluxes were low in May 2011, when the water was still well-oxygenated. Still, although we
cannot identify a direct relationship between N2O production and bottom water
oxy-genation, additional measurements at a higher temporal and spatial resolution could 20
shed light on the impact of O2concentration fluctuations on a much smaller scale, e.g.
daily fluctuations (Bartoli et al., 2003), or spatial differences leading to sediment core
heterogeneity (Principi et al., 1994; Svensson and Leonardson, 1996). In addition, the impact of the availability of reducing substrates like organic carbon or sulfide (Wenk et al., 2013) that may also influence the activity of denitrifiers in the sediments remains 25
an open question. Finally, the process of nitrifier denitrification may also produce N2O
in the presence of NO−
2 and small amounts of O2 (as low as 5 µmol L
−1
, Frame and
Casciotti, 2010). While we did not observe the incorporation of15N from 15NH+4 into
BGD
10, 4969–4993, 2013N2O production in a
monomictic south-alpine lake
C. V. Freymond et al.
Title Page
Abstract Introduction
Conclusions References
Tables Figures
◭ ◮
◭ ◮
Back Close
Full Screen / Esc
Printer-friendly Version
Interactive Discussion
Discussion
P
a
per
|
Dis
cussion
P
a
per
|
Discussion
P
a
per
|
Discussio
n
P
a
per
|
under conditions that stimulate their nitrifier denitrification pathway. As a result, as long
as there is a source of NO−
2 (e.g. denitrification) nitrifier denitrification could be an
im-portant source of N2O even if O2-limitation has slowed the overall rate of ammonia
oxidation (and therefore the rate of N2O production via NH2OH decomposition).
4.2 Denitrification is the main N2O producing process in the sediment
5
Significant15N-N2O recovery was only observed in the overlying water of the
15
N-NO−3
labeled cores, but not in the15N-NH+4 labeled cores (Fig. 3), suggesting that
denitrifi-cation is the predominant N2O production pathway in the Lake Lugano SB sediments.
Even in April 2010 and May 2011, when the sediment/water interface was fully
oxy-genated and nitrification was likely to occur (Ward, 2008), N2O production during
am-10
monia oxidation was not observed. Therefore, it is very likely that canonical anoxic
denitrification is the main source of N incorporated into the N2O produced during the
incubations. Rapid oxygen consumption supported by high rates of organic matter input to the sediments can reduce the oxygen penetration depth into the sediments, produc-ing conditions favorable to denitrification close to the sediment/water interface (Li et al., 15
2007). It is not clear whether canonical denitrifiers carry out all of the steps involved in
reducing NO−3 to N2O. Although NO
−
3 cannot serve in the place of NO
−
2 as an electron
acceptor during nitrifier denitrification, we cannot rule out the possibility that proximate
denitrification supplies NO−2 to ammonia oxidizers that then convert it to N2O during
ni-trifier denitrification. Distinguishing between N2O produced solely by denitrification and
20
N2O produced by nitrifier denitrification coupled to denitrification is not possible using
the15N tracer approach adopted here and is therefore beyond the scope of this study.
Denitrification rates were relatively high under the truly anoxic conditions observed
in October 2010 (28.2 µmol N h−1m−2, Wenk, 2013), once redox gradients and,
pre-sumably, the microbial community had stabilized. At that time, up to 15 % of total NO−
3
25
that was reduced, was released as N2O without being completely reduced to N2.
BGD
10, 4969–4993, 2013N2O production in a
monomictic south-alpine lake
C. V. Freymond et al.
Title Page
Abstract Introduction
Conclusions References
Tables Figures
◭ ◮
◭ ◮
Back Close
Full Screen / Esc
Printer-friendly Version
Interactive Discussion
Discussion
P
a
per
|
Dis
cussion
P
a
per
|
Discussion
P
a
per
|
Discussio
n
P
a
per
|
high (10.2±5.0 (SD) and 46.2±20.3 (SD) µmol N h−1m−2, respectively, Wenk, 2013).
Furthermore, the October 2010 experiment was the only one in which steady-state
con-ditions may not have been reached before the experiments were started. N2as well as
N2O production rates increased over the experimental period (data not shown).
Nev-ertheless, the overall high net N2O fluxes measured during these incubations indicate
5
that N2O production was much more efficient than N2O consumption. N2O reduction to
N2 during the last step of denitrification is thought to be less tightly regulated than the
preceding step that reduces NO to N2O (Otte et al., 1996). As a result, N2O produced
by denitrifiers can accumulate when denitrification rates are high.
N2O production through NH+4 oxidation was not observed at the oxygenated
sedi-10
ment/water interface in April 2010 and May 2011 (Fig. 3), even though conditions were
seemingly conducive to benthic nitrification. Only in January 2011 did NH+4 oxidation
produce N2O. O2 was low but not absent during this incubation, which agrees with
previous findings that N2O production during nitrification is enhanced under low O2
conditions (Stein, 2011; Bange et al., 2010). It is possible that dilution of the15N-NH+4
15
tracer by rapid NH+4 regeneration from organic N in the sediments reduced the degree
of15N-labeling of the N2O that was produced during NH+4 oxidation, and thus our
abil-ity to detect N2O production by this mechanism. In the same line, Norton and Stark
(2011) suggest that immediate shunting of unlabeled NH+4 from NH+4-remineralizing
microorganisms to ammonia-oxidizing organisms could reduce the degree to which 20
added15NH+4 tracer is incorporated into the pool of NH+4 available for oxidation during
soil incubations. It is feasible that a similar effect occurs in lake sediments.
Although methodological limitations prevent us from ruling out N2O production during
ammonia oxidation, it is clear that N2O exported from the sediment is mainly produced
through nitrate (and possibly nitrite) reduction and, therefore, that denitrification is re-25
BGD
10, 4969–4993, 2013N2O production in a
monomictic south-alpine lake
C. V. Freymond et al.
Title Page
Abstract Introduction
Conclusions References
Tables Figures
◭ ◮
◭ ◮
Back Close
Full Screen / Esc
Printer-friendly Version
Interactive Discussion
Discussion
P
a
per
|
Dis
cussion
P
a
per
|
Discussion
P
a
per
|
Discussio
n
P
a
per
|
5 Conclusions
This study demonstrated that the sediments of the Lake Lugano SB are a net source
of N2O to the water column. NO−3 reduction by denitrification was found to be the
pri-mary source of this N2O, while N2O production during ammonia oxidation was minimal
or not observed at all, even when oxic conditions prevailed at the sediment/water in-5
terface. Net N2O fluxes varied seasonally, and the proportion of NO−3 reduced to N2O
versus N2 appeared to be enhanced by ongoing anoxia. Hence, 1–15 % of the N
re-duced from NO−3 accumulated as N2O in the water column. Surprisingly, the highest
percentage of NO−3 reduced to N2O was observed after thermal stratification occurred
and stable anoxia developed, conditions that are generally thought to favor complete 10
denitrification.
If we extrapolate the average of total N2O fluxes presented in this study (879 nmol
N2O h−1
m−2
) over the area of the Lake Lugano SB (20.3 km2) and the time span of
one year, the sediments of the Lake Lugano SB release 6.9 t N2O yr
−1
to the overlying water. The spatial resolution of our experiments is small compared to the lake area, 15
and benthic conditions are no doubt highly variable in time and space, so that this ex-trapolation is accompanied by a large uncertainty. Nevertheless, it demonstrates that
potentially large amounts of N2O are produced in the sediments of the Lake Lugano
SB. It is worth noting that the lacustrine N2O fluxes measured in this study, which
ranged between 140 and 2605 nmol N2O h−1
m−2
, as well as benthic fluxes from sev-20
eral other studies (e.g. McCrackin and Elser, 2010; Liikanen and Martikainen, 2003; Mengis et al., 1996) are of the same order as global average fluxes estimated for soils (Bouwman et al., 2002).
N2O fluxes from the surface waters to the atmosphere were not addressed in this
study and remain unknown, and the capacity of microbial processes in the water col-25
umn of Lake Lugano SB to remove sedimentary N2O before it escapes to the
atmo-sphere has yet to be determined. Nevertheless, we argue that significant, year-round
BGD
10, 4969–4993, 2013N2O production in a
monomictic south-alpine lake
C. V. Freymond et al.
Title Page
Abstract Introduction
Conclusions References
Tables Figures
◭ ◮
◭ ◮
Back Close
Full Screen / Esc
Printer-friendly Version
Interactive Discussion
Discussion
P
a
per
|
Dis
cussion
P
a
per
|
Discussion
P
a
per
|
Discussio
n
P
a
per
|
stratified lakes, and possibly to rapid evasion to the atmosphere during periods of
de-stratification. The relevance of such lacustrine N2O degassing events for regional or
global N2O budgets also awaits further investigation.
Acknowledgement. We would like to thank Mark Rollog for laboratory assistance, and Mauro Veronesi and Stefano Beatrizotti for their help with the sediment core sampling.
5
References
AGAGE Advanced Global Atmospheric Gases Experiment: http://agage.eas.gatech.edu/data archive/global mean/global mean md.txt, last access: 29 December 2012.
Bange, H. W., Reing, A., Kock, A., and L ¨oscher, C. R.: Marine pathways to nitrous oxide, in: Nitrous Oxide and Climate Change, edited by: Smith, K. A., Earthscan, London, 36–62,
10
2010.
Barbieri, A. and Polli, B.: Description of Lake Lugano, Aquat. Sci., 54, 181–183, doi:10.1007/BF00878135, 1992.
Barbieri, A. and Simona, M.: Trophic evolution of Lake Lugano related to external load reduc-tion: changes in phosphorus and nitrogen as well as oxygen balance and biological
parame-15
ters, Lakes Reserv. Res. Manage., 6, 37–47, doi:10.1046/j.1440-1770.2001.00120.x, 2001. Bartoli, M., Nizzoli, D., and Viaroli, P.: Microphytobenthos activity and fluxes at the
sediment-water interface: Interactions and spatial variability, Aquat. Ecol., 37, 341–349, doi:10.1023/B:AECO.0000007040.43077.5f, 2003.
Bouwman, A. F., Boumans, L. J. M., and Batjes, N. H.: Modeling global annual
20
N2O and NO emissions from fertilized fields, Global Biogeochem. Cy., 16, 1080, doi:10.1029/2001GB001812, 2002.
Codispoti, L. A., Brandes, J. A., Christensen, J. P., Devol, A. H., Naqvi, S. W. A., Paerl, H. W., and Yoshinari, T.: The oceanic fixed nitrogen and nitrous oxide budgets: Moving targets as we enter the anthropocene?, Sci. Mar., 65, 85–105, 2001.
25
Forster, P., Ramaswamy, V., Artaxo, P., Berntsen, T., Betts, R., Fahey, D. W., Haywood, J., Lean, J., Lowe, D. C., Myhre, G., Nganga, J., Prinn, R., Raga, G., Schulz, M., and Van Dor-land, R.: Changes in atmospheric constituents and in radiative forcing, in: Climate Change 2007: The Physical Science Basis. Contribution of Working Group I to the Fourth Assess-ment Report of the IntergovernAssess-mental Panel on Climate Change, edited by: Solomon, S.,
BGD
10, 4969–4993, 2013N2O production in a
monomictic south-alpine lake
C. V. Freymond et al.
Title Page
Abstract Introduction
Conclusions References
Tables Figures
◭ ◮
◭ ◮
Back Close
Full Screen / Esc
Printer-friendly Version
Interactive Discussion
Discussion
P
a
per
|
Dis
cussion
P
a
per
|
Discussion
P
a
per
|
Discussio
n
P
a
per
|
Qin, D., Manning, M., Chen, Z., Marquis, M., Averyt, K. B., Tignor, M., and Miller, H. L., Cambridge University Press, Cambridge, UK and New York, NY, USA, 130–234, 2007. Devol, A. H.: Denitrification including anammox, in: Nitrogen in the Marine Environment, 2nd
Edn., edited by: Capone, D. G., Bronk, D. A., Mulholland, M. R., and Carpenter, E. J., Aca-demic Press, San Diego, 199–261, 2008.
5
Firestone, M. K., Smith, M. S., Firestone, R. B., and Tiedje, J. M.: The influence of nitrate, nitrite, and oxygen on the composition of the gaseous products of denitrification in soil, Soil Sci. Soc. Am. J., 43, 1140–1144, doi:10.2136/sssaj1979.03615995004300060016x, 1979. Frame, C. H. and Casciotti, K. L.: Biogeochemical controls and isotopic signatures of
ni-trous oxide production by a marine ammonia-oxidizing bacterium, Biogeosci., 7, 2695–2709,
10
doi:10.5194/bg-7-2695-2010, 2010.
Galloway, J. N., Aber, J. D., Erisman, J. W., Seitzinger, S. P., Howarth, R. W., Cowling, E. B., and Cosby, B. J.: The nitrogen cascade, Bioscience, 53, 341–356, doi:10.1641/0006-3568(2003)053[0341:tnc]2.0.co;2, 2003.
Gardner, W. S., Seitzinger, S. P., and Malczyk, J. M.: The effects of sea salts on the forms of
ni-15
trogen released from estuarine and freshwater sediments: does ion pairing affect ammonium flux?, Estuaries, 14, 157–166, 1991.
Gardner, W. S. and McCarthy, M. J.: Nitrogen dynamics at the sediment-water interface in shallow, sub-tropical Florida Bay: why denitrification efficiency may decrease with increased eutrophication, Biogeochemistry, 95, 185–198, doi:10.1007/s10533-009-9329-5, 2009.
20
Hunting, E. R. and van der Geest, H. G.: Predictability of bacterial activity and denitrification in aquatic sediments with continuous measurements of redox potential, Int. J. Environ. Sci. Te., 8, 553–560, 2011.
Knowles, R.: Denitrification, Microbiol. Rev., 46, 43–70, 1982.
Kool, D. M., Dolfing, J., Wrage, N., and Van Groenigen, J. W.: Nitrifier denitrification as a
dis-25
tinct and significant source of nitrous oxide from soil, Soil Biol. Biochem., 43, 174–178, doi:10.1016/j.soilbio.2010.09.030, 2011.
Lavrentyev, P. J., Gardner, W. S., and Yang, L.: Effects of the zebra mussel on nitrogen dynamics and the microbial community at the sediment-water interface, Aquat. Microb. Ecol., 21, 187– 194, doi:10.3354/ame021187, 2000.
30
BGD
10, 4969–4993, 2013N2O production in a
monomictic south-alpine lake
C. V. Freymond et al.
Title Page
Abstract Introduction
Conclusions References
Tables Figures
◭ ◮
◭ ◮
Back Close
Full Screen / Esc
Printer-friendly Version
Interactive Discussion
Discussion
P
a
per
|
Dis
cussion
P
a
per
|
Discussion
P
a
per
|
Discussio
n
P
a
per
|
Lehmann, M. F., Bernasconi, S. M., McKenzie, J. A., Barbieri, A., Simona, M., and Veronesi, M.: Seasonal variation of theδ13C andδ15N of particulate and dissolved carbon and nitrogen in Lake Lugano: constraints on biogeochemical cycling in a eutrophic lake, Limnol. Oceanogr., 49, 415–429, doi:10.4319/lo.2004.49.2.0415, 2004a.
Lehmann, M. F., Bernasconi, S. M., Barbieri, A., Simona, M., and McKenzie, J. A.:
In-5
terannual variation of the isotopic composition of sedimenting organic carbon and nitro-gen in Lake Lugano: a long-term sediment trap study, Limnol. Oceanogr., 49, 839–849, doi:10.4319/lo.2004.49.3.0839, 2004b.
Lehmann, M. F., Barnett, B., Gelinas, Y., Gilbert, D., Maranger, R. J., Mucci, A., Sundby, B., and Thibodeau, B.: Aerobic respiration and hypoxia in the Lower St. Lawrence Estuary: stable
10
isotope rations of dissolved oxygen constrain oxygen sink partitioning, Limnol. Oceanogr., 54, 2157–2169, doi:10.4319/lo.2009.54.6.2157, 2009.
Li, Q. M., Zhang, W., Wang, X. X., Zhou, Y. Y., Yang, H., and Ji, G. L.: Phosphorus in interstitial water induced by redox potential in sediment of Dianchi Lake, China, Pedosphere, 17, 739– 746, doi:10.1016/S1002-0160(07)60089-7, 2007.
15
Liikanen, A. and Martikainen, P. J.: Effect of ammonium and oxygen on methane and nitrous oxide fluxes across sediment-water interface in a eutrophic lake, Chemosphere, 52, 1287– 1293, doi:10.1016/s0045-6535(03)00224-8, 2003.
Liikanen, A., Tanskanen, H., Murtoniemi, T., and Martikainen, P. J.: A laboratory microcosm for simultaneous gas and nutrient flux measurements in sediments, Boreal Environ. Res., 7,
20
151–160, 2002a.
Liikanen, A., Flojt, L., and Martikainen, P.: Gas dynamics in eutrophic lake sediments affected by oxygen, nitrate, and sulfate, J. Environ. Qual., 31, 338–349, doi:10.2134/jeq2002.3380, 2002b.
Liikanen, A., Murtoniemi, T., Tanskanen, H., Vaisanen, T., and Martikainen, P. J.: Effects of
25
temperature and oxygen availability on greenhouse gas and nutrient dynamics in sediment of a eutrophic mid-boreal lake, Biogeochemistry, 59, 269–286, doi:10.1023/a:1016015526712, 2002c.
Liikanen, A., Ratilainen, E., Saarnio, S., Alm, J., Martikainen, P. J., and Silvola, J.: Greenhouse gas dynamics in boreal, littoral sediments under raised CO2and nitrogen supply, Freshwater
30
Biol., 48, 500–511, doi:10.1046/j.1365-2427.2003.01023.x, 2003a.
dy-BGD
10, 4969–4993, 2013N2O production in a
monomictic south-alpine lake
C. V. Freymond et al.
Title Page
Abstract Introduction
Conclusions References
Tables Figures
◭ ◮
◭ ◮
Back Close
Full Screen / Esc
Printer-friendly Version
Interactive Discussion
Discussion
P
a
per
|
Dis
cussion
P
a
per
|
Discussion
P
a
per
|
Discussio
n
P
a
per
|
namics and their interactions in the sediments of a boreal eutrophic lake, Biogeochemistry, 65, 83–103, doi:10.1023/A:1026070209387, 2003b.
McCarthy, M. J., Gardner, W. S., Lavrentyev, P. J., Moats, K. M., Joehem, F. J., and Klarer, D. M.: Effects of hydrological flow regime on sediment-water interface and water column nitrogen dynamics in a great lakes coastal wetland (Old Woman Creek, Lake Erie), J. Great Lakes
5
Res., 33, 219–231, doi:10.3394/0380-1330(2007)33[219:EOHFRO]2.0.CO;2, 2007.
McCrackin, M. L. and Elser, J. J.: Atmospheric nitrogen deposition influences denitrification and nitrous oxide production in lakes, Ecology, 91, 528–539, doi:10.1890/08-2210.1, 2010. Mengis, M., Gachter, R., and Wehrli, B.: Nitrous oxide emissions to the atmosphere from an
artificially oxygenated lake, Limnol. Oceanogr., 41, 548–553, 1996.
10
Mosier, A., Kroeze, C., Nevison, C., Oenema, O., Seitzinger, S., and van Cleemput, O.: Clos-ing the global N2O budget: Nitrous oxide emissions through the agricultural nitrogen cycle – OECD/IPCC/IEA phase II development of IPCC guidelines for national greenhouse gas in-ventory methodology, Nutr. Cycl. Agroecosys., 52, 225–248, doi:10.1023/A:1009740530221, 1998.
15
Naqvi, S. W. A., Jayakumar, D. A., Narvekar, P. V., Naik, H., Sarma, V., D’Souza, W., Joseph, S., and George, M. D.: Increased marine production of N2O due to intensifying anoxia on the Indian continental shelf, Nature, 408, 346–349, doi:10.1038/35042551, 2000.
Norton, J. M. and Stark, J. M.: Regulation and measurement of nitrification in terrestrial sys-tems, in: Methods in Enzymology: Research on Nitrification and Related Processes, Part A,
20
edited by: Klotz, M. G., Elsevier Academic Press INC, San Diego, USA, 486, 343–368, ISBN: 978-0-12-381294-0, 2011.
Otte, S., Grobben, N. G., Robertson, L. A., Jetten, M. S. M., and Kuenen, J. G.: Nitrous ox-ide production byAlcaligenes faecalisunder transient and dynamic aerobic and anaerobic conditions, Appl. Environ. Microb., 62, 2421–2426, 1996.
25
Poth, M. and Focht, D. D.: N-15 kinetic-analysis of N2O production by nitrosomonas-Europaea – an examination of nitrifier denitrification, Appl. Environ. Microb., 49, 1134–1141, 1985. Principi, C., Baudo, R., and Muntau, H.: Spatial and temporal heterogeneity of Lake Lugano
sediment composition, Aquat. Sci., 56, 243–262, doi:10.1007/bf00879967, 1994.
Rasmussen, H. and Jorgensen, B. B.: Microelectrode studies of seasonal oxygen-uptake
30
BGD
10, 4969–4993, 2013N2O production in a
monomictic south-alpine lake
C. V. Freymond et al.
Title Page
Abstract Introduction
Conclusions References
Tables Figures
◭ ◮
◭ ◮
Back Close
Full Screen / Esc
Printer-friendly Version
Interactive Discussion
Discussion
P
a
per
|
Dis
cussion
P
a
per
|
Discussion
P
a
per
|
Discussio
n
P
a
per
|
Ravishankara, A. R., Daniel, J. S., and Portmann, R. W.: Nitrous oxide (N2O): the dom-inant ozone-depleting substance emitted in the 21st century, Science, 326, 123–125, doi:10.1126/science.1176985, 2009.
Ritchie, G. A. F. and Nicholas, D. J.: Identrification of sources of nitrous-oxide produced by oxidative and reductive processes inNitrosomonas europaea, Biochem. J., 126, 1181–1191,
5
1972.
Sigman, D. M., Casciotti, K. L., Andreani, M., Barford, C., Galanter, M., and B ¨ohlke, J. K.: A bacterial method for the nitrogen isotopic analysis of nitrate in seawater and freshwater, Anal. Chem., 73, 4145–4153, doi:10.1021/ac010088e, 2001.
Stein, L. Y.: Surveying N2O-producing pathways in bacteria, in: Methods in Enzymology:
Re-10
search on Nitrification and Related Processes, Part A, edited by: Klotz, M. G., Elsevier Aca-demic Press INC, San Diego, USA, 486, 131–152, ISBN: 978-0-12-381294-0, 2011.
Stockdale, A., Davison, W., and Zhang, H.: Micro-scale biogeochemical heterogeneity in sedi-ments: a review of available technology and observed evidence, Earth-Sci. Rev., 92, 81–97, doi:10.1016/j.earscirev.2008.11.003, 2009.
15
Svensson, J. M. and Leonardson, L.: Effects of bioturbation by tube-dwelling chironomid larvae on oxygen uptake and denitrification in eutrophic lake sediments, Freshwater Biol., 35, 289– 300, doi:10.1046/j.1365-2427.1996.00500.x, 1996.
Thibodeau, B., Lehmann, M. F., Kowarzyk, J., Mucci, A., Gelinas, Y., Gilbert, D., Maranger, R., and Alkhati, M.: Benthic nutrient fluxes along the Laurentian Channel: impacts on the
20
N budget of the St. Lawrence marine system, Estuar. Coast. Shelf S., 90, 195–205, doi:10.1016/j.ecss.2010.08.015, 2010.
Ward, B. B.: Nitrification in marine systems, in: Nitrogen in the Marine Environment, 2nd Edn., edited by: Capone, D. G., Bronk, D. A., Mulholland, M. R., and Carpenter, E. J., Academic Press, San Diego, 199–261, 2008.
25
Wenk, C. B.: Nitrogen transformation pathways, rates and isotopic signatures in Lake Lugano, Ph.D. thesis, Department of Environmental Sciences, University of Basel, Switzerland, in preparation, 2013.
Wenk, C. B., Blees, J., Zopfi, J., Veronesi, M., Bourbonnais, A., Schubert, C. J., Niemann, H., and Lehmann, M. F.: Anaerobic ammonium oxidation (anammox) bacteria and
sulfide-30
BGD
10, 4969–4993, 2013N2O production in a
monomictic south-alpine lake
C. V. Freymond et al.
Title Page
Abstract Introduction
Conclusions References
Tables Figures
◭ ◮
◭ ◮
Back Close
Full Screen / Esc
Printer-friendly Version
Interactive Discussion
Discussion
P
a
per
|
Dis
cussion
P
a
per
|
Discussion
P
a
per
|
Discussio
n
P
a
per
|
Table 1.In situ temperature and concentrations of dissolved O2, NH+4, NO−3 and NO−2 in bottom waters. DIN concentrations were measured in the inlet water reservoirs of the control experi-ments (Wenk, 2013).
Temp. O2 NH+4 NO−
3 NO
−
2
[◦
C] [µmol L−1
] [µmol L−1
] [µmol L−1
] [µmol L−1
]
April 2010 5.5 224 0.3 83.7 0.1
August 2010 5.7 0 7.1 75.7 1.7
October 2010 5.7 0 44.5 50.3 2.4
January 2011 5.9 11 13.2 69.6 2.3
BGD
10, 4969–4993, 2013N2O production in a
monomictic south-alpine lake
C. V. Freymond et al.
Title Page
Abstract Introduction
Conclusions References
Tables Figures
◭ ◮
◭ ◮
Back Close
Full Screen / Esc
Printer-friendly Version
Interactive Discussion
Discussion
P
a
per
|
Dis
cussion
P
a
per
|
Discussion
P
a
per
|
Discussio
n
P
a
per
|
50
95
Lugano Gandria
Melide Figino
Lago di Lugano
Switzerland
Lake Lugano Vedeggio
Tresa
Cassarate
Torrente Cuccio
N
1 km
BGD
10, 4969–4993, 2013N2O production in a
monomictic south-alpine lake
C. V. Freymond et al.
Title Page
Abstract Introduction
Conclusions References
Tables Figures
◭ ◮
◭ ◮
Back Close
Full Screen / Esc
Printer-friendly Version
Interactive Discussion
Discussion
P
a
per
|
Dis
cussion
P
a
per
|
Discussion
P
a
per
|
Discussio
n
P
a
per
|
Pump
1ml min-1
Intact
se-diment
core
Over-lying
water
Sampling
vial
Plunger
Ouflow
Inflow
Inlet water
BGD
10, 4969–4993, 2013N2O production in a
monomictic south-alpine lake
C. V. Freymond et al.
Title Page Abstract Introduction Conclusions References Tables Figures ◭ ◮ ◭ ◮ Back Close
Full Screen / Esc
Printer-friendly Version Interactive Discussion Discussion P a per | Dis cussion P a per | Discussion P a per | Discussio n P a per |
a) April 2010
1200 1000 800 600 400 200 0 N2
O flux [nmol N
2
O h
-1 m -2]
mass 44
total N2O mass 45
Core 1 Core 2 Core 1 Core 2 Core 1 Core 2 unamended 15NH
4+ labeled 15NO3- labeled
b) August 2010
1200 1000 800 600 400 200 0 N2
O flux [nmol N
2
O h
-1 m -2]
Core 1 Core 2 Core 1 Core 2 Core 1 Core 2 unamended 15NH
4+ labeled 15NO3- labeled
d) January 2011
1200 1000 800 600 400 200 0 N2
O flux [nmol N
2
O h
-1 m -2]
Core 1 Core 2 Core 1 Core 2 Core 1 Core 2 unamended 15NH4+ labeled 15NO3- labeled
c) October 2010
4000 3000 2000 1000 0 N2
O flux [nmol N
2
O h
-1 m -2]
Core 1 Core 2 Core 1 Core 2 Core 1 Core 2 unamended 15NH4+ labeled 15NO3- labeled
e) May 2011
1200 1000 800 600 400 200 0 N2
O flux [nmol N
2
O h
-1 m -2]
Core 1 Core 2 Core 1 Core 2 Core 1 Core 2 unamended 15NH
4+ labeled 15NO3- labeled mass 46