JPediatr(RioJ).2017;93(1):47---57
www.jped.com.br
ORIGINAL
ARTICLE
Nutritional
quality
of
dietary
patterns
of
children:
are
there
differences
inside
and
outside
school?
夽
Diva
Aliete
dos
Santos
Vieira
a,
Michelle
Alessandra
Castro
a,
Mauro
Fisberg
b,
Regina
Mara
Fisberg
a,∗aUniversidadedeSãoPaulo(USP),FaculdadedeSaúdePública,DepartamentodeNutric¸ão,SãoPaulo,SP,Brazil bHospitalInfantilSabará,InstitutoPENSI,CentrodeDificuldadesAlimentares,SãoPaulo,SP,Brazil
Received9December2015;accepted23March2016 Availableonline28June2016
KEYWORDS Foodconsumption; Dietarypatterns; Children; Schoolfeeding; Factoranalysis
Abstract
Objectives: Todescribethedietarypatternsofchildreninsideandoutsideschooland
investi-gatetheirassociationswithsociodemographicfactorsandnutritionalstatus.
Methods: Thiswasamulticentercross-sectionalstudyinwhichchildrenofbothsexes,aged1---6
years,attendingprivateandpublicdaycarecentersandpreschoolsinBrazil,wereevaluated (n=2979).Demographic,socioeconomicanddietarydata(weighedfoodrecordsandestimated food records)werecollected.Dietary patternswerederivedbyfactoranalysisfrom36food groups.
Results: Fourdietarypatternswereidentifiedinsideschool,andthreeoutside.Insideschool,
the‘‘traditional’’patternwasassociatedtolowincomeandpresentedhighnutritionalquality. The‘‘dual’’patternwasassociatedwithlowincomeandwithhighintakeofaddedsugarand glycemicload.The‘‘snack’’patternwasassociatedwithchildrenenrolledatprivateschools andwithhighintakeofaddedsugarandglycemicload.The‘‘breadandbutter’’patternwas associated withhighintakeofaddedsugarandtransfat.Outsideschool, the‘‘traditional’’ patternwasassociatedwithhighintakeofsaturatedfat,transfats,sodium,andtotalfiber. The‘‘breadandbutter’’patternwasassociatedwithhighintakeoftransfatsandglycemicload, whereasthe‘‘snack’’patternwasassociatedwithoverweight,privateschools,highincome, andhighintakeoftransfats,sodium,andtotalfiber.
Conclusion: Therearedifferencesinthenutritionalqualityofdietarypatternsinsideand
out-sideschool,andheterogeneityinadherencetothesepatternswereobservedacrossregions andsocioeconomicclasses.
©2016SociedadeBrasileiradePediatria.PublishedbyElsevierEditoraLtda.Thisisanopen accessarticleundertheCCBY-NC-NDlicense(http://creativecommons.org/licenses/by-nc-nd/ 4.0/).
夽
Pleasecitethisarticleas:VieiraDA,CastroMA,FisbergM,FisbergRM.Nutritionalqualityofdietarypatternsofchildren:arethere
differencesinsideandoutsideschool?JPediatr(RioJ).2017;93:47---57.
∗Correspondingauthor.
E-mails:[email protected],[email protected](R.M.Fisberg). http://dx.doi.org/10.1016/j.jped.2016.03.008
PALAVRAS-CHAVE Consumoalimentar; Padrõesalimentares; Crianc¸as;
Alimentac¸ãoescolar; Análisefatorial
Qualidadenutricionaldospadrõesalimentaresdecrianc¸as:existemdiferenc¸as dentroeforadaescola?
Resumo
Objetivos: Descreverospadrõesalimentaresdecrianc¸asdentroeforadaescolaeinvestigara
suaassociac¸ãocomfatoressociodemográficoseestadonutricional.
Métodos: Trata-sedeum estudomulticêntricotransversal,noqualforamavaliadascrianc¸as
de1a6anosdeambosossexos,atendidasemcrechespúblicaseprivadasepré-escolasno Brasil(n=2979).Foramcoletadosdadosdemográficos,socioeconômicosedietéticos.Ospadrões alimentaresforamderivadosporanálisefatorialapartirde36gruposdealimentos.
Resultados: Quatropadrõesalimentaresforamidentificadosdentrodacrecheetrêsforada
creche.Dentrodacreche,opadrão‘‘tradicional’’foiassociadoamenorrendaeapresentou melhorqualidadenutricional.Opadrão‘‘dual’’associou-seamenorrendaemaioringestãode ac¸úcardeadic¸ãoecargaglicêmica.Opadrão‘‘lanches’’foiassociadoacrianc¸asmatriculadas emescolasprivadasecommaioringestãodeac¸úcardeadic¸ãoecargaglicêmica.Opadrão ‘‘pãocommanteiga’’associou-seamaioringestãodeac¸úcardeadic¸ãoegorduratrans.Fora dacreche,opadrão‘‘tradicional’’foiassociadoamaioringestãodegordurasaturada,trans, sódioefibra.Opadrão‘‘pãocommanteiga’’associou-seamaioringestãodegorduratranse cargaglicêmica,enquantoopadrão‘‘lanches’’associou-seàscrianc¸ascomexcessodepeso, decrechesprivadas,maiorrendaecommaioringestãodegorduratrans,sódioefibra.
Conclusão: Houvediferenc¸anaqualidadenutricionaldospadrõesdentroeforadaescolaea
aderênciaaessesocorreudeformaheterogêneanasregiõeseclassessocioeconômicas. ©2016SociedadeBrasileiradePediatria.PublicadoporElsevierEditoraLtda.Este ´eumartigo OpenAccesssobumalicenc¸aCCBY-NC-ND(http://creativecommons.org/licenses/by-nc-nd/4. 0/).
Introduction
Theinvestigationofdietarypatternscanhelpelucidatethe complexrelationshipbetweendietandhealthby consider-ingthesimultaneouseffectofmultiple foodsanddietetic components,aswellastheirinteractions,ontheoccurrence ofoneormoreoutcomesofinterest.1
Inthepastdecades,transitionsindietaryintakeamong childrenhavebeenobservedandcharacterizedbyahigher intake of foods rich in fats, sodium, and sugar and by lower intakes of nutrient dense foods such as fruit and vegetables.2,3 These changes in food intake have had a majorimpactonthedevelopmentofobesityandnutritional deficits.Inaddition,studieshavesuggestedtheroleof child-hoodnutritiononthedevelopmentofmorbidityinfurther lifecycles,suchasinadulthood.4,5
Therefore,identifyingthedietarypatternsexperienced by children in different environment settings is essential toguidepublicpoliciesand educationalactionsregarding health andnutrition in theearly stages of life. Thus,the objectiveofthepresentstudywastodescribethedietary patternsinsideandoutsidetheschoolsettingandto inves-tigatetheirassociationswithdemographic,socioeconomic, andnutritionalstatusofchildreninBrazil.
Methods
Studypopulation
Dataweregatheredfromamulticentercross-sectionalstudy conducted in 2007 among children aged 1---6 years who attendedprivateandpublicdaycarecentersandpreschools.
Atotalof85primaryschools(54publicand31private)were included fromnineBraziliancities (Manaus,Recife,Natal, Brasília,Cuiabá,CaxiasdoSul,Vic¸osa,RiodeJaneiro,and SãoPaulo)locatedinfiveregions.Theeligibilitycriteriafor inclusion of the schools in the study were: belocated in theurbanareaofthecity,full-dayattendance,andhavea conventionalservingsystemformeals.6
Ineach city,350 children wereassessed, ofwhom 250 were frompublic and 100 from privateschools. The pro-portionofinterviewsinpublicandprivateschoolsineach citywasbasedonthenumberofenrolmentsindaycare cen-ters and preschools according to data from the National SchoolCensus conductedin 2005by theBrazilian Ministry ofEducation.The samplesizeforeachcitywasestimated at350subjectsbasedontheestimatedprevalenceof inade-quatenutritionalintake(approximately65%),withamargin of error of5% and aconfidence level of 95%.All children whose parents or guardiansauthorized datacollection by signing an informed consent were assessed, comprising a total sample of 3058 preschoolers.Forthe present study, 79childrenwereexcludedfromtheanalysisdueto incom-plete food intake data,leading toa final sample of 2979 childrenofbothgenders.
Data was collected between February and December of 2007 by undergraduate nutritionstudents, trained and supervisedbynutritionresearchersineachcity.Inorderto standardizedatacollection,structuredformsandmanuals withspecific guidelinesforthe studyweredeveloped and used.6
Dietarypatternsofpreschoolchildren 49
obtainedfromtheparentsorguardiansofthechildren eval-uated.
Socioeconomicdata
Socioeconomic data were collected from parents or guardians usingthe structuredquestionnaire publishedin 2003bytheAssociac¸ãoBrasileiradeEmpresasdePesquisa (APEP). This questionnaire was designed to estimate the purchasing power of families. The economic classes and meanfamilyincomewere definedby applyingthecut-off scores of the Brazilian Economic Classification Criterion,7 which is used by ABEP and takes into account the num-berofconsumergoodsavailableinthehousehold,suchas TVs,refrigerators,andcars,amongothers,andthelevelof educationoftheheadofthehousehold.
Anthropometricdata
Dataonweightandheightweremeasured induplicateby the study team. Weight was measured in kilograms using a calibrated digital scale, model Glass-6, accuracy: 100g (G-Tech®,USA),whereasheightwasmeasuredin centime-tersusingaportablewall-mountedstadiometeraffixedtoa smoothwallwithoutbaseboardmodel206,accuracy:1mm (Seca®,USA).
Height datafor childrenyoungerthan 2yearswas cor-rectedbyadding0.7cmtothemeasurement,8sincechildren inthisagegroupshouldbemeasuredintherecumbent posi-tion.Theclassificationofnutritionalstatuswasdetermined basedonz-scorevaluesofbodymassindex(BMI)-for-ageand cutoffs proposed by the WorldHealth Organization8 (<−2 SD;≥−2SDand≤+1SD;>+1SDand≤+2SD;>+2SD); chil-drenwerethencategorizedasunderweight,normalweight, overweight,orobese,respectively.
Dietarydata
At schools,dietary datawereobtained usingthe weighed foodrecords(WFRs).Forthis,threesamplesofeach food andbeveragewereportionedoutbythefoodservice atten-dant andweighed bythe undergraduate nutritionstudent on a calibrated electronic scale, model MEA06030, maxi-mumcapacity:3kg, accurate to1g(Plenna®, SP, Brazil). Thearithmeticmeansofthethreesampleswerecalculated andconsideredastheamountoffoodandbeveragesoffered toallchildren.
Allleftoversfromeachplatewerecollectedinindividual bagsandweighed.Thebeverageswereweighedseparately. A proportional estimate of the contribution of individual foodstothetotalplatewastewascalculatedforeachchild. Theamountsoffoodsandbeverageseatenatschool meal-timewereestimatedbythedifferencebetweentheportion offeredandtheindividualplatewasteofeachchild.
Dietaryintakeoutsidetheschoolenvironmentwas eval-uated using the estimated food record (EFR) method, completedbyparentsorguardiansonthesamedayofthe WFRcompletion,inordertodeterminethetotalfoodintake ofoneday.
Food questionnaires were entered into the software NutritionDataSystemfor Research(NutritionCoordinating Center,2007version---UniversityofMinnesota,USA),which usestheAmericanfoodcompositiondatabasedevelopedby theUnitedStatesDepartmentofAgriculture(USDA).
Asecond dietary measurementwasperformed on non-consecutivedaysinabout25%ofthesample.Ineachcity,a maximumof87childrenwererandomlyselectedfor reeval-uation.
Statisticalanalysis
Inordertoidentifythedietarypatternsinsideandoutside theschoolenvironment,828differentfoodswerecollapsed into36groups,accordingtotheirnutritionalvalue,culinary usage,anddietaryhabits.
Foodgroupsweresubmittedtoexploratoryfactor analy-sis,inordertoderivethedietarypatternsinsideandoutside school. Initially, factors with Eigenvalues greater than or equalto1.25 wereretained,yielding ninefactorsto rep-resentthedietarypatterninsideschoolversusfivefactors outside school. In the second stage, the screen plot was visuallyinspected,suggestingtheretentionoffourfactors inside and three factors outside school. Varimax ortho-gonalrotationwasappliedtoimprovethe interpretability of the matrix of factor loadings. Factor loadings greater thanorequalto|0.30|wereconsideredtocontributetothe pattern.
Factorscoreswereestimatedinordertoinvestigatethe association ofthe adherenceto thedietary patternswith demographicand socioeconomicvariables aswell as with nutritionalstatus. Forthis,the Mann---WhitneyU-test and Kruskal---Wallis were performed in Stata software (Stata-Corp.2011,StataStatisticalSoftware:Release12,College Station,USA).
Aimingtoevaluatetheassociationbetweenadherenceto dietarypatternsandusualintakeofnutritionalquality mark-ers,namelysaturatedfat,transfats,salt,addedsugar,total fiber,andglycemicload,thestatisticalmodelingtechniques incorporated in the multiple source method online plat-formwereapplied.Individualusual nutrient intakeswere expressedingramsormicrogramsper1000kcalofenergy, andtheir associations withadherence todietary patterns wasevaluatedusingtheKruskal---Wallis.
Results
Thesampleconsistedof2979children,mostofwhomwere boys(51.16%),withnormalweight(63.48%),agedbetween3 and6years(69.22%),livingintheSoutheastregion(36.93%), andfromlow-incomefamilies(73.83%;familyincomeunder 520.77dollarspermonth).
Table1 Factorloadingfordietarypatternsinsideandoutsidetheschoolofpreschoolersinamulticenterstudyconductedin Brazil(n=2979),Brazil,2007.
Foodgroups Insideschool Outsideschool
Traditional Dual Snack Breadand butter
Traditional Breadand butter
Snack
Dairy −0.11 0.49 −0.21 0.08 0.04 0.02 0.21
Pastas 0.22 −0.16 0.09 0.36 −0.02 0.03 0.34
Meat 0.29 0.40 0.05 −0.01 0.57 0.00 0.05
Sandwichesandpastries −0.02 −0.06 0.37 0.11 −0.01 0.06 0.31
Juice 0.13 0.40 0.42 0.16 0.13 0.39 0.14
Porridge 0.06 −0.04 −0.25 −0.23 0.05 −0.05 −0.03
Soda −0.03 −0.14 0.30 0.10 0.13 0.17 0.31
Coffeeandtea −0.01 −0.11 0.07 0.36 0.09 0.34 −0.09
Soups 0.07 −0.02 −0.10 −0.05 −0.26 −0.00 −0.01
Bread −0.04 −0.01 0.05 0.66 −0.06 0.76 0.05
Cookies 0.21 −0.01 −0.06 −0.14 0.08 0.14 0.11
Vegetables 0.61 0.21 0.08 0.15 0.39 −0.00 −0.05
Candies −0.04 0.30 0.32 −0.04 0.06 0.13 0.21
Fruit 0.24 0.08 −0.15 0.02 0.15 0.09 0.15
Cakesandpies −0.05 −0.15 0.31 0.13 0.07 0.02 0.14
Eggs −0.06 0.26 −0.43 0.21 0.10 0.09 −0.19
Butterandmargarine −0.02 0.18 −0.22 0.61 0.03 0.62 −0.14
Instantnoodles −0.06 −0.03 0.62 0.01 −0.07 0.04 0.33
Flour 0.27 0.64 −0.09 −0.09 −0.06 0.14 −0.37
Salt −0.02 −0.01 −0.01 −0.06 0.16 0.16 −0.33
Processedmeatand sausages
0.66 0.13 0.08 −0.09 0.17 0.13 0.04
Sauces −0.14 0.18 0.52 −0.11 −0.02 0.11 0.47
Sugar 0.09 0.66 0.10 0.21 −0.06 0.22 −0.44
Beans 0.59 −0.20 −0.13 0.11 0.78 −0.04 0.02
Legumes −0.09 −0.03 −0.15 0.11 0.09 0.00 0.03
Tubers −0.04 0.49 0.05 −0.21 0.02 0.02 0.02
Cheese 0.12 −0.04 0.24 0.48 −0.08 0.36 0.10
Milk 0.02 0.27 −0.16 0.15 −0.01 −0.13 −0.26
Chocolatepowdersand chocolatemilk
−0.15 0.09 −0.22 0.33 0.10 −0.04 0.18
Cereals 0.41 0.04 0.07 −0.17 0.03 0.13 −0.22
Snack 0.01 −0.04 0.13 0.03 0.15 0.06 0.11
Rice 0.81 0.08 −0.08 −0.03 0.83 0.00 −0.02
Infantformulaandspecial supplements
−0.05 0.09 0.33 −0.03 −0.08 −0.09 −0.29
Couscous --- --- --- --- −0.21 −0.06 −0.24
Puree −0.14 0.28 0.16 −0.21 0.10 0.03 0.02
Potatoes 0.35 0.11 −0.01 0.37 0.32 0.06 −0.03
Varianceexplained(%) 8.24 5.96 5.61 5.36 6.32 4.48 4.38 Explainedcumulative
variance(%)
8.24 14.20 19.82 25.17 6.32 10.80 15.18
Kaiser---Meyer---Olkin(KMO) 0.56 0.56
Theboldvaluesarefoodgroupswithfactorloadingsgreaterthanorequalto−0.30or+0.30.
sauces,sandwichesandpastries,soda,juice,cakesandpies, candies,andinfantformulaandspecialsupplements (posi-tiveloadings),andeggs(negativeloading);andthe‘‘bread and butter’’ pattern comprised bread, butter and mar-garine, coffee and tea, chocolate powders andchocolate milk, cheese, and pastas (positive loadings). The assess-mentofdietarypatternoutsideschoolalsoidentifiedthree patterns,labeled‘‘traditional,’’ ‘‘breadandbutter,’’and ‘‘snack,’’ which explained 15.18% of the total variance
Dietary
patterns
of
preschool
children
51
Table2 Median scoreofeachdietarypatterninside schoolaccordingtosocio-demographiccharacteristicsandnutritional statusofpreschoolersinamulticenterstudy conductedinBrazil(n=2979),Brazil,2007.
Characteristics Insideschool
Traditional Dual Snack Breadandbutter
Median IQR p-Value Median IQR p-Value Median IQR p-value Median IQR p-Value
Nutritionalstatusa
Underweight −0.25 0.95 0.19 −0.27 0.97 0.51 −0.14 0.69 0.09 −0.25 0.93 0.00
Eutrophic −0.19 1.06 −0.25 0.95 −0.09 0.82 −0.27 1.01
Overweight −0.21 1.06 −0.31 0.86 −0.10 0.82 −0.16 0.95
Obese −0.18 1.30 −0.20 0.93 −0.07 1.01 −0.01 1.28
Schooltype
Private −0.22 1.02 0.47 −0.43 0.76 0.00 0.01 0.70 0.00 −0.24 0.90 0.36
Public −0.20 1.11 −0.20 0.98 −0.14 0.87 −0.24 1.06
Socioeconomicclasses
A −0.29 0.82 0.00 −0.47 0.67 0.00 −0.04 0.63 0.00 −0.39 0.73 0.00
B −0.21 0.99 −0.44 0.69 −0.05 0.81 −0.23 0.91
C −0.21 1.07 −0.27 0.90 −0.13 0.85 −0.19 1.04
D −0.17 1.14 −0.03 1.32 −0.08 0.85 −0.24 1.09
E 0.00 1.29 0.40 1.35 −0.13 1.03 −0.52 1.08
Regions
North −0.80 0.47 0.00 −0.29 0.53 0.00 −0.08 0.41 0.00 −0.16 0.72 0.00
Northeast −0.10 1.39 0.90 1.58 −0.04 0.84 −0.50 1.01
Midwest 0.23 0.98 −0.43 0.51 0.11 0.78 0.24 1.42
Southeast −0.16 0.89 −0.42 0.70 −0.24 0.82 −0.38 0.86
South −0.62 0.83 −0.26 0.90 −0.19 1.15 0.02 1.28
Percapitafamilyincome(US$)
<520.77 −0.19 1.12 0.11 −0.16 1.06 0.00 −0.11 0.85 0.00 −0.21 1.07 0.28
≥520.77 −0.23 0.96 −0.45 0.69 −0.04 0.74 −0.28 0.88
Age(completeyears)
1---2 −0.14 0.86 0.00 −0.33 0.77 0.00 −0.08 0.69 0.12 −0.30 0.91 0.00
3---6 −0.24 1.16 −0.22 0.99 −0.11 0.89 −0.17 1.04
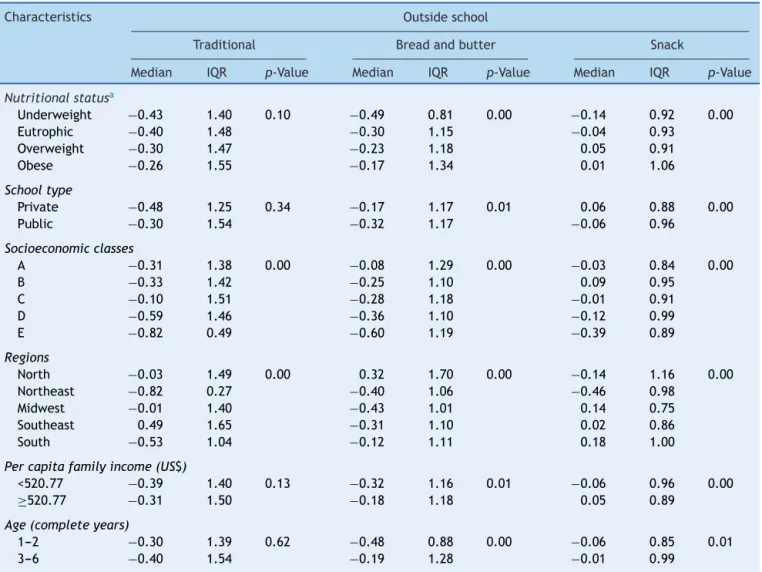
Table3 Medianscoreofeachdietarypatternoutsideschoolaccordingtosocio-demographiccharacteristicsandnutritional statusofpreschoolersinamulticenterstudyconductedinBrazil(n=2979),Brazil,2007.
Characteristics Outsideschool
Traditional Breadandbutter Snack
Median IQR p-Value Median IQR p-Value Median IQR p-Value
Nutritionalstatusa
Underweight −0.43 1.40 0.10 −0.49 0.81 0.00 −0.14 0.92 0.00 Eutrophic −0.40 1.48 −0.30 1.15 −0.04 0.93
Overweight −0.30 1.47 −0.23 1.18 0.05 0.91
Obese −0.26 1.55 −0.17 1.34 0.01 1.06
Schooltype
Private −0.48 1.25 0.34 −0.17 1.17 0.01 0.06 0.88 0.00 Public −0.30 1.54 −0.32 1.17 −0.06 0.96
Socioeconomicclasses
A −0.31 1.38 0.00 −0.08 1.29 0.00 −0.03 0.84 0.00
B −0.33 1.42 −0.25 1.10 0.09 0.95
C −0.10 1.51 −0.28 1.18 −0.01 0.91
D −0.59 1.46 −0.36 1.10 −0.12 0.99
E −0.82 0.49 −0.60 1.19 −0.39 0.89
Regions
North −0.03 1.49 0.00 0.32 1.70 0.00 −0.14 1.16 0.00 Northeast −0.82 0.27 −0.40 1.06 −0.46 0.98
Midwest −0.01 1.40 −0.43 1.01 0.14 0.75
Southeast 0.49 1.65 −0.31 1.10 0.02 0.86
South −0.53 1.04 −0.12 1.11 0.18 1.00
Percapitafamilyincome(US$)
<520.77 −0.39 1.40 0.13 −0.32 1.16 0.01 −0.06 0.96 0.00 ≥520.77 −0.31 1.50 −0.18 1.18 0.05 0.89
Age(completeyears)
1---2 −0.30 1.39 0.62 −0.48 0.88 0.00 −0.06 0.85 0.01
3---6 −0.40 1.54 −0.19 1.28 −0.01 0.99
aAccordingtothebodymassindex(BMI)cutoffpointsforageandsexproposedbytheWorldHealthOrganization(WHO).8
sociodemographicvariablesandnutritionalstatus.Agreater adherence to the ‘‘traditional’’ pattern was observed in childrenfromsocioeconomicclassEthaninthosefromclass A,livingintheMidwestregion.Theadherencetothe‘‘dual’’ patternwashigherin childrenfromsocioeconomicclassE thaninthosefromclassAandthosewholivedinthe North-east region. The adherence to the ‘‘snack’’ pattern was higherinchildrenenrolledat privateschools andlivingin Midwestregion, while adherence tothe ‘‘bread and but-ter’’pattern washigher in children living in the Midwest andSouthregions.
Considering the dietary patterns identified outside school,adherencetothe‘‘traditional’’ washigherin chil-drenfromSoutheastregion,whileadherencetothe‘‘bread and butter’’ pattern was higher in children from North region.Theadherencetothe‘‘snack’’patternwashigherin overweightandobesechildren,enrolledatprivateschools, fromsocioeconomic class B than from classE, from Mid-west,SoutheastandSouthregionsandwithpercapitafamily income≥520.77US$(Table3).
The association between nutrient intake and the fac-torscoresofthedietarypatternsinsideandoutsideschool
Dietary
patterns
of
preschool
children
53
Table4 MediannutrientintakeaccordingtotertilesofadherencetodietarypatternsinsideandoutsideschoolofpreschoolersinamulticenterstudyconductedinBrazil (n=2979),Brazil,2007.
Escores fatoriais
Nutrients
Addedsugar (g/1000kcal)
Totalsaturated fattyacids (g/1000kcal)
Totaltrans fattyacids (g/1000kcal)
Sodium (mg/1000kcal)
Totaldietary fiber (g/1000kcal)
Glycemicload (g/1000kcal)
Median IQR Median IQR Median IQR Median IQR Median IQR Median IQR
Insideschool
Tradicional
Tertile1 39.30 14.54 10.30 1.86 1.47 0.51 1289.82 211.47 9.43 2.52 74.72 9.48 Tertile2 36.18 14.44 9.65 1.68 1.46 0.50 1338.93 214.91 10.76 2.36 74.48 8.45 Tertile3 32.38 12.43 9.15 1.61 1.34 0.50 1366.20 212.09 11.56 2.91 74.63 8.86
p-Value 0.00a,b,c 0.00a,b,c 0.00b,c 0.00a,b,c 0.00a,b,c 0.30
Dual
Tertile1 32.07 13.47 9.85 1.86 1.49 0.54 1373.34 207.09 11.23 3.16 72.44 7.51 Tertile2 35.26 13.21 9.88 1.73 1.48 0.50 1344.13 206.29 10.50 2.70 73.42 8.36 Tertile3 40.32 14.24 9.21 1.78 1.30 0.47 1272.22 227.83 10.09 2.25 78.17 8.64 p-Value 0.00a,b,c 0.00b,c 0.00b,c 0.00a,b,c 0.00a,b,c 0.00a,b,c
Snack
Tertile1 32.66 13.81 9.73 1.73 1.49 0.58 1354.10 231.88 11.22 2.83 73.07 8.66 Tertile2 35.97 13.88 9.72 1.86 1.48 0.52 1335.89 198.66 10.49 2.67 74.73 9.08 Tertile3 38.75 14.38 9.58 1.96 1.38 0.44 1308.35 218.15 9.97 2.42 75.76 9.02 p-Value 0.00a,b,c 0.01b 0.00a,b,c 0.00b,c 0.00a,b,c 0.00a,b,c
Breadandbutter
Tertile1 34.77 13.24 9.49 2.02 1.30 0.49 1333.92 225.55 10.57 2.90 74.83 9.47 Tertile2 36.32 15.48 9.86 1.90 1.43 0.46 1331.81 235.03 10.53 2.84 74.08 9.07 Tertile3 36.84 15.18 9.68 1.64 1.55 0.54 1333.09 206.58 10.54 2.64 75.03 8.64
V
ieira
DA
et
al.
Table4 (Continued) Escores
fatoriais
Nutrients
Addedsugar (g/1000kcal)
Totalsaturated fattyacids (g/1000kcal)
Totaltrans fattyacids (g/1000kcal)
Sodium (mg/1000kcal)
Totaldietary fiber (g/1000kcal)
Glycemicload (g/1000kcal)
Median IQR Median IQR Median IQR Median IQR Median IQR Median IQR
Outsideschool
Tradicional
Tertile1 37.48 14.77 9.49 2.02 1.34 0.54 1333.29 264.45 10.31 2.52 77.33 9.18 Tertile2 37.33 15.41 9.91 1.91 1.49 0.51 1298.78 205.58 10.11 2.67 74.40 8.80 Tertile3 33.09 12.95 9.63 1.68 1.44 0.47 1364.16 180.34 11.34 2.84 72.33 7.61
p-Value 0.00b,c 0.00a,b,c 0.00a,b,c 0.00a,b,c 0.00b,c 0.00a,b,c
Breadandbutter
Tertile1 34.55 14.76 9.76 1.86 1.39 0.48 1340.88 215.76 10.51 2.83 72.87 9.93 Tertile2 36.76 14.06 9.55 1.76 1.42 0.49 1314.83 237.74 10.58 2.68 74.97 8.99 Tertile3 36.02 14.68 9.78 1.97 1.49 0.56 1338.53 210.85 10.54 2.92 75.53 8.89
p-Value 0.00a 0.01a,c 0.00b,c 0.00a,c 0.14 0.00a,b
Snack
Tertile1 36.50 14.74 9.59 2.00 1.36 0.50 1302.98 236.18 10.31 2.52 75.78 10.39 Tertile2 34.34 14.42 9.75 1.85 1.47 0.53 1363.47 212.40 10.80 2.93 73.59 9.14 Tertile3 36.91 14.57 9.72 1.74 1.46 0.49 1331.31 206.50 10.58 2.77 74.58 7.91 p-Value 0.00a,c 0.03a 0.00a,b 0.00a,b,c 0.00a,b,c 0.00a,b,c
IQR,interquartilerange.
a Significantdifferencebetweentertiles1and2ofthefactorscores.
b Significantdifferencebetweentertiles1and3ofthefactorscores.
Dietarypatternsofpreschoolchildren 55
Discussion
Inthepresentstudy,conductedamongchildrenfrom differ-entregionsof Brazil,disparities betweendietarypatterns insideandoutsideschoolwereobserved.Inaddition, asso-ciationsofthesepatternswithsociodemographicvariables andnutritionalstatuswerealsodetected.
Dietarypatternsinsideschool
The ‘‘traditional’’ pattern identified inside school essen-tially comprised the typical foods from Brazilian cuisine, such asrice and beans, and foods rich in fiber, vitamins, andminerals,suchasvegetablesandcereals,inadditionto thepresenceoffoods,suchasprocessedmeatandsausages. Childrenwithhigheradherencetothispatternhadahigher nutritionalqualitythanthosewithloweradherencetothis pattern,astheyconsumedlessaddedsugar,saturated,and trans fats and had a higher intake of total dietary fiber. Thispatternwasassociatedwithchildrenfromlow-income familiesliving in theMidwest region.Similarresults were reportedinthestudybyNobreetal.3assessing preschool-ers, inwhich theyidentified adietary pattern comprising thetypicalfoodsconsumedintheBraziliandiet.
The second pattern,‘‘dual,’’wascharacterizedby the presenceoffoodsoflownutritionalquality,withthe excep-tion of the dairy group, which are important sources of calcium,andtubersgroup(cassava,sweetpotato,andyam) ---typicalfoodsfromtheNortheastofBrazilthataresources ofcomplexcarbohydrates.Thispatternwasassociatedwith higherintakeofaddedsugarandglycemicloadandlower intakeof saturatedfat, trans fat, sodium, andtotal fiber intake.Inaddition,therewasgreateradherencetothis pat-ternamonglow-incomechildrenfromtheNortheastregion. The thirdpattern,‘‘snack,’’wascomposedby easy-to-prepareorready-to-eatfoodswithlownutritionalquality, suchasinstantnoodles,sandwiches,soda,pies,andcandies. Thispatternhadgreateradherenceamongchildrenenrolled at privateschools fromtheMidwest region.Adherenceto thispatternwasassociatedwithhigherintakeofaddedsugar andglycemicload.
Ford,Slining,andPopkin2assessedtrendsinthedietary intakeamongchildrenfromtheUnitedStatesagedbetween 2and6years;overatwenty-yearperiod,theyidentifiedan increase in148kcal/dayin theper capitaintake offoods richinsugarsandsolidfats.
However,itis noteworthythatnutrient-richfoods such as dairy, tubers, and cereals were featured only in pat-terns described inside school. These foods are sourcesof nutrients whose adequate intake can help promote bone growthand development,aswellasprevent anumberof non-communicablediseases,suchascardiovasculardiseases andsometypesof cancer.9---15 Itshouldbementioned that the adherence to the dietary pattern composed by foods richinfat,sodium,andaddedsugarwasloweramong chil-drenenrolledinpublicschoolsthanamongthoseenrolledin privateschools.Theseresultscanbeascribedtothe Brazil-ianNationalSchoolFeedingProgram(ProgramaNacionalde Alimentac¸ãoEscolar[PNAE]),implementedinBrazilin1955, whichhas ascore principlestheprovision ofhealthy food andmeals,respectinglocaleatinghabitsinaccordancewith
age andhealth status.16 This program covers all students enrolledin basiceducationinpublicschools,providingup to70%oftherecommendeddailynutrientintake.ThePNAE hasalsoreleasedarecommendationforreducingprocessed foodsthatarehighinfat,sodium,andsugarinschoolmeals ofBrazilianchildren.
The school plays a key role in the dietary intake of children,bycreatingopportunitiestothemtoexpandthe repertoire of foods consumed and create a reference of healthy eating,as they areexposed to a wide variety of nutrient-richfoodsatschoolmeals.Moreover,schools sup-portthenutritioneducationandpublicpoliciesforensuring thequalityofschoolmeals.
Dietarypatternsoutsideschool
The ‘‘traditional’’ pattern identified outside school com-prisedtraditionalfoodsfromBrazilianculturesuchasrice, bean,meat,vegetables,potatoes,anditwassimilartothe patternsidentifiedinside school.Similarresultswerealso describedbyMatosetal.17inapopulation-basedstudythat assessedthedietarypatternsof children,whereadietary patternconsistingofrice,beans,andmeatinchildrenaged 2---5yearswasidentified.Thispatternwasassociatedwitha higherintakeofsaturatedfat,transfat,sodium,andtotal dietaryfiber,aswellaswithalowerintakeofaddedsugar andglycemicload.Furthermore,the‘‘traditional’’pattern wasassociatedwithchildrenfromtheSoutheastregion.
Higheradherencetothe‘‘breadandbutter’’patternwas observed amongchildren from Northregion. This pattern wasassociatedwithahigherintakeoftransfatandglycemic load.Souzaetal.,18whoevaluatedthedietarypatternsof childrenaged1---6yearsfromSouthernBrazil,identifieda similardietary pattern, characterized by the presence of bread,butter/margarine,rice/pastas,coffee,andsugar.
Conversely, a ‘‘snack’’ pattern was characterized by easy-to-prepareorready-to-eatfoods andshowedgreater adherenceamongchildrenenrolledatprivateschools,from high-income families from the Midwest, Southeast, and Southregions,andwithoverweightandobesity.
Inthisregard,Romani19observedthatpost-modern fam-ilieshaveadeconstructionoftheclassicroleofthefamily inrelation tofeeding practices,and notedan increase in theconsumptionofeasy-to-preparefoodsinItalianfamilies. Severalfactorsmayinfluencetheincreaseofthe consump-tionofthesefoods,includingwomen’sparticipationinthe labormarket,convenienceinpreparation,andavailability ofthese products.Osman etal.20 evaluatedfactors influ-encing the consumption of easy-to-prepare foods among workingwomenandidentifiedthattimehassignificant pos-itiveimpactonconsumptionofthistypeoffood.Theyalso observedthatfactorssuchashealthawareness,price,and familyinfluence did not have a significant effect on con-sumptionofeasy-to-preparefoods.
literature,thereisnoconsensusyetonthecontributionof foodsconsumedinthe‘‘snack’’dietarypatterntothetrend inoverweightamongchildren.26
Althoughsomedietarypatternsidentifiedinsideand out-sideschoolsweresimilar,theydifferintermsofnutritional quality. It was noted that children from private schools showed greater adherence to patterns with worse nutri-tionalquality,suchasthe‘‘snack’’pattern.
Thepresentstudyhassomelimitationsthatmustbe out-lined.Exploratoryfactoranalysisisamultivariatestatistical method involving decision-making by researchers at vari-ous stages of the modeling process, such as during food grouping,choosingfactor rotationmethod, defining crite-riaforretentionoffactors,andestablishingacut-offpoint to factor loadings. However, aiming to ensure methodo-logicalstrictness,theauthorsappliedanalyticalprocedures widelyestablishedinnutritionalepidemiologyforthestudy ofdietarypatterns.Furthermore,thecross-sectionalnature does not allow for establishing causal inference. Another limitationofthestudyisthatdatacollectionoccurred dur-ing2007,andchangesineconomic,food,andhealthpolicies have taken placein recent years in Brazil. However,this study was the first multicenter study of dietary patterns inside and outside the school, showing the relevance of publicpoliciestothenutritionalqualityofinfantfeeding. Moreover,this studyisinnovative withregardtotheissue investigated and is relevant to public health and policy-makers.
In conclusion, there are differences in the nutritional qualityofdietarypatternsinsideandoutsideschool.Also, heterogeneityinadherencetothesepatternswasobserved acrossregionsandsocioeconomicclasses.Thepresentstudy reinforcestheimportanceofnutritioneducationactionsand moreeffectivepublicpoliciesforpromotinghealthierfood choicesinchildhood.
Conflicts
of
interest
Theauthorsdeclarenoconflictsofinterest.
Acknowledgements
Tothe institutionsthat collaboratedwiththedata collec-tion and to the São Paulo Research Foundation (FAPESP) forgrantingascholarshiptothefirstauthor(ProceduralN◦ 2013/06979-9).
References
1.FungTT,WillettWC,StampferMJ,MansonJE,HuFB.Dietary patternsandtheriskofcoronaryheartdiseaseinwomen.Arch InternMed.2001;161:1857---62.
2.Ford CN, Slining MM, Popkin BM. Trends in dietary intake amongUS2-6yearoldchildren,19892008.JAcadNutrDiet. 2013;113:35---42.
3.NobreLN,LamounierJA, FranceschiniSC. Preschoolchildren dietary patterns and associated factors. J Pediatr (Rio J). 2012;88:129---36.
4.Kaikkonen JE, Mikkilä V, Magnussen CG, Juonala M, Viikari JS, Raitakari OT. Does childhood nutrition influence adult cardiovasculardiseaserisk?InsightsfromtheYoungFinnsStudy. AnnMed.2013;45:120---8.
5.Mikkilä V, Räsänen L, Raitakari OT, Pietinen P, Viikari J. Longitudinal changes in diet from childhood into adulthood with respect to risk of cardiovascular diseases: the Cardio-vascularRisk inYoungFinnsStudy. EurJ ClinNutr.2004;58: 1038---45.
6.CastroMA,VerlyEJr,FisbergM,FisbergRM.Children’s nutri-entintakevariabilityisaffectedbyageandbodyweightstatus accordingtoresultsfrom aBrazilianmulticenterstudy.Nutr Res.2014;34:74---84.
7.ABEP.Associac¸ão BrasileiradeEmpresasdePesquisa.Critério
declassificac¸ão econômicaBrasil. 2003[cited 28Oct2014].
Availablefrom:http://www.abep.org/criterio-brasil.
8.World Health Organization (WHO). Child growth standards: length/height-for-age, weight-for-age, weight-for-length, weight-for-heightandbodymassindex-for-age:methodsand development.Geneva:WHO;2006.
9.Huth PJ, Park KM. Influence of dairy product and milk fat consumptionon cardiovascular disease risk: a reviewof the evidence.AdvNutr.2012;3:266---85.
10.PrenticeAM.Dairyproductsinglobalpublichealth.AmJClin Nutr.2014;99:S1212---6.
11.World Health Organization (WHO). Diet, nutrition and the preventionofchronicdiseases.JointWHO/FAOExpert Consul-tation. WHO Technical Report Seriesn◦ 916. Geneva: WHO;
2003.
12.ClemensR,vanKlinkenBJ.Oats,morethanjustawholegrain: anintroduction.BrJNutr.2014;112:S1---3.
13.BorneoR,LeónAE.Wholegraincereals:functionalcomponents andhealthbenefits.FoodFunct.2012;3:110---9.
14.World Cancer Research Fund/American Institute for Cancer Research.Food,nutrition,physicalactivity,andtheprevention ofcancer:aglobalperspective.Washington,DC:AICR;2007. 15.JonesJM,EnglesonJ.Wholegrains:benefitsandchallenges.
AnnuRevFoodSciTechnol.2010;1:19---40.
16.Brasil. Presidência da República. Casa Civil Subchefia para AssuntosJurídicos.LeiFederal n.11.947, de16dejunho de 2009. Dispõe sobreo atendimento da alimentac¸ãoescolar e doProgramaDinheiroDiretonaEscolaaosalunosdaeducac¸ão básica.DiárioOficialdaUnião,Brasília(DF).200917jun.;Sec¸ão 1:2.
17.MatosSM,BarretoML,RodriguesLC,OliveiraVA,OliveiraLP, D’InnocenzoS,etal. Dietarypatternsofchildrenunderfive yearsofagelivingintheStatecapitalandothercountiesof BahiaState,Brazil,1996and1999---2000.CadSaudePublica. 2014;30:44---54.
18.Souza RL, Madruga SW, Gigante DP, Santos IS, Barros AJ, Assunc¸ãoMC. Dietarypatternsand associatedfactors among childrenonetosixyearsofageinacityinsouthernBrazil.Cad SaudePublica.2013;29:2416---26.
19.RomaniS.In:EkstromKM,BrembeckH,editors.Feeding Post-ModernFamilies:FoodPreparationandConsumptionPractices inNewFamily Structures,inE ---EuropeanAdvancesin Con-sumerResearch.Goteborg,Sweden:AssociationforConsumer Research;2005.p.250---4.
20.OsmanI,OsmanS,MokhtarI,SetapaF,ShukorSAM,Temyati Z.Familyfood consumption:desiretowards convenientfood products.ProcediaSocBehavSci.2014;121:223---31.
21.Jebb SA. Dietary determinants of obesity. Obes Rev. 2007;8:S93---7.
22.MoreiraP,SantosS,PadrãoP,CordeiroT,BessaM,ValenteH, etal.Foodpatternsaccordingtosociodemographics,physical activity,sleepingandobesityinPortuguesechildren.IntJ Envi-ronResPublicHealth.2010;7:1121---38.
23.OhSY,AhnH,ChangN,KangMH,OhJV.Dietarypatternsand weightstatusassociatedwithbehaviouralproblemsinyoung children.PublicHealthNutr.2013;4:1---7.
Dietarypatternsofpreschoolchildren 57
relatedtothedevelopmentofadiposity:aprospectivestudyin school-agechildren.PublicHealthNutr.2013;24:1---7. 25.McDonaldCM,BaylinA,ArsenaultJE,Mora-PlazasM,Villamor
E.Overweightismoreprevalentthanstuntingandisassociated withsocioeconomicstatus, maternal obesity,and a snacking
dietary pattern inschool childrenfrom Bogotá, Colombia.J Nutr.2009;139:370---6.