DIELECTRIC RESONATOR ANTENNA:
OPERATION OF THE
MAGNETODIELECTRIC COMPOSITES
CR
0.75FE
1.25O
3(CRFO)/FE
0.5CU
0.75TI
0.75O
3(FCTO)
H. H. B. Rocha,1,2F. N. A. Freire,2,3R. C. S. Costa,1,2
R. S. T. M. Sohn,2G. Orjubin,2C. Junqueira,4T. Cordaro,5and A. S. B. Sombra2
1Departamento de Engenharia de Teleinforma´tica (DETI), Universidade Federal do Ceara´; Caixa Postal 6007, CEP 60.755– 640, Fortaleza, CE, Brazil
2Laborato´rio de Telecomunicac¸o˜es e Cieˆncia e Engenharia dos Materiais (LOCEM); Departamento de Fı´sica, Universidade Federal do Ceara´, Caixa Postal 6030, CEP 60455–760, Fortaleza, CE, Brazil 3Departamento de Quı´mica Orgaˆnica e Inorgaˆnica, Universidade Federal do Ceara´; Caixa Postal 12200, CEP 60455–760, Fortaleza, CE, Brazil
4Centro Te´cnico Aeroespacial (CTA)/Instituto de Aerona´utica e Espac¸o (IAE), Divisa˜o de Eletroˆnica-AEL, CEP 12228 –904, Sa˜o Jose´ dos Campos, SP, BRAZIL
5Celestica do Brasil Ltda, Rod Sp 340 km 128.7-Cp 151, CEP 13820 – 000, Jaguariu´na, SP, Brazil
Received 27 June 2006
ABSTRACT:The probe-feed cylindrical dielectric resonator antennas (DRA) based on a new magnetodielectric composites Cr0.75Fe1.25O3 (CRFO)/Fe0.5Cu0.75Ti0.75O3(FCTO) are investigated. The experimental and theoretical characteristics of the antenna like return loss, band-width, input impedance, and radiation patterns are in good agreement. Numerical validation is done, tacking into account the air gaps between the dielectric resonator and the metallic conductors. Frequency re-sponse bandwidth in the range of 6.6 –11.8% was obtained for fre-quency operation around 4 GHz. The CRFO-FCTO present a dielectric constant in the range of 8 –13 with loss around 10⫺3. To summarize, the performance of a cylindrical DRA based in a new matrix CRFO/FCTO was examined. These measurements confirm the potential use of such materials for small DRA.© 2006 Wiley Periodicals, Inc. Microwave Opt Technol Lett 49: 409 – 413, 2007; Published online in Wiley Inter-Science (www.interscience.wiley.com). DOI 10.1002/mop.22160
Key words:dielectric resonator antenna; magnetodielectric material
1. INTRODUCTION
In recent years, the dielectric resonator (DR) has been used in microwave circuits, such as oscillators and filters [1], where the DR is normally made of high-permittivity materials, with dielectric constantr⬎20.
Although open DRs were found to radiate many years ago [1], in recent years, the frequency range of interest has gradually progressed to the 100 –300 GHz band. As the conductor loss increases with increasing frequency, radiation efficiency of con-ventional metallic antennas drops significantly. Hence, most of the antennas in microwave band can not be directly scaled down with increasing frequency. Conversely, the only loss for a dielectric resonator antenna (DRA) is due to the imperfect dielectric mate-rial, which can be very small in practice. Thus, DRA found potential applications in the microwave, millimeter wave band, and above.
The DRA technology contributes to the global effort for min-iaturization of radiofrequency (RF) and microwave (MW) elec-tronics. The current state of the art in power efficient and minia-turized antennas, filters, and multiplexers leaves much to be desired. Currently, high dielectric, low loss materials are widely used in the fabrication of miniaturized filters, diplexers, and an-tennas. At VHF through the lower UHF band where
miniaturiza-tion of RF components is desirable, the applicaminiaturiza-tion of magnetodi-electric composite materials was already proposed.
Although the physical properties of a DRA material can be resumed by its permittivity, the use of magnetodielectric compos-ite has recently been proposed [2]. The effective medium proper-ties of a composite material, by a proper arrangement of constit-uent dielectric and magnetic materials, provides more degrees of freedom in achieving desired functionalities. If we use a magne-todielectric material, we can also miniaturize the component by the same factor however using moderate values of permittivity and permeability.
In a recent article [3] we have presented a study of the struc-tural properties of two crystalline phases: CrYFe2 –YO3(CRFO) and FeXCu1 –X/2Ti1 –X/2O3(FCTO) forY⫽0.75 andX⫽0.5 and their composites where our interest was in the structural properties of a magnetodielectric composite. The first ceramic is a member of hematite (␣-Fe2O3) and eskolaite (Cr2O3) system, which are anti-ferromagnetic insulators with corundum structure. This system presents a continuous solid solution in the entire concentration range [4]. Both the end members of the series are anti-ferromag-netically ordered at room temperature (␣-Fe2O3, below Neel tem-perature TN ⫽ 682°C, Cr2O3 TN ⫽ 27°C), however, the spin ordering in these oxides has different symmetry and is markedly weaker in Cr2O3.Recently in the literature there is an interest in the study of magnetic parameters like temperature dependence of magnetization and magnetic susceptibility [4].
The solid solution Fe0.5Cu0.75Ti0.75O3(FCTO) belongs to the bixbyite family Fe2WCu1 –WTi1 –WO3(0.15ⱕWⱕ0.33;W⫽ 0.25), essentially a copper titanate iron-substituted system, isotypic with the (Fe,Mn)2O3compounds [5]. The idea of using titanium is to improve the dielectric constant properties of the material [6].
In this work we report the study of cylindrical DRA based on composite of CRFO/FCTO system in the 4 – 6 GHz frequency range. First are presented in Section 2 the results of the Hakki– Coleman method [7–9] that is used for the determination of the dielectric constantr and loss tan ␣of the dielectrics. Are also described the experimental setup of the DRA, as introduced by Long in Ref. 10, and details of the numerical simulation using the Ansoft High Frequency Structure Simulator (HFSS™). The exper-imental results are given and discussed in Section 3.
2. EXPERIMENTAL
2.1. Preparation of the Magnetodielectric Materials
In Ref. 3 we have presented the experimental details for the preparation of the phases CRFO and FCTO:
Cr0.75Fe1.25O33CrYFe2⫺YO3共CRFO,Y⫽0.75兲 (1)
Fe0.5Cu0.75Ti0.75O33FexCu1⫺X/ 2Ti1⫺X/ 2O3共FCTO,X⫽0.5兲 (2) The current article is devoted to the application of the following composites: FCTO100 (100% FCTO phase), CRFO100 (100% of CRFO phase), and CRFO50 (with 50% of CRFO and 50% of FCTO phases), where the percentage is given in weight%.
2.2. Hakki–Coleman’s Experiment
The dielectric properties at radio frequencies are deduced from the sizes of the sample and the value of the resonant frequency, performing the Hakki and Coleman’s dielectric resonant TE011and TE01␦methods. A HP 8716ET network analyzer is employed to
DR which permittivity is around 13.2. The loss of all the DRs is around 10⫺3
. The values obtained in this experiment are used as guide in the numerical simulation of the antennas, with the as-sumption that the variation of r with the frequency can be ne-glected between 7 GHz (mean resonant frequency of Hakki– Coleman experiment) and 4 GHz (mean resonant frequency of Long experiment).
2.3. Antenna Configuration
In a second experiment introduced by Long [10], the DRs are excited by a wire antenna above a ground plane. The configuration of the cylindrical DRAs is shown in Figure 1. The DRA is placed
above a conducting ground plane (the ground plane is made of copper, with 35.5 cm ⫻ 30 cm⫻ 2.14 mm), and excited by a coaxial probe (L⫽ 9 mm). The coaxial probe goes through the ground plane and is connected to a SMA connector. In Figure 1, the cylindrical DRA has a radiusa, heighth, and dielectric con-stantr. The probe is located on thexaxis atx⫽aand⫽0.
The cylindrical DRA is worked at the HE11␦ mode, which
resonant frequencyf0can be approximated [1, 11] by
f0⫽ 2.997
20
冑
r冑
冉
1.841a
冊
2
⫹
冉
2h
冊
2
关GHz兴. (3)
Equation (3) is obtained with the hypothesis that the lateral and upper surface of the DR are perfectly magnetic conductors (PMC). Because this assumption is verified only for infinite permittivity, Eq. (3) is only an approximation that leads to some 10% errors.
It can be interesting to compare the values issued from Eq. (3) to the following closed form expression [12] for the HEM11␦
resonant frequency
f⫽ 6.324c
2a
冑
2⫹ r冉
0.27⫹0.36a
2L⫹0.02
冉
a2L
冊
2
冊
. (4)Using a curve fitting procedure on numerical experiments based on method of moments, [4] has been proposed in Ref. 12 for
r⫽38, and has been generalized in Ref. 13.
The resonant frequencies using Eq. (4) are reported in Table 1. The comparison with the PMC model confirms a deviation close to 10%.
It is important to note that both experimental and simulation results show a great variability of the results according to the DRA distance to the probe. This problem, that finds its origin in the presence of an air gap between the DR and the metallic conductors, have been thoroughly studied by Junker et al. in Refs. 14 and 15. To illustrate the effect, we define in Figure 1 two parameters associated to the air gape1between the dielectric and the probe, ande2between the dielectric and the ground plane.
2.4. S Parameter
Because of the highly resonant structure of the DRA, the input impedance Z⫽ R⫹ jXat the feeder port presents a frequency response because of the resonant response of each modes. Neglect-ing the overlap between the first and second mode, at the resonant TABLE 1 Experimental and Calculated Resonant Frequencies, Input Impedances, and Radiation Efficiencies, and 10 dB
bandwidth of the DRs for the First Mode HEM11␦
Sample CRFO100 CRFO50 FCTO100
Resonant frequency (GHz), PMC approximation using Eq. (3) 4.45 3.88 3.67 Resonant frequency (GHz), using Eq. (4) 4.75 4.26 4.08 Relative difference (%) between Eqs. (3) and (4) 6.3 8.9 10.0 Simulated (HFSS) input resistance (⍀) at resonance 133.5 90.4 95 Measured input resistance (⍀) at resonance 113.5 93.3 94.8 Mean value of the measured resonant frequency (GHz) 4.66 4.36 4.04 Range of measured frequency (GHz) 4.61–4.73 4.29–4.41 3.99–4.09 Simulated (HFSS) resonant frequency(GHz) 4.70 4.22 4.05 Relative difference between measure and simulation (%) 3.8 6.6 3.2 Relative difference between measure and Eq. (4) 1.0 1.0 0.9
Measured S11dip (dB) ⫺43.4 ⫺36.8 ⫺50.6
Calculated S11dip (dB) ⫺25.2 ⫺27.6 ⫺35.7
Measured bandwidth (%) 11.8 8.3 6.6
Measured radiation efficiency,(%) 99.79 99.89 99.76
frequencyf0, the resistanceRshows a maximum and the reactance
Xis null. This behavior will be illustrated in Figure 2.
It must be stressed that the derivation of resonant frequencies from the minimum of the return loss parameterS11is not direct, as shown herein. The return lossS11is related toZby
S11⫽
z⫺1
z⫹1withz⫽
Z Rc
(5)
whereRcis the characteristic impedance of the feeder. Equation (5) shows clearly that S11depends on Rc: using anRc⫽ 50⍀ feeder, it will be seen that the power transmission to the antenna is high (S11⫽0) at the resonant frequency of the DR.
2.5. Antenna Efficiency
From a slight modification of the experiment shown in Figure 1, one can deduce the radiation efficiency of the DRAs. For this, the wheeler cap method is employed [1]. This method, based on the Q factor of the antenna, leads to the determination of the radiation efficiencyof the antenna:is the ratio of the radiated powerPrad to the total power which can also be expressed in terms of Q factors as:
⫽ Prad
Prad⫹Pdis
⫽1⫺QO Qdis
(6)
where the values ofQ0andQdiscan be determined experimentally by measuring the return loss of the antenna with and without a radiation shield. The used radiating shield is an aluminum cylinder
cup with 17.5 cm of diameter and 16.6 cm of height. The shield thickness is around 0.7 cm.
2.6. Numerical Simulation
The objective of this study is a numerical validation of the exper-imental setup, following Refs. 16 and 17. As a first advantage, one can investigate the influence of the probe on the resonant frequen-cies, as Refs. 3 and 4 concern the sole DRAs without any probe. Secondly, the high sensitivity of the results in function of the air gap can be confirmed. Finally, HFSSTM
software provides the radiation pattern of these antennas.
An adaptive scheme of discretization is used: convergence is completed for a frequency (resp. return loss) variation inferior to 1% (resp. 0.02%). To increase the precision, three consecutives passes are required. This leads to more or less 2.5⫻104
degrees of freedom.
Two techniques can be used. In the first method the eigensolver is employed, wherein the resonant frequencies of the structure presented in Figure 1 are determined for an unexcited feeder. On the frontiers at the air volume are implemented perfectly matched layers (PML). An examination of the first mode cartography shows that the field pattern inside the DRA is similar to the HEM11␦
mode of the probeless configuration. However, one can notice the existence of a strong field in the probe vicinity, particularly on the interface with the DR. This fact explains the high sensitivity of the DRA location, as well as discretization errors of the finite element method.
As an alternative to the previous eigenmode analysis, the re-sults that will be presented in this article are issued from a harmonic analysis for which the feeder is excited. This method enables the determination of the port characteristics, such as the input impedance and the return loss. In a single run, the so called fast frequency sweep provides these quantities in the 4 – 6 GHz frequency band.
To tack into account the effect of an air gap between the probe and the DR, the gapse1and e2(Fig. 1) are set to 50m, value already found in the literature [14, 15].
3. RESULTS AND DISCUSSION
For each bulk, the frequency response around the first mode (HEM11␦) is determined by HFSS™ and the result is compared
with the experimental one.
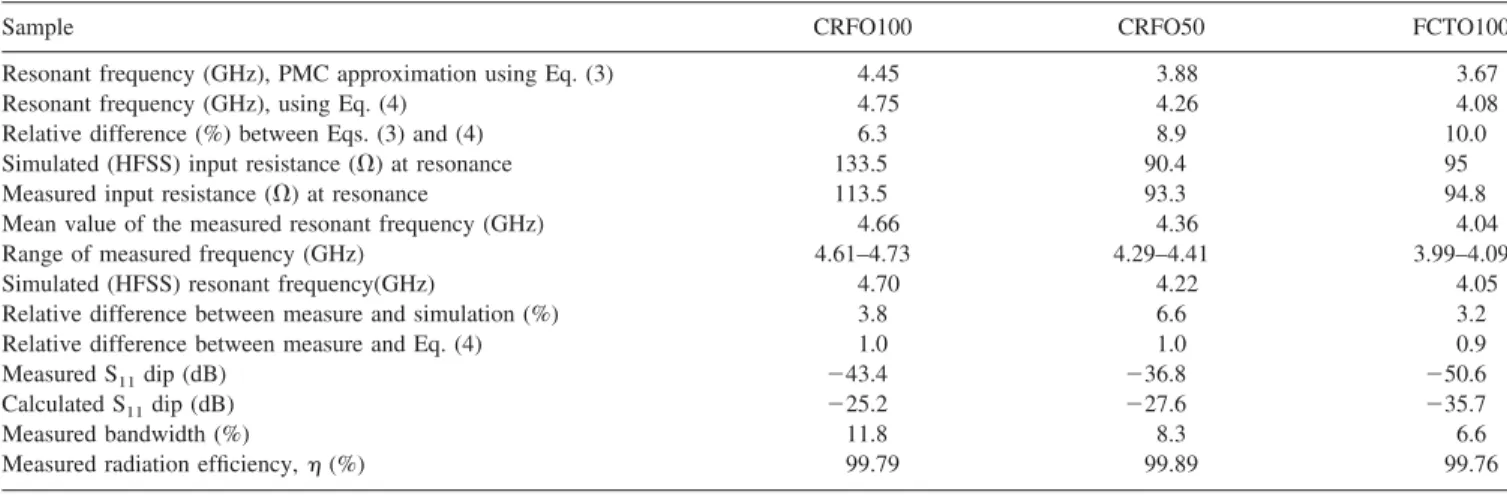
In Figure 2 we observe the return loss (RL) of the cylindrical DRA constructed from the dielectrics FCTO100, CRFO50, and CRFO100. The FCTO100 DRA, which features the highest value of the dielectric constant (Table 1), is presenting the lowest reso-nant frequency.
The frequency for which the return loss S11 is minimum is then given in Table 2. According to the DR location with the probe, this frequency is measured and the variability range is also reported in Table 2. The observed variability is close to 1% and is much higher than for the Courtney experiment (classically 0.3% forr [11]). It is worth mentioning that for a 50 ⍀feeder, the antenna radiation is the best (S11⫽0) for a frequency close to the resonant frequency of the DR.
Figure 2 Return loss (RL) (experimental and theoretical) for CRFO100, CRFO50, and FCTO100 DRAs. For the calculated RL, the geometry and dielectric characteristics were given in Table 2
TABLE 2 Microwave Measurements of the Samples Obtained Through the Hakki–Coleman Procedure
Samples a (mm) h (mm) f0(GHz) r tan␦ Qf0(GHz)
In Table 2 are also indicated the minimum value of the RL of each DR. For the CRFO100 DR a return loss around⫺43 dB was observed. For the FCTO100 DRA, value around ⫺50 dB was obtained. The DRA bandwidth is higher for the CRFO100 antenna (11.8%), and lower for the FCTO (6.6%)
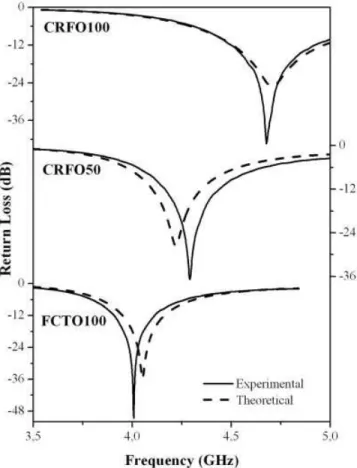
The frequency response of input impedance for the DRA an-tennas is plotted in Figure 3 and shows a good agreement between simulation and experimental data. In the numerical study, it was observed that the increase of the air gaps leads to a frequency shift upward and a decrease of the resistance at resonance. Such behav-ior has been explained in Refs. 14 and 15. The resistanceRof the first resonant frequency of each DRA is also indicated in Table 1 and Figure 3. For the CRFO100 DRA this value is around 113.5⍀. For the other DRAs this value is around 93.3⍀, and 94.8⍀for CRFO50 and FCTO100, respectively.
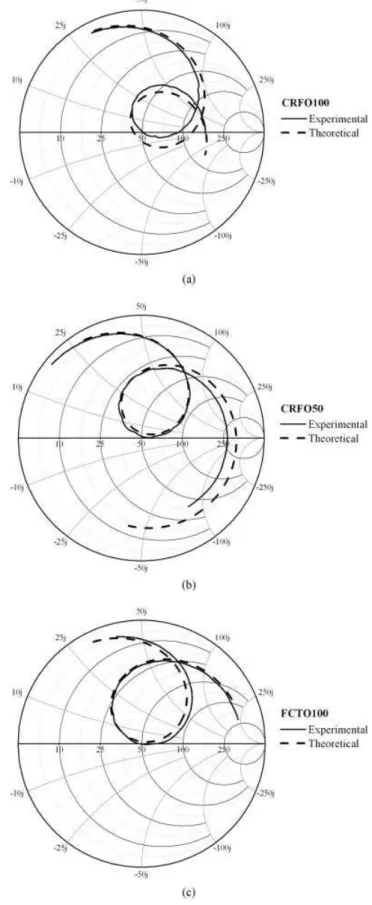
To get a more precise idea of the antenna behavior, the complex
S11 is reported in the Smith chart of Figure 4. The agreement between the experimental and the theoretical value is good. How-ever one can note that the minimum of S11 is not always situated on the null reactance curve of Smith chart [e.g., Fig. 3(a)]. There-foreZis not real atf0, as confirms the plot ofZgiven in Figure 3. Therefore the minimum of S11 does not coincide exactly with the zero of the imaginary part ofZ.
A last result presented in Table 2 is the value of the measured radiation. For the studied DRAs, the radiation efficiency is around 99.8%.
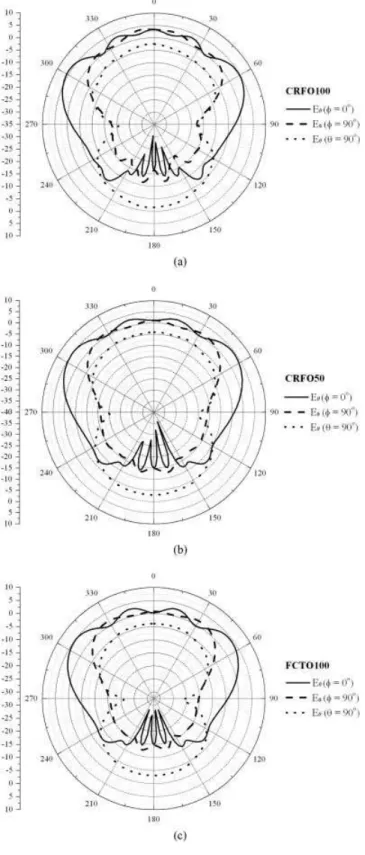
The calculated radiation patterns ofEplane andEplane at resonant frequency for the CRFO100, CRFO50, and FCTO100 samples are shown in Figure 5. For the three dielectrics the radiation pattern are quite similar. Symmetry of the field patterns
is related to the feed probe location at ( ⫽ 0°). The obtained values for thex–zplane [Fig. 5(a)] show a broad, almost omnidi-rectional pattern with a roll-off near⫽90° (a consequence of the Figure 3 Experimental and calculated input impedance (Z) for
CRFO100, CRFO50, and FCTO100 DRAs. For the calculated Z, the geometry and dielectric characteristics were given in Table 2
finite ground plane used for the experimental setup). These results are in agreement with data reported in the literature [1].
4. CONCLUSIONS
In this article we did a study of the probe-feed cylindrical DRA based on a new magnetodielectric composite, Cr0.75Fe1.25O3 -(CRFO)/Fe0.5Cu0.75Ti0.75O3(FCTO). The experimental and
theo-retical characteristics of the antenna-like return loss, bandwidth, input impedance, and radiation patterns are in good agreement. Numerical validation is done using HFSSTM
software, tacking into account the air gaps between the DR and the metallic conductors. The FCTO matrix presents the highest dielectric constant (13.2) and lowest bandwidth (6.5%). Bandwidth in the range of 6.6%– 11.8% was obtained for frequency operation around 4 GHz. The CRFO/FCTO composites present dielectric constant in the range of 8 –13, with loss around 10⫺3
.
To summarize, the performance of a cylindrical DRA based in a new matrix CRFO/FCTO was examined. These measurements confirm the potential use of such materials for small DRA.
ACKNOWLEDGMENT
This work was partly sponsored by CELESTICA, FUNCAP, FINEP, CNPq and CAPES (Brazilian agencies).
REFERENCES
1. K.M. Luk and K.W. Leung (Eds.), Dielectric resonator antennas, Research Studies Press, Baldock, England, 2002.
2. H. Mosallaei and K. Sarabandi, Magneto-dielectrics in electromagnet-ics: Concept and applications, IEEE Trans Antennas Propag 52 (2004), 1558 –1567.
3. H.H.B. Rocha, F.N.A. Freire, R.R. Silva, D.X. Gouveia, J.A.C. de Paiva, J.M. Sasaki, M.R.P. Santos, J.C. Goe´s, and A.S.B. Sombra, Structural studies of the magneto-dielectric composite: Cr0.75Fe1.25O3 (CRFO)-Fe0.5Cu0.75Ti0.75O3(FCTO), J Chem Phys, submitted. 4. T. Grygar, P. Bezdicˇka, J. Dde˘decˇek, E. Pretovsky´, and O.
Schnee-weiss, Fe2O3-Cr2O3 system revised, Ceramics–Silikat´y 47 (2003), 32–39.
5. P. Mouron, P. Odier, and J. Choisnet, Titanates de cuivre substitutes a` structure bixbyite: Les composes´ Cu1 –xTi1 –xFe2xO3(0.15ⱕ⫻ⱕ 0.33), J Solid State Chem 60 (1985), 87–94.
6. A.J. Moulson and J.M. Herbert, Electroceramics: Materials, properties and applications, Chapman and Hall, London, 1990.
7. B.W. Hakki and P.D. Coleman, A dielectric resonator method of measuring inductive capacities in the millimeter range, IRE Trans Microwave Theory Tech, MTT-8 (1960), 402– 410.
8. Y. Kobayashi and M. Katoh, Microwave measurement of dielectric properties of low-loss materials by the dielectric rod resonator method, IEEE Trans Microwave Theory Tech, MTT-33, (1985) 586 –592. 9. R. Grabovickic, Accurate calculations of geometrical factors of
hakki-coleman shielded dielectric resonators IEEE Trans Appl Supercond 9 (1999), 4607– 4612.
10. S.A. Long, M.W. McAllister, and L.C. Shen, The resonant cylindrical dielectric cavity antenna, IEEE Trans Antennas Propag AP-31 (1983), 406 – 412.
11. D. Kajfez and P. Guillon, Dielectric resonators, Artech House Micro-wave Library, Dedham, MA, 1986.
12. A.A. Kishk, A.W. Glisson, and D. Kajfez, Computed resonant fre-quency and far fields of isolated disks, IEEE AP-S Int Symp Dig, Ann Arbor, MI (1993), 408 – 411.
13. R.K. Mongia and P. Bhartia, Dielectric resonator antennas—A review and general design relations for resonant frequency and bandwidth, Int J Microwave Millimeter Wave Comput Aided Eng 4 (1994), 230 –247. 14. G.P. Junker, A.A. Kishk, A.W. Glisson, and D. Kajfez, Effect of air gap on cylindrical dielectric resonator antenna operating in TM01 mode, Electron Lett 30 (1994), 97–98.
15. G.P. Junker, A.A. Kishk, A.W. Glisson, and D. Kajfez, Effect of an air gap around the coaxial probe exciting a cylindrical dielectric resonator antenna, Electron Lett 30 (1994), 177–178.
16. J.-F. Kiang, Novel technologies for microwave and millimeter wave applications, Kluwer Academic, Amsterdam, 2004.
17. Z. Peng, F. Wang, and X. Yao, Dielectric resonator antennas using high permittivity ceramics, Ceram Int 30 (2004), 1211–1214.
© 2006 Wiley Periodicals, Inc. Figure 5 Simulated radiation pattern ofE(⫽0°),E(⫽90°), and