Muhammad Usman Sheikh
1, Jukka Lempiainen
1and Hans Ahnlund
21
Department of Communications Engineering, Tampere University of Technology 2
European Communications Engineering Ltd, Tekniikantie 12, Espoo Finland
A
BSTRACTMobile operators commonly use macro cells with traditional wide beam antennas for wider coverage in the cell, but future capacity demands cannot be achieved by using them only. It is required to achieve maximum practical capacity from macro cells by employing higher order sectorization and by utilizing all possible antenna solutions including smart antennas. This paper presents enhanced tessellation for 6-sector sites and proposes novel layout for 12-sector sites. The main target of this paper is to compare the performance of conventional wide beam antenna, switched beam smart antenna, adaptive beam antenna and different network layouts in terms of offering better received signal quality and user throughput. Splitting macro cell into smaller micro or pico cells can improve the capacity of network, but this paper highlights the importance of higher order sectorization and advance antenna techniques to attain high Signal to Interference plus Noise Ratio (SINR), along with improved network capacity. Monte Carlo simulations at system level were done for Dual Cell High Speed Downlink Packet Access (DC-HSDPA) technology with multiple (five) users per Transmission Time Interval (TTI) at different Intersite Distance (ISD). The obtained results validate and estimate the gain of using smart antennas and higher order sectorization with proposed network layout.
K
EYWORDSSystem capacity, Sectorization, Advanced antenna techniques, Switched beam antenna, Adaptive antenna, Dual Cell High Speed Downlink Packet Access.
1.
I
NTRODUCTIONguaranteed by adopting new network tessellation and by employing possible advanced antenna solutions, including smart antennas. Smart antennas have gained enormous popularity in the last few years, and have been able to grab the attention for its ability to improve the performance of cellular systems [3].
Moreover, cell and system capacities are related to network layout, antennas deployment techniques, orientation and beamwidth of antennas. Directional antennas with optimum electrical or mechanical tilt are used to get required coverage with minimum interference [2]. Antenna configuration i.e. antenna height, azimuth, radiation pattern and beamwidth has deep impact on cell capacity [4– 6]. Different network tessellations have been compared in [7], and it was noted that for 3-sector sites, cloverleaf layout offers the lowest interference level, and thus should have the best cell and system capacity for macro cells. Thus, cloverleaf is a good basis for nominal planning of mobile networks with 3-sector sites. However, for higher order of sectorization, cloverleaf layout cannot be used and new tessellation is needed to combat the problem of interference. Base station antenna configuration needs to be optimized to attain minimum inter cell interference [1], [8]. The conventional cellular concept approach uses fixed beam position with wide beamwidth. Whereas, advanced approach of smart antenna employs multiple narrow beams and beam steering for each user in a cell. Adaptive algorithms form the heart of antenna array processing network. The processor based on different beamforming algorithms does the complex computation for beamforming [9]. Achieved user SINR and user throughput strongly relies on interference management and inter-cell interference avoidance [10]. Handovers between cells due to mobility of user, and software features have their own impact on cell capacity. However, this research work does not deal with these issues.
Over the last decade, services like multimedia messaging, video streaming, video telephony, positioning services and interactive gaming have become an integral part of everyday life. These services are the driving force in reshaping the cellular technologies. Universal Mobile Telecommunication System (UMTS) has been the most popular choice for 3G mobile communication systems, but UMTS had challenges in meeting the requirement of high data rate services. High Speed Downlink Packet Access (HSDPA) was for first time introduced in Release 5 of 3GPP specifications [8], [10]. The evolution of HSDPA continued and later in Release 8, the concept of Dual Cell HSDPA was floated in which the radio resources of two adjacent HSDPA carriers were aggregated with the help of joint scheduler. The main target of DC-HSDPA was not only to improve the user’s throughput in the close vicinity of base station rather it also enhances the user’s throughput homogeneously over whole cell area. DC-HSDPA offers theoretical peak data rate of 42 Mbps, improved spectral efficiency, and enhanced user experience with low delays or latency [8], [11].
2.
C
ELLULART
HEORY2.1. Interference and Cell Capacity
Theoretical maximum cell capacity can be estimated by Shannon capacity equation (bits/s) for Additive White Gaussian Noise (AWGN) channel as given in equation (1), [1], [4]
where is the bandwidth available for communication, is the received signal power which can be denoted as energy per information bit , multiplied with the information rate . A variable is the noise power impairing the received signal. The noise power can be defined as noise spectral density multiplied with the transmission bandwidth . Signal to Noise ratio (S/N) can be extended to Signal to Interference plus Noise Ratio (SINR) by including interference from own cell and also co-channel interference coming from neighbor cells. HSDPA is a WCDMA based network, and the total interference is a sum of three interference sources; own (serving) sector signals, other site/sector signals, and thermal noise. In downlink direction, the total interference
for any particular user at a given location is given by equation (2), [8]
! "# $
%"&('
' )
*
'+,
! "&-(. /
- 0 . 1 2
In equation (2), "# is a thermal noise power. In equation (3), is the total received power from other sectors of the network, and is a sum of other cells interfering sources. "&' is a total transmit power and (' is a path loss for 3 neighbor cell. In equation (4), ! is the total received interference from own sector, where "&- and (- are the total transmit power and path loss respectively of serving cell. Where / is the received power of HS-PDSCH of the 4 user from the serving NodeB. 1 denotes orthogonality factor. Orthogonality is a measure for level of interference caused by own sector signals. For perfectly orthogonal DL channelization codes 1 is equals to 1. In HSDPA technology, code orthogonality is partly lost ( < 1) in wireless radio environment due to multipath propagation [8], [12]. The ratio of 5 ! is a commonly used measure of sector overlap and interference in the network layout. The SINR represents the quality of the received signal. In the downlink direction the receiver input, SINR is defined as
/
! 6
2.2. Network layouts and inter cell interference
interferer are pointing at the null of serving site. Authors of this paper propose a name “Snow Flake” layout for the enhanced cellular network tessellation for six sector site presented in [13]. Snow flake tessellation is shown in Fig1b. This paper presents a novel network layout for 12-sector site, as shown in Fig.1c and calls it as “Flower” layout. SINR calculations include own cell and neighbor cell interference as given in equation (5). These interferences are related to propagation loss i.e. path loss (- and (' between serving NodeB and interfering NodeBs respectively. Especially inter cell interference depends heavily on chosen network layout i.e. how base stations are deployed in a network, antenna configuration, and azimuth. Network layout has significant impact on interference management and hence on capacity of macrocellular network. One way to compare different network layouts or different antenna configurations is to compare the interference coming from neighbor cells to serving cells. It has been shown in [7] that for 3-sector sites, cloverleaf is the most defensive for interference and thus provides high capacity gain. In this article, for 3-sector sites only cloverleaf layout is considered for network simulations.
Fig.1. (a) 3-sector “Cloverleaf” layout
Fig.1. (c) 12-sector “Flower” layout
3.
A
NTENNAT
HEORYThe functionality of antenna depends on number of factors including physical size of an antenna, impedance (radiation resistance), beam shape, beam width, directivity or gain, polarization etc [14]. By definition, an antenna array consists of more than one antenna element. The radiation pattern of an antenna array depends on number of antenna elements used in array. The more elements there are, the narrower beam can be formed. Planar arrays are capable of making a narrow beam in horizontal as well as in vertical plane. Therefore, planar array beams are also called “Pencil Beams”. Smart antennas with ability of beam steering can be constructed by adding “Intelligence” to planar arrays. Smart antenna improves the coverage of cell by concentrating more power in a narrow beam, enhances the cell capacity and offers increased data rates by offering high signal to interference plus noise ratio [15]. By avoiding interference and increasing signal power, smart antenna improves link quality and helps in combating large delay dispersion [16].
In the research work of this paper, three different type of antenna were taken into account i.e.1) Conventional 650 wide beam antenna, 2) Switched beam smart antenna and 3) Full adaptive beam antenna.
3.1. Conventional wide beam antenna
3.2. Switched beam smart antenna
Fig.2. Block diagram of switched beam smart antenna system
Switched beam antenna approach is the extension of conventional cellular sectorisation method, in which single 1200 wide macro sector is divided into several micro sectors. A switched beam antenna is a combination of multiple narrow beams in predetermined directions, overlapping over each other. It covers the desired cell area with finite number of narrow fixed beams, where each beam can serve a single user or multiple users [3]. Switched beam antenna does not steer or adapt the beam with respect to the desired signal. In this type of antenna, a RF switch connected to fixed beams controls the beam selection based on the beam-switching algorithm. A switch selects the “Optimum” beam to provide service to mobile station. The optimum beam here refers to the beam that offers the highest SINR value. In some cases, maximum received power for the user can be used as a beam selection criterion. During user mobility, switched beam antenna tracks the user and continuously updates the beam selection to ensure high quality of service [17]. The general block diagram of switched beam smart antenna system is shown in Fig.2[18].
It consists of an array of antennas that divides the macro sector into several micro sectors. A precise switched beam antenna can be implemented by using “Butler Matrices” [16], [18]. It uses a smart receiver for detecting and monitoring the received signal power for each user at each antenna port. Based on the measurement made by the smart receiver and beam selection algorithm, the control logic block determines the most favorable beam for specific user. The RF switch part governed by the control logic (brain of switched beam antenna) activates the path from the selected antenna port to the radio transceiver. Switched beam antenna offers higher directivity with less interference and thus provides gain over conventional antenna. Theoretically, gain of using switched beam antenna over conventional wide single beam antenna is directly proportional to the number of beams. For a given sector containing U beams, resultant increased gain is given by equation (6) [18]. Switched beam approach is simpler and easier to implement compared to fully adaptive beam approach.
7839 :;<= > ?
Fig.3. (a) Radiation pattern of conventional 650 beamwidth antenna used in 3-sectored site
Fig.3. (b) Radiation pattern of narrow 320 beamwidth antenna used in 6-sectored site
Fig.3. (d) Radiation pattern of switched beam antenna with seven beams of 80 HPBW 3.3. Full adaptive beam antenna
Adaptive antenna exploits the array of antenna elements to achieve maximum gain in desired direction while rejecting interference coming from other directions. Adaptive antennas are more complex than multi beam switched antennas. While butler matrices are operating on the RF domain, adaptive antennas use a linear combination of signals, and process them in the baseband. Adaptive antenna can steer its maxima and nulls of the array pattern in nearly any direction in response to the changing environment [16]. The basic idea behind adaptive antenna is the same as in switched beam antenna i.e. to maximize the SINR values. While the multiple switched beam antennas have a limited selection of directions to choose the best beam, an adaptive antenna can freely steer its beam in correspondence to the location of user. Smart antenna employs Direction of Arrival (DOA) algorithm to track the signal received from the user, and places nulls in the direction of interfering users and maxima in the direction of desired user [19]. On the other hand, since adaptive antennas needs more signal processing, multiple switched beam antennas are easier to implement and have the advantage of being simpler, and less expensive compared to adaptive antennas. The overall capacity gain of smart antennas is expected to be in the range of 100% to 200%, when compared with conventional antennas [3].
Beam forming algorithms used in adaptive antennas are generally divided into two classes with respect to the usage of training signal i) Blind Adaptive algorithm and ii) Non-Blind Adaptive algorithm [20]. In a non-blind adaptive beam forming algorithm, a known training signal d(t) is sent from transmitter to receiver during the training period. The beamformer uses the information of the training signal to update its complex weight factor. Blind algorithms do not require any reference signal to update its weight vector; rather it uses some of the known properties of desired signal to manipulate the weight vector. Fig.4 shows the generic beam forming system based on non-blind adaptive algorithm, which requires a training (reference) signal [19].
The output of the beamformer at time 9, @ 9 , is given by a linear combination of the data at the
A antenna elements. The baseband received signal at each antenna element is multiplied with the weighting factor which adjusts the phase and amplitude of the incoming signal accordingly. The sum of this weighted signal results in the array output@ 9 . On the basis of adaptive algorithms, entries of weight vector B are adjusted to minimize the error C 9 between the training signal
0
x
1
x
w01 − k
w
kw
1w
y(n)) (n d ) ( ) ( )
(n dn yn
e = −
1 − k
x
kx
Fig.4. Block diagram of adaptive beamforming system
@ 9 BE 9 F 9 G
B 9 HI, 9 I 9 J K J I*L, 9 I* 9 M N F 9 HO, 9 O 9 J J K K O*L, 9 O* 9 M P
C 9 D 9 . @ 9 :
where B 9 is the weight vector with I* 9 a complex weight for Ath antenna element at time instant 9, and HK ME denotes Hermitian (complex conjugate) transpose. O* 9 is the received baseband signal at Ath antenna element [9], [20]. Least Mean Square (LMS), Normalized Least Mean Square (NLMS), Recursive Least Squares (RLS), and Direct Matrix Inversion (DMI) are examples of non-blind adaptive algorithm, whereas Constant Modulus Algorithm (CMA) and Decision Directed (DD) algorithms are examples of blind adaptive algorithm [9], [19-20]. These beamforming algorithms have their own pros and cons as far as their computational complexity, convergence speed, stability, robustness against implementation errors and other aspects are concerned.
4.
S
YSTEMS
IMULATIONS4.1. Simulation Environment
Gaussian curve with maximum of 0.97 at site location and 0.7 at cell edge.
Fig.5. (a) Grid of nineteen 3-sector sites used in simulation with clove-leaf topology
Fig.5. (c) Grid of nineteen 12-sector sites used in simulation with flower topology 4.2. Simulation cases and simulation procedure
Following three cases were considered for simulations.
• 3 Sector: It is the most common scenario in which each site has three sectors and every sector has single 650 half power beamwidth antenna. This acts a reference case for comparing with higher order sectorization and advanced antenna case. Fig.3a shows the radiation pattern of an antenna used for simulations, with no electrical or mechanical tilt, and with maximum antenna gain of 15.39dB.
• 6 Sector: It is the case in which each site has six sectors, and every sector has single 320
half power beamwidth antenna. Fig.3b shows the radiation pattern of an antenna used for simulations, with no electrical or mechanical tilt, and with maximum antenna gain of 18.20dB.
• 12 Sector: In this case, each site comprises of 12 narrow sectors, and every sector has 160 HPBW antenna. Fig.3c shows the radiation pattern of an antenna used for simulations, with no electrical or mechanical tilt, and with maximum antenna gain of 21.15dB.
• 7 Switched beams: This case represents multiple fixed switched beam scenario, where
single sector is covered by seven potential narrow beams. Each narrow beam has eight degree HPBW with a spacing of 160 between the beams as shown in Fig.3d. Only that beam which has smallest deviation angle with respect to its main beam for user becomes active for that particular user. No down tilting was assumed, and each beam has maximum antenna gain of 23.55dB.
• Adaptive beam: In this last scenario, adaptive antennas are used to form an accurate beam for each individual user. In this scenario, narrow beam of six degree in the horizontal plane is steered precisely to the serving user, keeping user in the middle of the beam for maximum gain. Adaptive antenna have maximum gain of 24.5dB.
transmission power for HS-PDSCH and available codes were equally distributed among the five users in each TTI. In the serving cell to compute the received signal value, Okumura-Hata model was used to calculate the path loss between the user and serving NodeB. Simulator supports Adaptive Modulation and Coding (AMC), and in these simulations eight different Modulation and Coding Schemes (MCS) were considered with 64QAM 5/6 coding rate as highest and QPSK 1/2 coding rate as lowest possible MCS. As throughput is the function of SINR, hence later SINR information was employed to compute each user throughput. Cell throughput in each TTI is the sum of individual users’ throughput. Post processing of data was done to get the results in refined form.
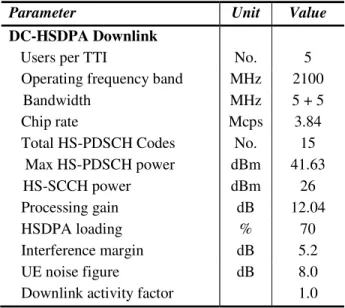
Table I. General DC-HSDPA simulation parameters
Parameter Unit Value
DC-HSDPA Downlink
Users per TTI No. 5
Operating frequency band MHz 2100
Bandwidth MHz 5 + 5
Chip rate Mcps 3.84
Total HS-PDSCH Codes No. 15
Max HS-PDSCH power dBm 41.63
HS-SCCH power dBm 26
Processing gain dB 12.04
HSDPA loading % 70
Interference margin dB 5.2
UE noise figure dB 8.0
Downlink activity factor 1.0
5.
S
IMULATIONR
ESULTS ANDA
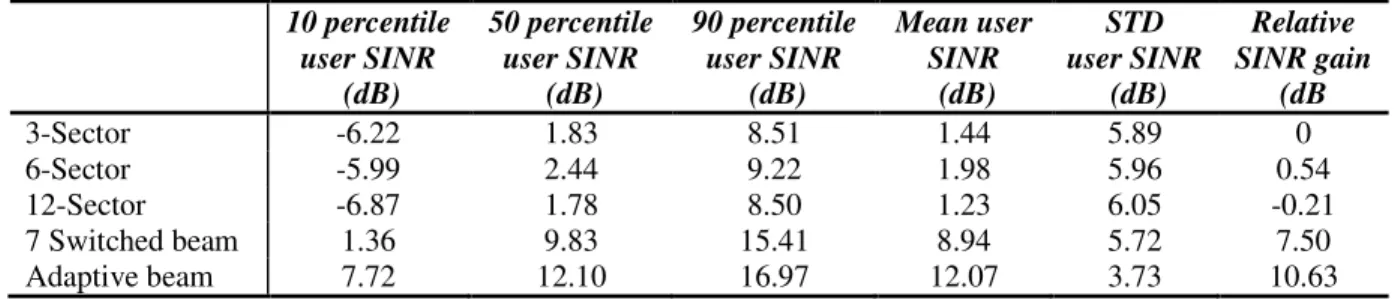
NALYSISFig.6 shows the Cumulative Distribution Function (CDF) of the user SINR with 5 users per TTI at 1000m ISD for different cases. Clearly switched beam antenna shows better performance in terms of offering higher SINR compared to 650, 320, and 160 wide beam antenna used in 3-sector, 6-sector and 12 sector sites respectively. But adaptive beam antenna outperforms and shows superior performance compared to all other cases. By analyzing the curves shown in Fig.6 it can be deduced that adaptive and switched beam antennas served the purpose of improving user experience by reducing the interference and enhancing the received SINR. The CDF curve of SINR for the case of adaptive beam is on the extreme right position, indicating that the SINR for the users is improved on average. It is also important to note that the average user SINR does not deteriorate by increasing the order of sectorization and almost similar performance is shown by 3-sector, 6 sector and 12-sector sites. However, 6-sector site offers slightly better performance compared to 3 and 12-sector sites. Adaptive beam antenna performed well in the close vicinity of the NodeB as well as near the cell edge, as 80% of the samples are concentrated in a narrow range of 9.12dB, starting from 7.72dB to 16.84dB of user SINR. But for other traditional antenna cases, eighty percent of SINR values has wide span and spread over the range of around 14.96dB, starting from -6.3 to 8.66dB. Statistical analysis of user SINR is presented in Table II.
Table II. Statistical Analysis of User SINR
10 percentile user SINR
(dB)
50 percentile user SINR
(dB)
90 percentile user SINR
(dB)
Mean user SINR
(dB)
STD user SINR
(dB)
Relative SINR gain
(dB
3-Sector -6.22 1.83 8.51 1.44 5.89 0
6-Sector -5.99 2.44 9.22 1.98 5.96 0.54
12-Sector -6.87 1.78 8.50 1.23 6.05 -0.21
7 Switched beam 1.36 9.83 15.41 8.94 5.72 7.50
Adaptive beam 7.72 12.10 16.97 12.07 3.73 10.63
Fig.7. CDF plot of cell SINR with five users per TTI at 1000m ISD
Fig.7 shows the cumulative distribution function of SINR value averaged over the whole cell with 5 users per TTI at 1000m ISD for different simulated cases. Averaged SINR value over the whole cell area in each iteration of Monte Carlo simulation was obtained by adding the linear SINR value of each user and then divide the sum by number of users served per TTI. It can be seen that 6-sector deployment helps in improving the cell SINR by a small margin of 0.51dB only compared to 3-sector deployment, but a significant improvement of 7.02dB and 9.11dB is witnessed in case of switched beam and adaptive beam case respectively. Smart antennas not only improve the user experience rather they improve the overall cell SINR as well. It is also evident that the multiple switched beam antenna offers improvement in SINR but the difference is smaller compared to adaptive antenna. Statistical analysis of cell SINR is given in Table III.
Table III. Statistical Analysis of SINR over whole Cell
10 percentile cell SINR
(dB)
50 percentile cell SINR
(dB)
90 percentile cell SINR
(dB)
Mean cell SINR
(dB)
STD cell SINR
(dB)
Relative SINR gain
(dB
3-Sector 0.49 3.91 7.79 4.07 2.94 0
6-Sector 0.91 4.63 8.14 4.58 2.85 0.51
12-Sector 0.21 3.94 7.31 3.84 2.80 -0.23
7 Switched beam 8.19 11.28 13.68 11.09 2.14 7.02
Fig.8. CDF plot of user throughput with 5 users per TTI at 1000m ISD
Fig.8. shows the CDF of the user throughput of DC-HSDPA network with 5 users per TTI at 1000m ISD for different antenna solutions. Eight marks on CDF plots represent eight different MCS. As equal codes and equal power was distributed among the users, therefore high throughput samples show that high modulation and coding scheme was used by the user. High MCS are less robust against interference and thus have high requirement of SINR. It is interesting to note that around 4.5% of the users were able to adapt 64QAM in 3-, 6-, and 12-sector case, whereas this number was raised to 39.98% and 61.8% by switched and adaptive beam antennas respectively. As seen from the results, more than 85% of the samples with adaptive beam were obtained with three highest MCS. Samples of zero throughputs in CDF plots represent the users with no data transfer due to very low SINR. It was also noted that single wide beam antenna keeps the probability of no data transfer at almost 15%. Whereas, switched beam antenna and adaptive beam antenna show remarkable improvement in probability of no data transfer and kept it at negligible level of 2.88% and 0.16% respectively. These results clearly indicate the impact of advanced antenna techniques in improving the user experience, when other cells are heavily loaded and are severely interfering the serving cell.
relative gain of 156.7%, however switched beam have relative gain of 109.27%. Statistical analysis of cell throughput is shown in Table IV.
Fig.9. CDF plot of cell throughput with five users per TTI at 1000m ISD Table IV. Statistical Analysis of Cell Throughput
10 percentile cell throughput
(Mbps)
50 percentile cell throughput
(Mbps)
90 percentile cell throughput
(Mbps)
Mean cell throughput
(Mbps)
STD cell throughput
(Mbps)
Relative throughput gain (%)
3-Sector 6.72 10.56 15.36 10.90 3.40 0
6-Sector 7.20 11.52 16.32 11.72 3.67 7.52
12-Sector 6.24 10.56 15.36 10.77 3.59 -1.20
7 Switched beams 17.28 23.04 28.32 22.81 4.23 109.27
Adaptive beam 24.0 28.32 31.68 27.99 3.03 156.70
Fig.10. Mean cell throughput with five users per TTI against ISD
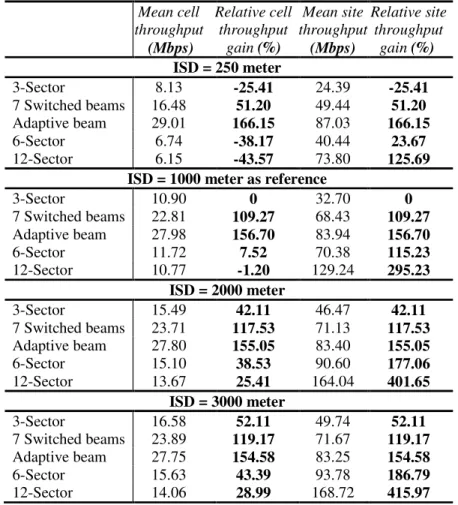
Fig.11 shows the achieved mean site throughput for DC-HSDPA system against the intersite distance for different cases. As seen in Fig.11, applying higher order sectorization and deploying advance antenna techniques provides significant throughput gain over traditional 3-sector site topology. Relative site throughput gain for 6-sector and 12-sector topology is higher at large intersite distances than small ISD. With respect to the reference case of 3-sector site at 1000m ISD, when intersite distance is reduced to 250m (small cell) for 3-sector site, mean site throughput is reduced by 25.41%. However, a relative throughput gain of approximately 23.67% and 125.69% is achieved by 6-sector and 12-sector sites respectively at 250m ISD, which is comparatively small compared to 164.04% and 401.65% by 6 and 12-sector sites respectively at 2000m ISD. Adaptive antenna beam outperformed at 250m ISD and was found more effective at small ISD. More detailed analysis of site throughput and the relative gain is presented in Table V. Relative gains shown in Table V are with respect to reference case 3-sector site at 1000m ISD. Negative value of gains means inferior performance.
Table V presents the average downlink throughput and relative sector (cell) gain with respect to 3-sector at 1000m ISD (reference case).
Table V. Statistical Analysis of Cell Throughput
Mean cell throughput
(Mbps)
Relative cell throughput
gain (%)
Mean site throughput
(Mbps)
Relative site throughput
gain (%)
ISD = 250 meter
3-Sector 8.13 -25.41 24.39 -25.41
7 Switched beams 16.48 51.20 49.44 51.20
Adaptive beam 29.01 166.15 87.03 166.15
6-Sector 6.74 -38.17 40.44 23.67
12-Sector 6.15 -43.57 73.80 125.69
ISD = 1000 meter as reference
3-Sector 10.90 0 32.70 0
7 Switched beams 22.81 109.27 68.43 109.27
Adaptive beam 27.98 156.70 83.94 156.70
6-Sector 11.72 7.52 70.38 115.23
12-Sector 10.77 -1.20 129.24 295.23
ISD = 2000 meter
3-Sector 15.49 42.11 46.47 42.11
7 Switched beams 23.71 117.53 71.13 117.53
Adaptive beam 27.80 155.05 83.40 155.05
6-Sector 15.10 38.53 90.60 177.06
12-Sector 13.67 25.41 164.04 401.65
ISD = 3000 meter
3-Sector 16.58 52.11 49.74 52.11
7 Switched beams 23.89 119.17 71.67 119.17
Adaptive beam 27.75 154.58 83.25 154.58
6-Sector 15.63 43.39 93.78 186.79
12-Sector 14.06 28.99 168.72 415.97
6.
C
ONCLUSIONwith adaptive beam antenna compared to 3-sector site at 1000m ISD. Adaptive beam antenna outperformed and offered high SINR, high throughput with low probability of no data transfer. Multiple switched beam antenna showed better performance compared to single beam antenna but inferior to adaptive beam. Three-sector and higher order sectorization offer almost 15% of probability of no data transfer for the user at 1000m ISD. Switched beam antenna helps in improving the probability of no data transfer and kept it at almost 2.88%, but adaptive antenna significantly improved probability of no data transfer and brought it down to 0.16% at 1000m ISD. Simulation results revealed that the user experience and the macro cell capacity can be significantly improved by deploying smart antennas. Higher order sectorization does not improve much the cell (sector) capacity, but definitely offers higher site capacity. Especially at large ISD, high order sectorization is more effective and significantly increases the site capacity. To avoid the deployment of small cells, usage of adaptive and switched beam antennas or higher order sectorization can be considered as an alternate choice.
The results were obtained by using semi-statistic simulations with Okumura-Hata propagation model, and thus may cause offset type of error in all results. However, the obtained results are still comparable with each other to show capacity improvements. For future work, it would be interesting to see the performance of fixed switched beam antenna with narrower and even more number of beams in a cell, as in this paper seven beams of 80 were considered in each cell.
A
CKNOWLEDGEMENTSAuthors would like to thank Tampere University of Technology, European Communications Engineering (ECE) Ltd. and Tampere Doctoral Program of Information Science and Engineering (TISE) for supporting the research work of this paper.
R
EFERENCES[1] W.C.Y. Lee, “Mobile communications design fundamentals”, John Wiley & Sons, Inc., 1993. [2] L. C. Wang, K. Chawla, L. J. Greenstein, “Performance Studies of Narrow-Beam Trisector Cellular
Systems,” International Journal of Wireless Information Networks, Vol. 5, No. 2, 1998, pp. 89-102. [3] I.V. Stevanovi , A. Skrivervik, J. R. Mosig, “Smart antenna systems for mobile communications”.
Laboratoire d'Electromagnetisme et d'Acoustique Ecole Polytechnique Federale de Lausanne, January 2003.
[4] A. Wacker, J. Laiho-Steffens, K.Sipilä, K. Heiska, “The impact of the base station sectorisation on WCDMA radio network performance,” in Proc. 50th IEEE Vehicular Technology Conference, 1999, pp. 2611-2615.
[5] B. C. V. Johansson, S. Stefansson, “Optimizing Antenna Parameters for Sectorized W-CDMA Networks,” in Proc. IEEE Vehicular Technology Conference, 2000, pp. 1524-1531.
[6] J. Niemelä, T. Isotalo, J. Lempiäinen, “Optimum Antenna Downtilt Angles for Macrocellular WCDMA Network,” EURASIP Journal on Wireless Communications and Networking, vol. 5, 2005. [7] J. Itkonen, B. Tuszon, J. Lempiäinen, “Assessment of network layouts for CDMA radio access”,
EURASIP Journal on Wireless Communications and Networking, Volume 2008
[8] J. Lempiäinen, M. Manninen, “Radio interface system planning for GSM/GPRS/UMTS”, Kluwer Academic Publishers. 2001.
[9] C.S. Rani., P.V. Subbaiah., K.C. Reddy, “LMS and RLS Algorithms for smart antennas in a CDMA mobile communication environment”. International Journal of the Computer the Internet and Management (IJCIM), Vol.16 No.2, May-August 2008.
[10] E. Dahlman, S. Parkvall, J. Skold, "3G Evolution: HSPA and LTE for mobile broadband", Academic press, First edition, 2007.
[12] D. Soldani, M. Li, and R. Cun & Sons Ltd, 2006.
[13] A. Chheda, F. Bassirat, “ Enha cells ”, U.S.Patent 5960349, 28 [14] J. D. Kraus, R. J. Marhefka, “A [15] R. Kawitkar, “Issues in deploy Academy of Science, Engineer [16] A. F. Molisch, “Wireless comm [17] D. Cabrera, J. Rodriguez, “Sw
cellular communication”, Com [18] A.U. Bhobe, P.L. Perini, “An IEEE Aerospace Conference, V [19] C.S. Rani., P.V. Subbaiah.,
communication systems”, Inter Vol.8 No. 7, July 2008. [20] S. Hossain, M.T. Islam, S. Seri
International conference on con
Authors
Muhammad Usman Sheikh was bo B.S. degree in Electrical Engineerin Information Technology, Islamabad Radio Frequency Electronics from T 2009. Currently, he is working towa are radio network planning aspects networks. He is student member of I
Jukka Lempiäinen was born in H Tech, Dr Tech. all in Electrical En Espoo, Finland, in 1993, 1998 and President of European Communicat ten years experience in GSM based he is also a part-time Professor University of Technology, Finland cellular radio planning, several inter URSI National Board Member, Finla
Hans Ahnlund was born in Porjus, from Lund University of Technolog European Communications Enginee Radio Network Planning, Optimiza the wireless technology sector.
uny, “QoS and QoE management in UMTS cellular systems hanced cellular network layout for CDMA networks havin 28th September 1999.
“Antennas for all applications”. 3rd ed. 2001, McGraw-Hill loying smart antennas in mobile radio networks,” Proceed ering and Technology Vol.31, July 2008, pp. 361-366, ISS mmunications”. 2nd edition. UK 2011, John Wiley & Sons Switched beam smart antenna BER performance analysis f mputer Research Conference CRC2004, Puerto Rico, April n overview of smart antenna technology for wireless com , Vol.2, pp. 875-883, 2001.
h., K.C. Reddy, “Smart antenna algorithms for WC ternational Journal of Computer Science and Network Secu erikawal, “Adaptive beamforming algorithms for smart ante control, automation and systems, ICCAS 2008. p. 412–416.
born in Rawalpindi, Pakistan, in 1983. He received the ring (Telecommunication) from COMSATS Institute of ad, Pakistan, in 2006. He received the M.S. degree in Tampere University of Technology (TUT), Finland, in wards the Dr. Tech. degree. His main research interests
ts of GSM/UMTS/LTE networks and traffic handling in f IEEE.
Helsinki, Finland, in 1968. He received an MSc, Lic ngineering, from Helsinki University of Technology, nd 1999, respectively. He is a Senior Partner and the cations Engineering Ltd. He has altogether more than ed mobile network planning and consulting. Currently, r of the Telecommunications (Radio Network Planning nd. He has written two international books about GSM ternational journal and conference papers and he has three nland.
s, Sweden in 1968. He received his M.Sc. (EE) degree ogy in 1994. He is Vice President and board member of eering. He is one of the authors of the book 'UMTS ation and QoS Management'. He holds two patents in
ms”. John Wiley ving six-sectored
ill.
edings of World SN 1307-6884. s Ltd.
s for 3G CDMA ril 2004. communication”,
CDMA mobile curity (IJCSNS), ntenna systems”,
6.
in the multilayer