www.atmos-chem-phys.net/10/11385/2010/ doi:10.5194/acp-10-11385-2010
© Author(s) 2010. CC Attribution 3.0 License.
Chemistry
and Physics
Inter-community variability in total particle number concentrations
in the eastern Los Angeles air basin
N. Hudda, K. Cheung, K. F.Moore, and C. Sioutas
University of Southern California, Sonny Astani Department of Civil and Environmental Engineering, 3620 S Vermont Ave., Los Angeles, CA, 90089, USA
Received: 7 April 2010 – Published in Atmos. Chem. Phys. Discuss.: 7 June 2010
Revised: 13 November 2010 – Accepted: 16 November 2010 – Published: 1 December 2010
Abstract. Ultrafine Particles (UFP) can display sharp gra-dients in their number concentrations in urban environment due to their transient nature and rapid atmospheric process-ing. The ability of using air pollution data generated at a central monitoring station to assess exposure relies on our understanding of the spatial variability of a specific pollutant associated with a region. High spatial variation in the con-centrations of air pollutants has been reported at scales of 10s of km for areas affected by primary emissions. Spatial vari-ability in particle number concentrations (PNC) and size dis-tributions needs to be investigated, as the representativeness of a monitoring station in a region is premised on the assump-tion of homogeneity in both of these metrics. This study was conducted at six sites, one in downtown Los Angeles and five located about 40–115 km downwind in the receptor areas of Los Angeles air basin. PNC and size distribution were mea-sured using Condensation Particle Counters (CPC) and Scan-ning Mobility Particle Sizer (SMPS). The seasonal and diur-nal variations of PNC implied that PNC might vary signifi-cantly with meteorological conditions, even though the gen-eral patterns at the sites may remain gengen-erally similar across the year due to consistency of sources around them. Region-ally transported particulate matter (PM) from upwind urban areas of Los Angeles lowered spatial variation by acting as a “homogenizing” factor during favorable meteorological con-ditions. Spatial variability also increased during hours of the day during which the effects of local sources predominate. The spatial variability associated with PNC (quantified us-ing Coefficients of Divergence, CODs), averaged about 0.3, which was generally lower than that based on specific size ranges. Results showed an inverse relationship of COD with particles size, with fairly uniform values in the particle range
Correspondence to:C. Sioutas ([email protected])
which is associated with regional transport. Our results sug-gest that spatial variability, even in the receptor regions of Los Angeles Basin, should be assessed for both PNC and size distributions, and should be interpreted in context of seasonal and diurnal influences, and suitably factored if values for ex-posure are ascertained using a central monitoring station.
1 Introduction
Numerous recent epidemiological and toxicological studies investigating associations between particulate pollution and health effects have attributed greater risk to ultrafine parti-cles (UFP, diameter less than∼100 nm) (Oberd¨orster et al., 1995; Donaldson et al., 1998; Gong et al., 2007; Xia et al., 2006; Delfino et al., 2005, 2009) compared to particles of greater diameters. In vitro toxicological studies have also shown that ultrafine particles have higher oxidative potential and can penetrate and destroy mitochondria within epithelial cells (Li et al., 2003). Penttinen et al. (2001) found that daily mean number concentration and peak expiratory flow (PEF) are negatively associated and that the effect is most promi-nent for particles in the ultrafine range. A study by Peters et al. (1997) also found associations between number concen-trations of ultrafine PM and lowered PEF among asthmatic adults.
Although current federal standards for particulate matter (PM) are mass-based, there is increasing evidence that a number-based standard might be better suited for UFP con-centrations and the associated risks (Englert et al., 2004), since UFP are more numerous and contribute little to PM mass (Hinds, 1999). Current standards are based on PM2.5
and PM10, although poor correlation has been reported
be-tween PNC (dominated by UFP) and PM2.5(dominated by
is PM2.5 not an adequate surrogate measure, but also such
data is often used from central monitoring stations to ascer-tain exposure values that might lead to exposure misclas-sification due to spatial variability in UFP concentrations (Delfino et al., 2005). Urban environments are often charac-terized by a complex set of factors (sources, meteorology, so-lar radiation, mixing height, and topography amongst others) that can influence not only the particulate matter (especially ultrafine particles) concentration, but also its spatial variabil-ity (Costabile et al., 2009). Using a central monitoring sta-tion assumes a homogeneous distribusta-tion of UFP over large spatial scales, but recent works of Kim et al. (2002), Zhu et al. (2002a, b), Tuch et al. (2006), Puustinen et al. (2007), Krudysz et al. (2009) and Moore et al. (2009) all suggest that UFP vary spatially at local as well as regional scales and use of central monitoring stations can lead to a bias in exposure assessment given the variability (Cyrys et al., 2008; Puusti-nen et al., 2007; Jerrett et al., 2005; Monn et al., 2001).
In urban areas, a dominant source of UFP is primary emis-sions from vehicular sources (Shi et al., 2001; Phuleria et al., 2005; Fine et al., 2004b) and as much as 80% particles can be in the UFP size range (Morawska et al., 1998; Shi et al., 2001; Sioutas et al., 2005). Other combustion sources, such as food cooking and wood burning, can also be sources of ultrafine particles to the atmosphere (Kleeman et al., 1999; Schauer et al., 2001). Shi et al. (2001) have shown that nanoparticles from fresh emissions can be persistent in ur-ban atmospheres, given the multiplicity of sources. Zhu et al. (2002a, b, 2005, 2006) have shown that UFP concentra-tions can decay exponentially with distance from the free-ways. Consequently, given their short lifetimes, the gradient of UFP concentration in atmosphere can be strong (Sioutas et al., 2005).
In addition to primary, or direct, ultrafine particle emis-sions, photochemical reactions in the atmosphere may also be responsible for the formation of secondary ultrafine par-ticles. Kulmala et al. (2004) reviewed particle formation by secondary processes and showed that such particle formation events are more distinct in summer. Particle formation rates depend strongly on the intensity of solar radiation, but the exact mechanism by which the process occurs is not fully understood (Zhang et al., 2002). Once formed, particles are transformed in the atmosphere, by coagulation and conden-sation of semivolatile vapors on their surface as they are ad-vected downwind. This long-range transport as well as pho-tochemical particle formation in the atmosphere can lead to increased particle number observations downwind of urban areas (Kim et al., 2002; Fine et al., 2004b; Verma et al., 2009; Ning et al., 2007).
In large urban areas like the Los Angeles air basin (LAB), both primary direct emissions and also transported aged aerosols from locations upwind (some potentially distant) contribute to the observed PM levels. This spatial transport of PM, coupled with local factors like the micrometeorol-ogy of a site and its exposure to local sources, can produce
distinct diurnal patterns, which vary spatially over scales at which inter-community variability can be assessed. It has been suggested (Turner et al., 2008) that secondary forma-tion during regional transport can be a homogenizing factor on spatial variability. However, in 2002 and 2003, investiga-tors in the USC Children’s Health Study (Sardar et al., 2004; Singh et al., 2006) made measurements at several areas in LAB and found that, although some sites may exhibit sim-ilar diurnal patterns, PNC may still vary considerably, and have only a modest correlation even among proximate sites. Lianou et al. (2007) found that the spatial variation in PNC might far exceed that in particulate mass concentrations. Fine et al. (2004a, b) have also shown that sites in the receptor ar-eas of LAB can have different particle size distribution pat-terns as well as different PNC diurnal patpat-terns.
Thus, in order to better quantify the risk that ultrafine PM (UFP) poses to human health, it is necessary to characterize its spatial variability to better assess the potentially different population exposure to UFP, both in terms of particle num-bers as well as the size distribution, compared to PM mass.
2 Experimental methods
This study is a second phase of an investigation of the intra-and inter-community variability of PNC in the greater Los Angeles Area. The earlier phase focused exclusively on the area of the Los Angeles – Long Beach Harbor and has been reported in Moore et al. (2009) and Krudysz et al. (2009).
This study was conducted at five sites in eastern Los An-geles air basin and another site in downtown Los AnAn-geles during November 2008–December 2009. Site Information is provided in Table 1 and the actual locations of these sites are shown in Fig. 1. Highways and major arterials, com-mon sources of ultrafine particles, are identified in Fig. 1. The distances to freeways are also tabulated in Table 1. The sites in the receptor area were within 50 km of each other in the E-W direction and 20 km in the N-S direction. Sampling sites were located in areas where there were no known major contributors to UFP, except for local traffic (e.g., residential neighborhoods).
3 Site descriptions
Table 1a. Site information including the designation code, geographic co-ordinates, site and equipment elevations, sampling period and (CPC) data recoverya.
Site ID Latitude Longitude Site Inlet Distance from Sampling Data
elevation (m) elevation (m) nearest Freeway (m), period recovery (%)
[Average Vehicles/day]
USC 34◦1′9′′N 118◦16′39′′W 61 4.6 120, [112 000] 11/17/2008–12/21/2009 91%
DIA 34◦0′1′′N 117◦49′54′′W 223 2.0 200, [99 000] 02/25/2009–12/21/2009 96%
UPL 34◦6′14′′N 117◦37′45′′W 386 1.9 2000, [96 000] 11/17/2008–12/21/2009 90%
VBR 33◦59′45′′N 117◦29′31′′W 220 1.9 3000,[85 000] 11/17/2008–04/30/2009 95%
RUB 33◦59′58′′N 117◦24′58′′W 248 2.0 200,[72 000] 11/17/2008–12/21/2009 93%
AGO 33◦57′41′′N 117◦20′0′′W 323 2.1 750,[81 000] 11/17/2008–12/21/2009 98%
aThe SMSP were operated at sites USC, UPL and AGO from 5 September 2009–21 December 2009 at greater than 90% data recovery.
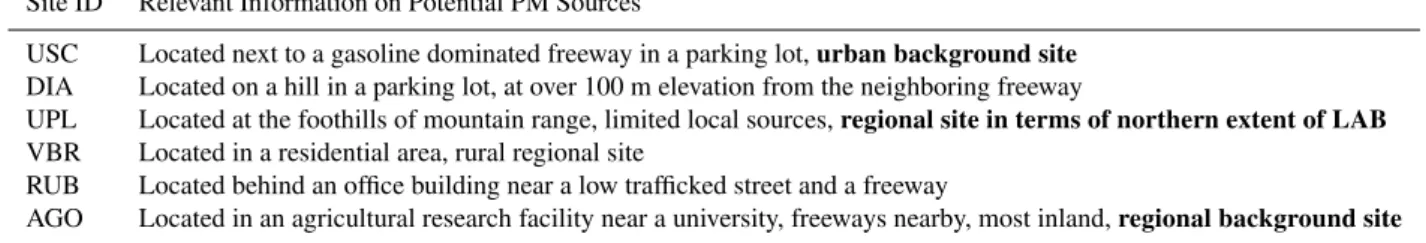
Table 1b.Relevant Information on Potential PM Sources.
Site ID Relevant Information on Potential PM Sources
USC Located next to a gasoline dominated freeway in a parking lot,urban background site
DIA Located on a hill in a parking lot, at over 100 m elevation from the neighboring freeway
UPL Located at the foothills of mountain range, limited local sources,regional site in terms of northern extent of LAB
VBR Located in a residential area, rural regional site
RUB Located behind an office building near a low trafficked street and a freeway
AGO Located in an agricultural research facility near a university, freeways nearby, most inland,regional background site
Fig. 1.Location of sampling sites in Los Angeles air basin.
basin where the urban center is located in the basin. It is con-trasted against the effect of transport and aging observed at “receptor” or “regional background” sites, which are down-wind in the eastern region of the basin towards which the meteorology of the basin transports the pollutants from the source region.
The Diamond Bar site “DIA” is located about 60 km inland from the Pacific Ocean and 40 km east of USC site. The site
is located 200 m south of the CA-60 freeway. It is the first site in eastern LAB cluster along a typical trajectory over which primary aerosols emitted in the west and central parts of LA are being transported during atmospheric aging (Pan-dis et al., 1992). However, it is located on a hill in the promi-nent upwind direction and is therefore not directly impacted by traffic emissions throughout the day.
The Upland site “UPL” is located in a mobile home park in Upland that is about 80 km inland from the ocean and about 60 km east of USC site. It is over 2 km away from the neigh-boring freeways and surrounded by low trafficked streets. The site is located close the base of the San Gabriel Moun-tains, which act as a barrier for further transport of aerosols in northern direction The site is therefore influenced mostly by the aged aerosol advected eastwards from urban Los Angeles (Fine et al., 2004b).
The Van Buren site, “VBR”, is located 97 km inland and 57 km east of USC at a South Coast Air Quality Monitor-ing District (AQMD) samplMonitor-ing station in a rural residential neighborhood. It is 3 km (south) from the nearest freeway and the major roadways next to the site have low traffic load. A substantial component of PM at this site can be attributed to the PM advected from the west to this area after hours of aging. This site has also been discussed in (Pakbin et al., 2010; Moore et al., 2010).
CA-60, situated about 200 m to its south. This site is im-pacted by similar sources as VBR, with the additional influ-ence of the neighboring freeway.
The site “AGO” is located in Riverside within the premises of the Citrus Research Center and the Agricultural Experi-ment Station of the University of California, Riverside. It is 8 km further east of RUB, and similarly influenced in terms of PM sources. It is about 750 m southwest of CA-60/I-215. This was the furthermost inland site, located at the periphery of what can be termed as the populous region of the LAB, and represents a regional background in terms of the eastern extent of LAB. Except for the neighboring freeway, it has no other primary emission sources nearby.
Particle number size distributions (PNSD) were measured at USC, the urban background site located in the source re-gion of the LAB as well as at UPL and AGO, both in the receptor region of the basin, with UPL being at its northern edge and AGO at its eastern.
3.1 Instrumentation
Total particle number concentrations were measured at all sites using Condensation Particle Counters (CPC, Model 3022A, TSI, Inc., Shoreview, MN). A Scanning Mobility Particle Sizer (SMPS, Model 3936, TSI, Inc., Shoreview, MN) was used at select sites to measure the particle size distributions. The CPC used can measure with about 100% efficiency particles above 20 nm and has 50% detection ef-ficiency for a diameter of 7 nm. The upper size range for detection is 3 µm. The CPC recorded data at one-minute in-terval. The sampling rate was maintained at 1.5±0.2 liters per minute and the air stream was not conditioned prior to sampling. The SMPS system consists of a long Dif-ferential Mobility Analyzer (DMA Model 3081, TSI, Inc., Shoreview, MN) and CPC 3022A (operating at 0.3±0.03 liters per minute, sheath air was not pre-conditioned), set to 5 min scans covering the size range 14–736 nm. TSI soft-ware Aerosol Instrumentation Manager was used to collect data from both the CPC and the SMPS. Weekly site visits were made to ensure proper equipment operation and per-form maintenance. Flow rates were checked weekly and maintained within the range indicated in this section. All inlets used to sample ambient aerosols were copper tubes of 1 cm diameter.
Meteorological data, i.e., temperature, relative humidity, wind speed and direction amongst other parameters were collected using Vantage Pro 2 Weather Stations (Davis In-struments, Hayward, CA). The meteorological station was placed above the enclosure and the wind vane sampled at a height of 5 m from the ground surface. The meteorological data were compared with neighboring AQMD stations with more standardized meteorological equipments, and only for wind speed and direction slight differences were observed. This was because of lower height of our equipment. Even
then, the diurnal patterns of these parameters were consistent with those reported by AQMD.
All particle equipment was placed in an air-conditioned enclosure, but there were instances in summer when temper-atures exceeded the optimum operation temperature for the equipment (∼35◦C) and the data were screened out for such instances. At times during summer, water condensation was observed in the CPC. The CPC reservoirs were drained and the data for such events has been excluded from analysis. 3.2 Data processing and validation
Given the high temporal resolution of the data (i.e., 1-min particle number concentration, 5-min size distribution scans, wind speed, wind direction, temperature, relative humidity, and other parameters collected up to a year at 6 sites) it was not practical to provide detailed description and inter-pretation of all data. Therefore, in this paper we present data as hourly averages and for consistency, the hourly av-erages are reported in local time for the entire year. All collected data were thoroughly reviewed for irregularities, similar to the work of Puustinen et al. (2007). Data were not included in averages if the counts reported were be-low 1000 particles/cm3or exceeded 106particles/cm3, which were associated with electronic errors in CPC. The data re-covery rates are reported in the Table 1. The lowest data recovery was reported for June 2009, when we experienced excessive water condensation inside the CPC butanol reser-voirs. Data from site VBR are not reported after April 2009, as the measured concentrations were unreliable due to CPC malfunction. CPCs were operated side-by-side at USC for a 24-h period before the commencement of the sampling campaign to ascertain consistency. Data analysis indicated that the average slope of a CPC against the “mean” CPC was 0.98±0.16 and the range was 0.72–1.26. At the end of the study, the CPCs were set up to run side-by-side for over 48 h and each CPC concentration was compared to the concentrations measured by a factory-calibrated CPC. The correlation coefficient between all the CPCs was in the range 0.86–0.99, even though two CPC reported an average slope less than 0.7 against a factory-calibrated CPC. We elected to compare CPCs with a unit calibrated by the factory instead of the mean of the CPC values because the CPCs had been operating in field continuously for over two years, and sev-eral units used in earlier studies by our group had shown per-formance deterioration with prolonged field use. The data were corrected (assuming a linear deterioration in perfor-mance over the span of operating period) to compensate for the inconsistency between the CPCs. No corrections were made for diffusion losses, due to different inlet lengths, be-cause our earlier characterization showed that they are in-significant (Moore et al., 2009).
divergence (COD) to analyze the relationship between sites. While parameters such as the correlation coefficient are of-ten used to quantify a linear relationship between data sets, and in this context would quantify a fraction of observations at a particular site that can be explained in terms of simul-taneous observations made at another sites, a high correla-tion between paired sites would only imply uniform tempo-ral variation (Lianou et al., 2007), but not the variability in it-self amongst sites. The COD is in this context more suitable to characterize this spatial variability (Wilson et al., 2005; Krudysz et al., 2009; Moore et al., 2009). It is defined as:
CODj k= v u u t
1
n n X
i−1
x
ij−xik
xij+xik 2!
(1)
wherej,k are two sites,n is the number of simultaneous observations. The value of COD varies from 0 (the con-centration being identical at the two sites) to 1 (the concen-tration being different). A low value of COD represents a high level of homogeneity between sites and a value of COD above roughly 0.2 is considered to be generally heteroge-neous (Wilson et al., 2005).
4 Results and discussion 4.1 Meteorology
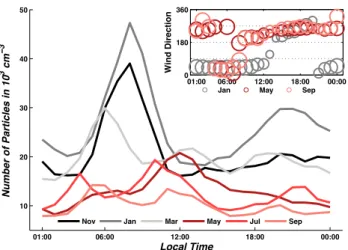
Meteorological conditions can influence ultrafine particle concentrations significantly, but the Los Angeles area ex-hibits relatively limited diurnal and seasonal variation, as was the case during the study period. The mesoscale meteorol-ogy of the area that is most relevant in context of this study is the interaction of coastal winds with the San Gabriel Moun-tains. The pollution generated in west LA during the morn-ing is transported over the course of several hours of agmorn-ing toward the eastern portion of the Los Angeles Basin and up the southern flanks of the San Gabriel Mountains. The strong subsidence inversion layer, frequently present over the area in the winter and almost always in the summer, limits the ver-tical dispersion and westerly sea breeze, which sets in dur-ing the afternoons, transports this pollution further inland. This is also evident from inset plots in Figs. 2a, 3a, 4a show-ing vector average wind direction durshow-ing three months (Jan-uary, May and September) of 2009. Across the sites, winds were observed from the west during afternoons, at relatively higher speeds than most hours of the day. As the mixing layer stabilizes during evenings, the trapped pollutants can linger overnight and then be re-entrained to the surface during early morning hours in east LA (Lu et al., 1994, 1995). The parti-cle number concentrations and the size distributions will be discussed in this context.
Meteorology of the Los Angeles Basin and its effects on air pollutant’s movements has been discussed in greater de-tail by Blumenthal et al. (1978), Lu et al. (1994, 1995),
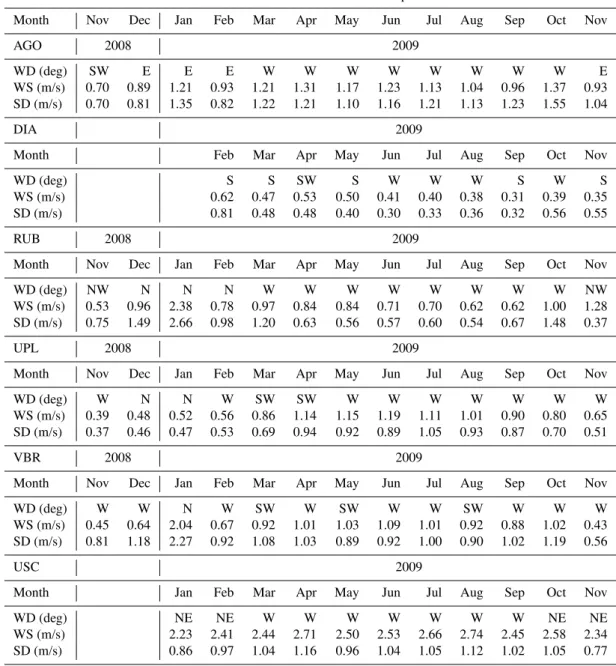
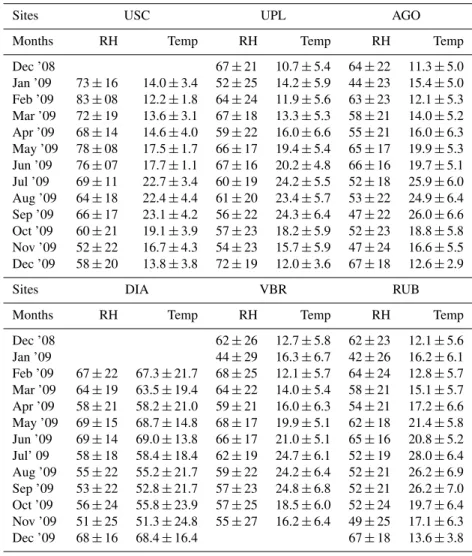
McElroy et al. (1986, 1983), Shultz et al. (1982), Ulrickson et al. (1990) and Wakimoto et al. (1986). Tables 2 and 3 present an overview of select data for the stable meteorolog-ical conditions at sampling sites. Air temperatures do not vary much across sites and the seasonal trend across sites is quite similar, with slightly lower temperatures observed at sites further inland during winter. January was warmer than February, and September across sites was at least as warm as or warmer than August, which is quite typical of the area. The relative humidity at all sites was consistent during sam-pling period, except during Santa Ana winds that brought in dry winds from the desert, due to a synoptic high-pressure system, also typical of this time of the year in southwest Unites States. The predominant wind direction at the sites, except for winter months (December–February), was from the west, with stronger winds from the west recorded during afternoons and nighttime stagnation being the most dominant winds speed characteristics in the basin.
4.2 Diurnal and seasonal variations
In this section, particle number concentrations (PNC) for dif-ferent sites are discussed as diurnal, hourly averaged, data for selected months. Alternate months of the year were chosen (unless another particular month was more relevant) to maintain clarity in graphs and to illustrate the similari-ties/differences across the diurnal, seasonal and spatial trends observed at these sites. The relative standard error was less than 5%. The hourly average data presented is an arithmetic mean. Further, the CODs are discussed in context of the spa-tial variability.
01:00 06:00 12:00 18:00 00:00 10 20 30 40 50 Local Time
Number of Particles in 10
3 cm
−
3
01:00 06:00 12:00 18:00 00:00 0
180 360
Wind Direction
Jan May Sep
Nov Jan Mar May Jul Sep
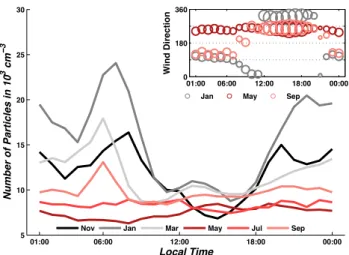
Fig. 2a.Hourly average particle number concentration at USC plot-ted for hours of the day in local time. The relative standard error for the hourly averages reported above was less than 2%. The inset is a plot of vector averaged wind direction (WD) with the bubble area weighed to wind speed plotted for hours of the day in local time.
formation by condensation of semivolatile vapors emitted by traffic during preceding hours. The depression of the atmospheric mixing layer during later hours of the day in cooler months can further enhance the production of these elevated particle concentrations, and its effect is most pro-nounced in peak winter months (December–February), when night time concentrations can reach ca. 30 000 cm3. Biswas et al. (2007) have previously reported a similar data pattern. The observations at USC suggest that PNC can vary signif-icantly at a site across seasons (morning commute peak in winters ∼40 000 cm3 and in summers ∼15 000 cm3), even though they may be associated with consistent local emis-sion sources, all due to different meteorological conditions. Thus, when considering exposure to UFP, especially using a number-based metric, meteorological conditions and sec-ondary sources can be of as much consequence as direct emissions from local sources.
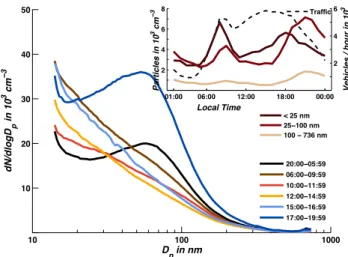
Figure 2b and c compare the average particle size distribu-tion of during different time periods of the day at USC during September and December of 2009. As discussed above, the photochemical activity-related peak (observed during the af-ternoon period 12:00–14:00 h, by when previously formed particles grow to a size range that is measurable by SMPS) is very robust in September and weakens progressively through the fall and into December. Insets in Fig. 2b and c fur-ther elucidates this point by comparing the particle size dis-tribution during 10:00–14:00 h between September and De-cember, i.e., the warmer and cooler months of our sampling campaign. In September, a simultaneous rise in total par-ticle numbers and the sub-25 nm parpar-ticles can be seen and is attributed to photochemical formation. The possibility of these particles being associated with fresh (traffic) emissions is unlikely because analysis of traffic trends of the
neighbor-10 100 1000
10 20 30 40 50
Dp in nm
dN/dlogD
p
in 10
3 cm
− 3 2 4 6 8 Local Time
Vehicles / hour in 10
3
01:00 06:00 12:00 18:00 00:00 2 4 6 8 10 12 14
Particles in 10
3 cm
−
3
20:00−05:59 06:00−09:59 10:00−11:59 12:00−14:59 15:00−16:59 17:00−19:59 < 25 nm 25−100 nm 100 − 736 nm
Traffic
Fig. 2b.Average Size Distribution of Particles during six time peri-ods (local time) of the day at USC during September 2009.
10 100 1000
10 20 30 40 50 D
p in nm
dN/dlogD
p
in 10
3 cm
− 3 2 4 6 8 Local Time
Vehicles / hour in 10
3
Traffic
01:00 06:00 12:00 18:00 00:00 2 4 6 8 10 12 14
Particles in 10
3 cm
−
3
20:00−05:59 06:00−09:59 10:00−11:59 12:00−14:59 15:00−16:59 17:00−19:59 < 25 nm 25−100 nm 100 − 736 nm
Fig. 2c.Average Size Distribution of Particles during six time peri-ods (local time) of the day at USC during December 2009.
Table 2.Prevailing Wind Direction and Speed at sampling sites.
Dominant Wind Direction and Wind Speed
Month Nov Dec Jan Feb Mar Apr May Jun Jul Aug Sep Oct Nov
AGO 2008 2009
WD (deg) SW E E E W W W W W W W W E
WS (m/s) 0.70 0.89 1.21 0.93 1.21 1.31 1.17 1.23 1.13 1.04 0.96 1.37 0.93
SD (m/s) 0.70 0.81 1.35 0.82 1.22 1.21 1.10 1.16 1.21 1.13 1.23 1.55 1.04
DIA 2009
Month Feb Mar Apr May Jun Jul Aug Sep Oct Nov
WD (deg) S S SW S W W W S W S
WS (m/s) 0.62 0.47 0.53 0.50 0.41 0.40 0.38 0.31 0.39 0.35
SD (m/s) 0.81 0.48 0.48 0.40 0.30 0.33 0.36 0.32 0.56 0.55
RUB 2008 2009
Month Nov Dec Jan Feb Mar Apr May Jun Jul Aug Sep Oct Nov
WD (deg) NW N N N W W W W W W W W NW
WS (m/s) 0.53 0.96 2.38 0.78 0.97 0.84 0.84 0.71 0.70 0.62 0.62 1.00 1.28
SD (m/s) 0.75 1.49 2.66 0.98 1.20 0.63 0.56 0.57 0.60 0.54 0.67 1.48 0.37
UPL 2008 2009
Month Nov Dec Jan Feb Mar Apr May Jun Jul Aug Sep Oct Nov
WD (deg) W N N W SW SW W W W W W W W
WS (m/s) 0.39 0.48 0.52 0.56 0.86 1.14 1.15 1.19 1.11 1.01 0.90 0.80 0.65
SD (m/s) 0.37 0.46 0.47 0.53 0.69 0.94 0.92 0.89 1.05 0.93 0.87 0.70 0.51
VBR 2008 2009
Month Nov Dec Jan Feb Mar Apr May Jun Jul Aug Sep Oct Nov
WD (deg) W W N W SW W SW W W SW W W W
WS (m/s) 0.45 0.64 2.04 0.67 0.92 1.01 1.03 1.09 1.01 0.92 0.88 1.02 0.43
SD (m/s) 0.81 1.18 2.27 0.92 1.08 1.03 0.89 0.92 1.00 0.90 1.02 1.19 0.56
USC 2009
Month Jan Feb Mar Apr May Jun Jul Aug Sep Oct Nov
WD (deg) NE NE W W W W W W W NE NE
WS (m/s) 2.23 2.41 2.44 2.71 2.50 2.53 2.66 2.74 2.45 2.58 2.34
SD (m/s) 0.86 0.97 1.04 1.16 0.96 1.04 1.05 1.12 1.02 1.05 0.77
May, August and September). A bi-modal diurnal distri-bution is observed at this site, with a morning time peak, similar to USC, corresponding to morning commute during 06:00–10:00 h in winter months that is not as robust during summer. This winter peak is a compounded effect of ve-hicular emissions and lower mixing height in winter morn-ings. (This is clearly evident in the inset in Fig. 3c. A gradual increase in concentration is observed as the winter progresses. The formation of strong surface-based temper-ature inversions that can lead to almost no vertical mixing (during winters) of the transported PM load, coupled with
Table 3.Temperature (◦C) and Relative Humidity (%) at sites during sampling period.
Sites USC UPL AGO
Months RH Temp RH Temp RH Temp
Dec ’08 67±21 10.7±5.4 64±22 11.3±5.0
Jan ’09 73±16 14.0±3.4 52±25 14.2±5.9 44±23 15.4±5.0
Feb ’09 83±08 12.2±1.8 64±24 11.9±5.6 63±23 12.1±5.3
Mar ’09 72±19 13.6±3.1 67±18 13.3±5.3 58±21 14.0±5.2
Apr ’09 68±14 14.6±4.0 59±22 16.0±6.6 55±21 16.0±6.3
May ’09 78±08 17.5±1.7 66±17 19.4±5.4 65±17 19.9±5.3
Jun ’09 76±07 17.7±1.1 67±16 20.2±4.8 66±16 19.7±5.1
Jul ’09 69±11 22.7±3.4 60±19 24.2±5.5 52±18 25.9±6.0
Aug ’09 64±18 22.4±4.4 61±20 23.4±5.7 53±22 24.9±6.4
Sep ’09 66±17 23.1±4.2 56±22 24.3±6.4 47±22 26.0±6.6
Oct ’09 60±21 19.1±3.9 57±23 18.2±5.9 52±23 18.8±5.8
Nov ’09 52±22 16.7±4.3 54±23 15.7±5.9 47±24 16.6±5.5
Dec ’09 58±20 13.8±3.8 72±19 12.0±3.6 67±18 12.6±2.9
Sites DIA VBR RUB
Months RH Temp RH Temp RH Temp
Dec ’08 62±26 12.7±5.8 62±23 12.1±5.6
Jan ’09 44±29 16.3±6.7 42±26 16.2±6.1
Feb ’09 67±22 67.3±21.7 68±25 12.1±5.7 64±24 12.8±5.7
Mar ’09 64±19 63.5±19.4 64±22 14.0±5.4 58±21 15.1±5.7
Apr ’09 58±21 58.2±21.0 59±21 16.0±6.3 54±21 17.2±6.6
May ’09 69±15 68.7±14.8 68±17 19.9±5.1 62±18 21.4±5.8
Jun ’09 69±14 69.0±13.8 66±17 21.0±5.1 65±16 20.8±5.2
Jul’ 09 58±18 58.4±18.4 62±19 24.7±6.1 52±19 28.0±6.4
Aug ’09 55±22 55.2±21.7 59±22 24.2±6.4 52±21 26.2±6.9
Sep ’09 53±22 52.8±21.7 57±23 24.8±6.8 52±21 26.2±7.0
Oct ’09 56±24 55.8±23.9 57±25 18.5±6.0 52±24 19.7±6.4
Nov ’09 51±25 51.3±24.8 55±27 16.2±6.4 49±25 17.1±6.3
Dec ’09 68±16 68.4±16.4 67±18 13.6±3.8
maximum. Other inland sites exhibit a similar pattern, with nighttime maxima being comparable to morning maxima and the highest PNC being observed during winter months. This concentration pattern may lead to a longer period of exposure to higher PNC in inland areas than in areas with greater local emissions nearer the coast.
Figure 3b and c compare the PNC in various size ranges at UPL. Between the warm September and cool December months there is a marked change in the diurnal pattern for different size ranges. The afternoon peak in concentrations associated with photochemical activity, as observed at USC and later at AGO, is not as prominent at UPL. Even though the PNSD during 10:00–14:00 h indicates the presence of particles of sizes that could be attributed to photochemical activity, it is not accompanied by a rise in total PNC, as is observed at USC and AGO. A possible explanation is that the contribution of photochemical activity to the total PNC is obscured (and thus not as distinguishable) by the contri-bution of the advected aerosols from the upwind urban
01:00 06:00 12:00 18:00 00:00 5
10 15 20 25 30
Local Time
Number of Particles in 10
3 cm
−
3
01:00 06:00 12:00 18:00 00:00 0
180 360
Wind Direction
Jan May Sep
Nov Jan Feb May Aug Sep
Fig. 3a.Hourly average particle number concentration at UPL for hours of the day in local time. The relative standard error for the hourly averages reported above was less than 2%. The inset is a plot of vector averaged wind direction (WD) with the bubble area weighed to wind speed plotted for hours of the day in local time.
within this size range remain stable) could be due to the ar-rival of the polluted air mass from Los Angeles. Similar ob-servations have been made by Kim et al. (2002) and Fine et al. (2004b). However, during winters (Fig. 3c) the distribu-tion is uni-modal and the bi-modal distribudistribu-tion is only ob-served during evening/night with distinctly higher mode di-ameter during winter. The size range of 14–25 nm, associated with fresh emissions, shows a sharp increase during morning as well as in evening, as evident in the inset (total PNC in-creases and the mode particle diameter dein-creases, shifting the distribution towards freshly emitted PM). This is due to the combined effects of local traffic, coupled with the decreas-ing temperature (increasdecreas-ing the partitiondecreas-ing of semivolatile organic emissions towards the particulate phase) and mixing height (which reduces dispersion), all of which lead to a more pronounced effect of local emissions than that observed dur-ing summers. These comparisons suggest that there could be significant distinction in the size distribution profiles ob-served at sites due to seasonal variation.
Figure 4a shows data for AGO, one of the eastern most re-gional receptor sites of the study. Diurnal averages are shown for late fall (November), winter (January), spring (March) and summer (May, July and September). The morning peak in the plot can be explained by the morning commute (as this site is near a freeway). However, this morning peak sub-sides as the year progresses into warmer months when there is greater dispersion of fresh traffic emissions. Similar to UPL, during colder months, there is an evening and early nighttime rise in concentrations, leading to PNCs compara-ble to that in mornings. This peak diminishes in the sum-mer and returns in September. Figure 4b and c contrasts par-ticle size distributions during different time periods of the day. During September it was observed that concentrations
10 100 1000
10 20 30 40 50
Dp in nm
dN/dlogD
p
in 10
3 cm
−
3
2 4 6
Local Time
Vehicles / hour in 10
3
01:00 06:00 12:00 18:00 00:00 2
4 6 8
Particles in 10
3 cm
−
3 Traffic
20:00−05:59 06:00−09:59 10:00−11:59 12:00−14:59 15:00−16:59 17:00−19:59 < 25 nm 25−100 nm 100 − 736 nm
Fig. 3b.Average Size Distribution of Particles during six time peri-ods (local time) of the day at UPL during September 2009.
10 100 1000
10 20 30 40 50
D p in nm
dN/dlogD
p
in 10
3 cm
−
3
2 4 6
Local Time
Vehicles / hour in 10
3
01:00 06:00 12:00 18:00 00:00 2
4 6 8
Particles in 10
3 cm
−
3 Traffic
20:00−05:59 06:00−09:59 10:00−11:59 12:00−14:59 15:00−16:59 17:00−19:59 < 25 nm 25−100 nm 100 − 736 nm
Fig. 3c.Average Size Distribution of Particles during six time peri-ods (local time) of the day at UPL during December 2009.
01:00 06:00 12:00 18:00 00:00 5
10 15 20 25 30
Local Time
Number of Particles in 10
3 cm
−
3
01:00 06:00 12:00 18:00 00:00
0 180 360
Wind Direction
Nov Jan Mar May Jul Sep
Jan May Sep
Fig. 4a.Hourly average particle number concentration at AGO for hours of the day in local time. The relative standard error for the hourly averages reported above was less than 3%. The inset is a plot of vector averaged wind direction (WD) with the bubble area weighed to wind speed plotted for hours of the day in local time.
reasons similar to UPL, the effect of local emissions is more pronounced in winter mornings at AGO, as evident in the morning peaks in sub 25 nm concentrations and the effect of dilution as the day progresses can be seen in the inset in Fig. 3c.
The diurnal pattern in particle concentrations across these sites, (i.e., USC, AGO and UPL) is dominated by a bi-modal distribution, except for summers at USC. The overall particle concentrations decrease due to dispersion as the air parcels move inland (eastwards). The increase in nighttime concen-trations (at hours when there are limited fresh emissions) at AGO (easternmost receptor) are lower than at UPL (northern receptor). PNCs at the RUB and VBR sites, which are fur-ther inland than UPL, are also lower than at UPL, but higher than at AGO, which is further east of these sites. A similar pattern is observed in the morning peaks corresponding to commute hours, because the traffic volume decreases as one moves farther inland from Downtown Los Angeles.
4.3 Spatial distribution of particle number concentrations
Figure 5a and b compare PNC at all sites for two months (during the warmer and cooler periods of the year) to contrast spatial variation in the concentrations across the basin. A representative month from each season was chosen and data have been plotted as the diurnal averages over the span of the month.
Figure 5a shows a winter month data across sites. The all-hour average December 2008 temperatures across the inland sites ranged from 10.7 to 12.7◦C while the relative humid-ity ranged from 59 to 67%. The wind data in Table 2 shows the predominant wind direction based on hourly vector
av-10 100 1000
2 4 6 8 10
D
p in nm
dN/dlogD
p
in 10
3 cm
−
3
2 4
Local Time
Vehicles / hour in 10
3
01:00 06:00 12:00 18:00 00:00
1 3 5
Particles in 10
3 cm
−
3
< 25 nm
25−100 nm
100 − 736 nm
20:00−05:59
06:00−09:59
10:00−11:59
12:00−14:59
15:00−16:59
17:00−19:59
Traffic
Fig. 4b.Average SizeDistribution of Particles during six time peri-ods (local time) of the day at AGO during September 2009.
10 100 1000
2 4 6 8 10
D
p in nm
dN/dlogD
p
in 10
3 cm
−
3
2 4
Local Time
Vehicles / hour in 10
3
01:00 06:00 12:00 18:00 00:00
1 3 5
Particles in 10
3 cm
−
3
20:00−05:59
06:00−09:59
10:00−11:59
12:00−14:59
15:00−16:59
17:00−19:59
Traffic
< 25 nm
25−100 nm
100 − 736 nm
Fig. 4c.Average Size Distribution of Particles during six time peri-ods (local time) of the day at AGO during December 2009.
01:00 06:00 12:00 18:00 00:00 0
10 20 30 40 50
Local Time
Number of Particles in 10
3 cm
−
3
USC UPL AGO RUB VBR Inland Average
0 0.2 0.4
COD
COD:All Sites COD:Inland Sites
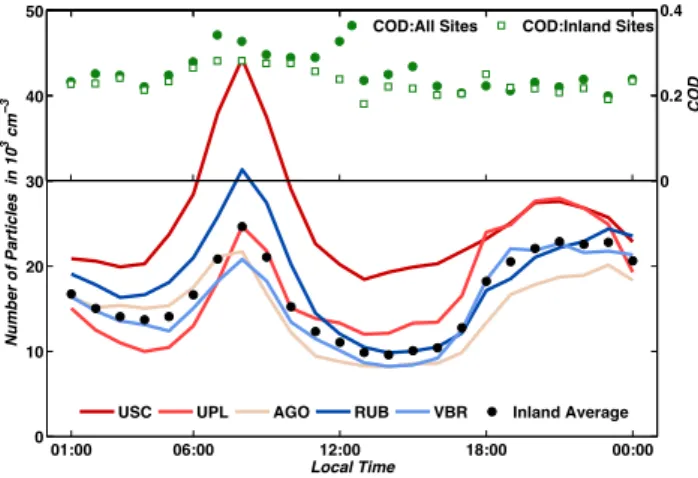
Fig. 5a. PNC and Coefficients of Divergence across sites for De-cember 2008.
stable stratification predominates the area. UPL (which is closer to USC) and AGO (which is farther east) show higher and lower night time concentrations, respectively, compared to RUB and VBR. The degree of variability based on PNC was examined using the Coefficient of Divergence, and the median value of COD is plotted for all site pairs. The highest CODs, or the maximum spatial variability, are observed dur-ing the hours of morndur-ing commute. The overall COD range was 0.17–0.28, indicating that PNC are only moderately het-erogeneous.
Figure 5b shows the hourly averages at all sites during Au-gust 2009. USC not only has the highest PNC, but also a very sharp midday peak (related to photochemical particle formation), which is comparable to morning traffic-related peak, as discussed earlier. Nighttime PNC become compa-rable to those at inland sites. The increased PNC pattern during morning commute is observed across all sites even though the numeric values of PNC differ significantly. The morning commute peaks however are not as pronounced as those in winter (December, Fig. 5a) as the primary emis-sions are quickly dispersed in summer and the higher am-bient temperatures may be shifting the partitioning of semi-volatile organics emitted by primary sources to the gas phase (Miracolo et al., 2010). Particle number concentrations at all sites were generally lower in summer than in spring or win-ter. Post midday, there is a steady rise in PNC concentrations in all receptor sites, which is due to the combined effects of photochemical activity along with the contribution of ad-vected PM from western Los Angeles. The overall similarity in PNC data in all sites during overnight hours illustrates a well-dispersed regional-scale aerosol during summer nights. The lowest CODs were observed during summer, with the range for August being 0.13–0.23. These data corroborate the effect of dispersion and advection on regional scales as homogenizing factors leading to low variability at the inter-community level.
01:00 06:00 12:00 18:00 00:00
0 10 15 20
5 25
Local Time
Number of Particles in 10
3 cm
−
3
0 0.2 0.4
COD
USC UPL AGO RUB DIA Inland Average
COD:All Sites COD:Inland Sites
Fig. 5b.PNC and Coefficients of Divergence across sites for August 2009.
The hourly concentrations observed during this campaign varied across seasons, though the diurnal variations were more consistent. The maximum diurnal change in PNCs across seasons was observed at USC, along with the high-est average concentrations. This was expected, as USC is located in the immediate vicinity of a freeway (about 120 m downwind) and in the source region of the LAB. The higher concentrations observed in the fall/winter months were con-sistent with the work of Singh et al. (2006). In comparison to our earlier study (Moore et al., 2009), which reported con-centrations comparable to USC at several sites in the Wilm-ington and West Long Beach area of Los Angeles, the re-ceptor sites had lower concentrations due to lower impact of heavy traffic emissions in the immediate vicinity. During site selection, preference was given to sites not in the imme-diate vicinity of a source, to differentiate between local and regional contributions to the measured PNC in these sites. Figure 6 compares the concentrations observed during this study with earlier observations made by Singh et al. (2006), who reported PNC data 6–7 years earlier, using identical in-strumentation at similar sites. The sites AGO and UPL are referred to as Riverside and Upland by Singh et al. (2006). The Mira Loma site is about 8 km west of RUB. In general, the observed concentrations in the present study are some-what lower, which could be interpreted (with some caution) as an encouraging outcome of the implementation of effec-tive emission control technologies and the replacement of older heavy and light duty vehicles by newer vehicles in the LAB. The seasonal patterns identified in this study are con-sistent with the earlier observations by Singh et al. (2006).
Jan Feb Mar Apr May Jun Jul Aug Sep Oct Noc Dec 10
20 30 40
Number Concentration in 10
3 cm
−
3
Mira Loma 2002/3 RUB 2008/9 Upland 2002/3 UPL 2008/9 Riverside 2002/3 AGO 2008/9
Fig. 6.Comparison of PNC at select sites measured during 2008/09 with Singh et al. (2006) measured during 2002/03.
higher in winter, but still below 0.3, indicating only moderate heterogeneity. The deviation in CODs for all site pairs was highest for the hours in which primary local sources are pre-dominant, implying that one or more sites with a heavy lo-cal influence (which in most cases would be traffic) is in-creasing the COD. This was further ascertained by inspect-ing individual site pair values. Durinspect-ing both summer and win-ter, homogeneity is observed in late night and early morning concentrations, indicating the presence of a regional aerosol. In comparison to our previous study (Moore et al., 2009; Krudysz et al., 2009) that reports median COD values of about 0.3–0.5 in source regions of the LAB (the range be-tween first and third quartiles was on the order of 0.2 units), the values reported in this study are lower. This implies that in LAB, theinter-communityvariability in PNC is lower than theintra-communityvariability of areas like the LA harbor, impacted by a multitude of traffic, ship and industrial emis-sions at a much shorter spatial scale. The relative homogene-ity at the inter-communhomogene-ity level among receptor sites in LAB can be attributed to the effect of regional transport and me-teorology that appear to override the contributions of local primary emissions. The effects of local traffic sources were also observed at the sites in this study, but were restricted to morning and (only during winter) evening commute hours.
The spatial complexity of the PNC was further resolved with the size distribution data. Synergistic effects of multi-ple factors can lead to similar particle number concentrations at two sites; however, the size distribution profiles may be distinctly different at the two locations due to particle source composition. Wongphatarakul et al. (1998) showed that only moderately heterogeneous COD values can be observed for chemical composition of particles even when the sources are different. Since particle size distribution is as important for exposure classification, the spatial variability was assessed for different PM sizes. Overall CODs varied from 0.40– 0.67, and exhibited a roughly inverse relationship with parti-cle size. This can in part be accounted for by the difference
01:00 06:00 12:00 18:00 00:00
0 0.2 0.4 0.6
Local Time
Coefficient of Divergence
Fig. 7a. Coefficients of divergence during the summer months of May–August, 2009. The red line in the middle is the median and the box bounds the 25th and 75th percentiles of the data. Whiskers indicate the range of data and outliers are identified with red + sign.
01:00 06:00 12:00 18:00 00:00
0 0.2 0.4 0.6
Local Time
Coefficient of Divergence
Fig. 7b. Coefficients of divergence during the winter months of December 2008–February 2009. The red line in the middle is the median and the box bounds the 25th and 75th percentiles of the data. Whiskers indicate the range of data and outliers are identified with red + sign.
5 Conclusions
Moderate inter-community variability in total particle num-ber concentrations was observed across the sites of the east-ern Los Angeles Basin. The extreme Coefficient of Diver-gence (COD) values were often driven by a specific site pair, (site pair varied by hour and season), but the range of up-per and lower quartile of COD vales was mostly within 0.1 units, implying that Particle Number Concentration (PNC) in these sites were homogeneous-to-moderately heteroge-neous. Although, there were differences in the spatial vari-ability through different seasons, the temporal patterns were consistent, and exhibited least variability in hours when lo-cal sources were not dominant. Comparable PNC can be observed in sites separated by several tens of kilometers overnight during stable stratification conditions. The vari-ability in size distributions (reflection of the source compo-sition) was higher than that of total particle number concen-trations. Overall the spatial variability in PNC was lower than the values reported by Moore et al. (2009) for intra-community variability in urban “source” areas of the LAB. The spatial variability based on particle size distributions support the notion of relative homogeneity in receptor ar-eas in LAB, where concentrations are dominated by aged aerosols, advected eastwards from the source regions of ur-ban Los Angeles, since the lowest variability was observed for particles in the size range of 40–100 nm, associated with long-range transport, compared to sub-30 nm particles asso-ciated with fresh emissions or new particle formation events. The largest differences in PNC were observed between re-ceptor sites and the source site at USC, while PNC were rel-atively homogeneous among the receptor sites. Further, the data suggest that meteorological conditions can contribute to spatial homogeneity, when phenomena that are regional in nature (i.e., summertime photochemical processes, long range transport, and higher degree of mixing) are active.
Even though our results suggest that PNC are moderately heterogeneous in the polluted receptor areas of the LAB, con-cerns related to population exposure assessment based on monitoring from a central station are still valid, especially in relation to urban areas impacted by a multitude of local and highly variable sources. Moreover, despite the moder-ate heterogeneity in total PNC at the inter-community level of receptor sites in LAB, particle size distributions may be significantly variable, resulting in differences in the overall inhaled dose of PM mass. Efforts should be made to charac-terize the seasonal nature of the variability in both size distri-butions and number concentrations, because meteorological factors can influence both even when PM sources are similar.
Acknowledgements. We would like to acknowledge Ali Attar,
Shruthi Balasubramanian, Niloofar Hajibeiklou and Tina
Dar-jazanie for their assistance in the field and data work. This
study was funded by Air Resources Board contract #05-317. We acknowledge the help of the South Coast Air Quality Management District (P. Fine, R. Bermudez, K. Brown) and UC Riverside (R. Atkinson).
Edited by: W. Birmili
References
Biswas, S., Ntziachristos, L., Moore, K. F., and Sioutas, C.: Parti-cle volatility in the vicinity of a freeway with heavy-duty diesel traffic, Atmos. Environ., 41, 3479–3493, 2007.
Blumenthal, D. L., White, W. H., and Smith, T. B.: Anatomy of a Los Angeles smog episode: pollutant transport in the daytime sea breeze regime, Atmos. Environ., 12, 893–907, 1978. Costabile, F., Birmili, W., Klose, S., Tuch, T., Wehner, B.,
Wieden-sohler, A., Franck, U., K¨onig, K., and Sonntag, A.: Spatio-temporal variability and principal components of the particle number size distribution in an urban atmosphere, Atmos. Chem. Phys., 9, 3163–3195, doi:10.5194/acp-9-3163-2009, 2009. Cyrys, J., Pitz, M., Heinrich, J., Wichmann, H., and Peters, A.:
Spatial and temporal variation of particle number concentration in Augsburg, Germany, Sci. Total Environ., 401, 168–175, 2008. Delfino, R. J., Sioutas, C., and Malik, S.: Potential role of ultrafine particles in associations between airborne particle mass and car-diovascular health, Environ. Health Persp., 113, 934–946, 2005. Delfino, R. J., Staimer, N., Tjoa, T., Gillen, D. L., Polidori, A., Arhami, M., Kleinman, M. T., Vaziri, N. D., Longhurst, J., and Sioutas, C.: Air pollution exposures and circulating biomarkers of effect in a susceptible population: clues to potential causal component mixtures and mechanisms, Environ. Health Persp., 117, 1232–1238, 2009.
Donaldson, K. and MacNee, W.: The Mechanism of Lung Injury
Caused by PM10, in: Issues in Environmental Science and
Tech-nology, The Royal Society of Chemistry, London, 21–32, 1998. Englert, N.: Fine particles and human health – a review of
epidemi-ological studies, Toxicol. Lett., 149, 235–242, 2004.
Fine, P. M., Chakrabarti, B., Krudysz, M., Schauer, J., and Sioutas, C.: Diurnal Variations of Individual Organic Compound Con-stituents of Ultrafine and Accumulation Mode Particulate Matter in the Los Angeles Basin, Environ. Sci. Technol., 38, 1296–1304, 2004a.
Fine, P. M., Shen, S., and Sioutas, C.: Inferring the Sources of Fine and Ultrafine Particulate Matter at Downwind Receptor Sites in the Los Angeles Basin Using Multiple Continuous Measure-ments, Aerosol Sci. Tech., 38, 182–195, 2004b.
Gong, K. W., Zhao, W., Li, N., Barajas, B., Kleinman, M. T., Sioutas, C., Horvath, S., Lusis, A. J., Nel, A. E., and Araujo, J. A.: Air-pollutant chemicals and oxidized lipids exhibit genome-wide synergistic effects on endothelial cells, Genome Biol., 8, R149, doi:10.1186/gb-2007-8-7-4149, 2007.
Harrison, R. M. and Jones, A. M.: Multisite study of particle num-ber concentrations in urban air, Environ. Sci. Technol., 39, 6063– 6070, 2005.
Hricko, A.: Global trade comes home – community impacts on goods movement, Environ. Health Persp., 116, A78–A81, 2008. Hu, S., Fruin, S., Kozawa, K., Mara, S., Paulson, S. E., and Winer, A. M.: A wide area of air pollutant impact downwind of a free-way during pre-sunrise hours, Atmos. Environ., 43, 2541–2549, 2009.
Jerrett, M., Burnett, R. T., Ma, R., Pope, C. A., Krewski, D., New-bold, K. B., Thurston, G., Shi, Y., Finkelstein, N., Calle, E. E., and Thun, M. J.: Spatial Analysis of Air Pollution and Mortality in Los Angeles, Epidemiology, 16, 727–736, 2005.
Kim, S., Shen, S., and Sioutas, C.: Size distribution and diurnal and seasonal trends of ultrafine particles in source and receptor sites of the Los Angeles basin, J. Air Waste Manage., 52, 297–307, 2002.
Kleeman, M. J., Hughes, L. S., Allen, J. O., and Cass, G. R.: Source contributions to the size and composition distribution of atmo-spheric particles: Southern California in September 1996, Envi-ron. Sci. Technol., 33, 4331–4341, 1999.
Krudysz, M., Moore, K., Geller, M., Sioutas, C., and Froines, J.: Intra-community spatial variability of particulate matter size dis-tributions in Southern California/Los Angeles, Atmos. Chem. Phys., 9, 1061–1075, doi:10.5194/acp-9-1061-2009, 2009. Kulmala, M., Vehkamaki, H., Petaja, T., Dal Maso, M., Lauri, A.,
Kerminen, V. M., Birmili, W., and McMurry, P. H.: Formation and growth rates of ultrafine atmospheric particles: a review of observations, J. Air Waste Manage., 35, 143–176, 2004. Li, N., Sioutas, C., Froines, J. R., Cho, A., Misra, C., and Nel,
A.: Ultrafine particulate pollutants induce oxidative stress and mitochondrial damage, Environ. Health Persp., 111, 455–460, 2003.
Lianou, M., Chalbot, M. C., Kotronarou, A., Kavouras, I. G., Karakatsani, A., Katsouyanni, K., Puustinnen, A., Hameri, K., Vallius, M., Pekkanen, J., Medings, C., Harrison, R. M., Thomas, S., Ayres, J. G., ten Brink, H., Kos, G., Meliefste, K., de Har-tog, J. J., and Hoek, G.: Dependence of home outdoor partic-ulate mass and number concentrations on residential and traffic features in urban areas, J. Air Waste Manage., 57, 1507–1517, 2007.
Lu, R. and Turco, R. P.: Air pollutant transport in a coastal environ-ment. Part I: Two-Dimensional Simulations of Sea-Breeze and Mountain Effects, J. Atmos. Sci., 51, 2285–2308, 1994. Lu, R. and Turco, R. P.: Air pollutant transport in a coastal
envi-ronment – II. Three-dimensional simulations over Los Angeles basin, Atmos. Environ., 29, 1499–1518, 1995.
McElroy J. L. and Smith T. B.: Creation and fate of ozone layers aloft in Southern California, Atmos. Environ., 27A, 1917–1929, 1993.
McElroy J. B. and Smith T. B.: Vertical pollutant distributions and boundary layer structure observed by airborne lidar near the com-plex Southern California coastline, Atmos. Environ., 20, 1555– 1566, 1986.
Miracolo, M. A., Presto, A. A., Lambe, A. T., Hennigan, C. J., Don-ahue, N. M., Kroll, J. H., Worsnop, D. R., and Robinson, A. L.: Photo-Oxidation of Low-Volatility Organics Found in Motor Ve-hicle Emissions: Production and Chemical Evolution of Organic Aerosol Mass, Environ. Sci. Technol., 44, 1638–1643, 2010. Monn, C.: Exposure assessment of air pollutants: A review on
spa-tial heterogeneity and indoor/outdoor/personal exposure to sus-pended matter, nitrogen dioxide and ozone, Atmos. Environ., 35,
1–32, 2001.
Moore, K. F., Ning, Z., Ntziachristos, L., and Sioutas, C.: Daily variation in summer urban ultrafine particle properties – physical characterization and volatility, Atmos. Environ., 41, 8633–8646, 2007.
Moore, K. F., Krudysz, M., Pakbin, P., Hudda, N., and Sioutas, C.: Intra-Community Variability in Total Particle Number Concen-trations in the San Pedro Harbor Area (Los Angeles, California), Aerosol Sci. Tech., 43, 587–603, 2009.
Motallebi, N., Tran, H., Croes, B. E., and Larsen, L. C.: Day-of-week patterns of particulate matter and its chemical components at select sites in California, J. Air Waste Manage., 53, 876–888, 2003.
Morawska, L., Thomas, S., Bofinger, N., Wainwright, D., and Neale, D.: Comprehensive Characterization of Aerosols in a Subtropical Urban Atmosphere: Particle Size Distribution and Correlation with Gaseous Pollutants, Atmos. Environ., 32, 2467– 2478, 1998.
Nel, A.: Air pollution-related illness: effects of particles, Science, 308, 804–806, 2005.
Ning, Z., Geller, M., Moore, K. F., Sheesley, R., Schauer, J. J., and Sioutas, C.: Daily variation in summer urban ultrafine aerosols and inference of their sources, Environ. Sci. Technol., 41, 6000– 6006, 2007.
Oberd¨orster, G., Gelein, R. M., Ferin, J., and Weiss, B.: Association of Particulate Air Pollution and Acute Mortality: Involvement of Ultrafine Particles, Inhal. Toxicol., 7, 111–124, 1995.
Pandis, S. N., Harley, R. A., Cass, G. R., and Seinfeld, J. H.: Sec-ondary Organic Aerosol Formation and Transport, Atmos. Envi-ron. A-Gen., 26, 2269–2282, 1992.
Penttinen, P., Timonen, K. L., Tiittanen, P., Mirme, A., Ruuskanen, J., and Pekkanen, J.: Ultrafine particles in urban air and respira-tory health among adult asthmatics, Eur. Respir. J., 17, 428–435, 2001.
Pekkanen, J., Timonen, K. L., Ruuskanen, J., Reponen, A., and Mirme, A.: Effects of ultrafine and fine particles in urban air on peak expiratory flow among children with asthmatic symptoms, Environ. Res., 74, 24–33, 1997.
Peters, A., Wichmann, H. E., Tuch, T., Heinrich, J., and Heyder, J.: Respiratory Effects are Associated with the Number of Ultrafine Particles, Am. J. Respir. Crit. Care Med., 155, 1376–1383, 1997. Pope, C. A. and Dockery, D. W.: Health effects of fine particulate air pollution: lines that connect, J. Air Waste Manage., 56, 709– 742, 2006.
Phuleria, H. C., Geller, M. D., Fine, P. M., and Sioutas, C.: Size-resolved emissions of organic tracers from light and heavy-duty vehicles measured in a California roadway tunnel, Environ. Sci. Technol., 40, 4109–4118, 2006.
Puustinen, A., Hameri, K., Pekkanen, J., Kulmala, M., de Hartog, .J, Meliefste, K., ten Brink, H., Kos, G., Katsouyanni, K., Karakat-sani, A., Kotronarou, A., Kavouras, I., Meddings, C., Thomas, S., Harrison, R. M., Ayres, J. G., van der Zee, S., and Hoek, G.: Spatial variation of particle number and mass over four European cities, Atmos. Environ., 41, 6622–6636, 2007.
Pirjola, L.: Nucleation mode particles with a nonvolatile core in the exhaust of a heavy duty diesel vehicle, Environ. Sci. Technol., 41, 6384–6389, 2007.
Rodr´ıguez, S., Van Dingenen, R., Putaud, J.-P., Dell’Acqua, A., Pey, J., Querol, X., Alastuey, A., Chenery, S., Ho, K.-F., Harrison, R., Tardivo, R., Scarnato, B., and Gemelli, V.: A study on the relationship between mass concentrations, chem-istry and number size distribution of urban fine aerosols in Mi-lan, Barcelona and London, Atmos. Chem. Phys., 7, 2217–2232, doi:10.5194/acp-7-2217-2007, 2007.
Sardar, S. B., Fine, P. M., Yoon, H., and Sioutas, C.: Associa-tions between particle number and gaseous co-pollutant concen-trations in the Los Angeles basin, J. Air Waste Manage., 54, 992– 1005, 2004.
Schauer, J. J., Kleeman M. J., Cass, G. R., and Simoneit, B. R. T.: Measurements of emissions from air pollution sources. 3. C1-c29 organic compounds from fireplace combustion of wood, Environ. Sci. Technol., 35, 1716–1728, 2001.
Shi, J. P., Evans, D. E., Khan, A. A., and Harrison, R. M.: Sources and Concentrations of Nanoparticles (<10-nm Diameter) in the Urban Atmosphere, Atmos. Environ., 35, 1193–1202, 2001. Singh, M., Phuleria, H. C., Bowers, K., and Sioutas, C.: Seasonal
and spatial trends in particle number concentrations and size dis-tributions at the Children’s Health Study Sites in Southern Cali-fornia, J. Expo. Env. Epid., 16, 3–18, 2006.
Sioutas, C., Delfino, R. J., and Singh, M.: Exposure assessment for atmospheric ultrafine particles (UFPs) and implications in epi-demiological research, Environ. Health Persp., 113, 947–955, 2005.
Tuch, T. M., Herbarth, O., Franck, U., Peters, A., Wehner, B., Wiedensohler, A., and Heintzenberg, J.: Weak correlation of ultrafine aerosol particle concentrations<800 nm between two sites in one city, J. Expo. Env. Epid., 16, 486–490, 2006. Turner, J. R. and Allen, D. T.: Transport of atmospheric fine
par-ticulate matter: part 2 – findings from recent field programs on the intraurban variability in fine particulate matter, J. Air Waste Manage., 58, 196–215, 2008.
Ulrickson B. L. and Mass C. F.: Numerical investigation of
mesoscale circulations over the Los Angeles Basin. Part II: syn-optic influences and pollutant transport, Mon. Weather Rev., 118, 2162–2184, 1990.
Verma, V., Ning, Z., Cho, A. K., Schauer, J. J., Shafer, M. M., and Sioutas, C.: Redox activity of urban quasi-ultrafine parti-cles from primary and secondary sources, Atmos. Environ., 43, 6360–6368, 2009.
Wakimoto R. M. and McElroy J. L.: Lidar observations of elevated pollution layers over Los Angeles, J. Clim. Appl. Met., 25, 1583– 1598, 1986.
Wehner, B., Siebert, H., Stratmann, F., Tuch, T., Wiedensohler, A., Petaja, T., Dal Maso, M., and Kulmala, M.: Horizontal ho-mogeinity and vertical extent of new particle formation events, Tellus, 59B, 362–371, 2007.
Westerdahl, D., Fruin, S., Sax, T., Fine, P. M., and Sioutas, C.: Mobile platform measurements of ultrafine particles and associ-ated pollutant concentrations on freeways and residential streets in Los Angeles, Atmos. Environ., 39, 3597–3610, 2005. Wilson, J. G., Kingham, S., Pearce, J., and Sturman, A.: A review
of intraurban variations in particulate air pollution: implications for epidemiological research, Atmos. Environ., 39, 6444–6462, 2005.
Wongphatarakul, V., Friedlander, S. K., and Pinto, J. P.: A
compar-ative study of PM2.5ambient aerosol chemical databases,
Envi-ron. Sci. Technol., 32, 3926–3934, 1998.
Xia, T., Korge, P., Weiss, J. N., Li, N., Venkatesen, M. I., and Sioutas, C.: Quinones and aromatic chemical compounds in par-ticulate matter induce mitochondrial dysfunction: implications for ultrafine particle toxicity, Environ. Health Persp., 112, 1347– 1358, 2004.
Xia, T., Kovochich, M. J., Brant, J., Hotze, M., Sempf, J., Oberley, T., Yeh, J., Sioutas, C., Wiesner, M. R., and Nel, A. E.: Com-parisons of the abilities of ambient and commercial nanoparti-cles to induce cellular toxicity according to an oxidative stress paradigm, Nano Lett., 6, 1794–1807, 2006.
Zhang, K. M. and Wexler, A. S.: Modeling the Number Distribu-tions of Urban and Regional Aerosols: Theoretical FoundaDistribu-tions, Atmos. Environ., 36, 1863–1874, 2002.
Zhu, Y., Hinds, W. C., Kim, S., Shen, S., and Sioutas, C.: Study on ultrafine particle and other vehicular pollutants near a ma-jor highway with heavy duty diesel traffic, Atmos. Environ., 36, 4323–4335, 2002a.
Zhu, Y., Hinds, W. C., Kim, S., and Sioutas, C.: Concentrations and size distribution of ultrafine particles near a major highway, J. Air Waste Manage., 52, 1032–1042, 2002b.
Zhu, Y., Hinds, W. C., Shen, S., and Sioutas, C.: Seasonal trends of concentration and size distributions of ultrafine particles near major highways in Los Angeles, Aerosol Sci. Technol., 38, 5–13, 2005.