DOI: 10.1590/1808-057x201703160
Challenges with the public policy of measuring assets to set tarifs
in the electricity sector: should someone beneit and someone be
sacriiced?
Maria Elisabeth Moreira Carvalho Andrade
Universidade Federal de Uberlândia, Faculdade de Ciências Contábeis, Uberlândia, MG, Brazil
Eliseu Martins
Universidade de São Paulo, Faculdade de Economia, Administração e Contabilidade de Ribeirão Preto, Departamento de Contabilidade, Ribeirão Preto, SP, Brazil
Universidade de São Paulo, Faculdade de Economia, Administração e Contabilidade, Departamento de Contabilidade e Atuária, São Paulo, SP, Brazil
Received on 02.02.2016 – Desk acceptance on 02.16.2016 – 3rd version approved on 03.14.2017 – Ahead of print on 07.20.2017
ABSTRACT
his paper contributes by encouraging discussions about the public policy of setting tarifs for public services based on the value of the investment made by the providers of these services. he purpose of this study was, in an unprecedented way and by combining theories of equity valuation and inance, to identify the asset valuation method that can lead to a fair value and balance between an afordable price for the consumer and an adequate return on investment for the concessionaires. he value assigned to these assets afects the tarif in two ways: (i) via depreciation/amortization, which afects the cost of service; (ii) via the return on investment, which is the portion that corresponds to the investor’s proit. We analyzed the Brazilian electricity sector, in which the rates set by the Brazilian Electricity Regulatory Agency (ANEEL) currently use the new replacement value (NRV) approach. We carried out empirical tests using data available on the ANEEL website from the second cycle periodic tarif review and information obtained in inancial statements from 1995 onwards. he analysis included the NVR and restated historical cost (RHC) methods, the latter being updated by the extended consumer price index (IPCA). Ater the descriptive and statistical analyses, we used the test of means to verify the diferences between the variables in terms of NRV vs. RHC. he irst conclusion was the absence of a signiicant diference between the NRV and RHC methods; that is, on average, the replacement price showed no signiicant diference to what would be the pure and simple restatement of assets. But this was found to hide something relevant, the fact that this average is derived from two main groups: that of the consumers who are paying more for energy services than they should, which constitutes a visible beneit to investors and loss for these consumers, and that of the consumers who are paying less than they should, which beneits them but harms investors.
1. INTRODUCTION
his article contributes towards carrying out a critical relection on the diferent measurement methods and approaches used as the basis for remunerating assets in the Brazilian electricity sector. It also discusses the methodology currently used by the regulator and identiies the consequences of maintaining the adopted criterion or not, given that these components have a direct impact on electrical energy tarif setting. he study aims to reduce the existing gap in the accounting literature, not only with regards to measuring assets, but also to the accounting applied in regulating public services.
he irst privatizations of natural monopolies occurred in Brazil at the end of the 1990s. Setting tarifs plays a predominant role in this process. When there is a natural monopoly, consumers have no alternatives for substituting the service, and so state intervention is needed in order to ind, through regulation, a fair price for and quality of service provision.
hus, in December 1996, the Brazilian Electricity Regulatory Agency (ANEEL, s.n.) was created in order to regulate and oversee the sector. ANEEL became responsible for seeking a balance between the government, consumers, and investors, by means of public policies leading to the sustainability of the sector, with fair remuneration for the investor, afordable tarifs for the consumer, social inclusion, and quality of life. Ater the privatizations and over the past 20 years, the tarifs as well as the regulation as a whole have undergone improvements.
Up until the 1990s, the tarif was the same in the whole country, but in 1993 they became diferent depending on the region and concessionaire and were set by ANEEL. In 2014, the average tarif in the country (that is, the average of the tarifs charged) was R$276.93, and up until August 2015 the average tarif in the country was R$365.42, both without adding tax. An average variation of 32% can be perceived in relation to 2014, which is a relection of the increase in the cost of energy in 2015 and of government suppressed prices in previous years.
Tarifs are set by ANEEL in accordance with the regulatory model adopted (incentive regulation), in which the new replacement value (NRV) approach is currently used to measure the investments carried out by concessionaires, which have a direct impact on the tarif value for inal users. However, there are alternative approaches that can be used by the regulator, such as restated historical cost (RHC) and depreciated optimized replacement cost (DORC), among others. And there is also the case of those that are not exposed to the tarif deined by the regulator.
hus, considering the context presented, and based on theories of equity valuation and inance, this study will aim to answer the following investigation question:
which asset assessment criterion, when used to calculate electrical energy tarifs, can lead to a fair value in order to strike a balance between a reasonable price for the consumer and an adequate return on investment for the concessionaires?
A fair value is one that adequately rewards investments and results in an afordable tarif.
As will be shown in the conceptual review, each method will lead to diferent equity values, all of which need to aim to protect and maintain long term inancial (or monetary) capital, remuneration for owners who invest in search of adequate returns, and afordable tarifs. his argument serves as the basis for developing the irst hypothesis in the article: in a regulatory environment, measuring assets using the RHC method can contribute to achieving a fair value for the investor and the consumer.
According to Beesley and Littlechild (1989, p. 455), the regulator has to strike a balance between the interests of current and future consumers, and between consumers and the interests of current and future producers. hus, based on this argument, the second hypothesis raised is that NRV leads to current consumers bearing the costs of a good that will be acquired in the future and not the services already provided.
In light of the technical support presented in the next section, some relections are necessary: is it fair for a tarif to lead to company revenue values that exceed the capital invested and the return on this, with the aim of replacing the asset, which in the future may cost more? And can it be that with regards to efective replacement, the value is diferent from the one forecast, be it higher or lower? In other words, is it fair, when the value of a concession asset is raised, but it still has useful life, for its value to increase for depreciation purposes and for the tarifs to increase in order to recover capital that has not yet been spent? And when NRV is lower than RHC, is it fair for the investor to receive a lower return that does not recover the capital already invested? hese are the concerns that motivated the development of this study.
notes, which are calculated using the NRV method, are compared with RHC. he test of means is also applied to verify the diferences in the variables with regards to the measurement method (NRV vs. RHC) for the year in which the tarif reviews occurred, carrying out a joint analysis of the companies.
The results showed that there was no significant diference between the RHC and NRV methods for measuring assets in the electricity sector, considering Brazil as a whole; that is, the use of NRV was practically
equal to what would be obtained with RHC. However, given the spread, this average hides the following: a large number of consumers beneitted and a large number were adversely afected. Using NRV, therefore, is not the fairest method for society. he model based on RHC does not result in such an imbalance.
Sections 2 and 3 present the development of the topic and research design. his is followed by the presentation and discussion of the results, and lastly, the inal remarks.
2. CONCEPTUAL REVIEW
he measurement of assets in the electricity sector is a fundamental input for tarif setting and can afect investor returns in the future, as well as the prices paid by the consumer. Foster and Antmann (2004) note that evaluating assets is one of the most diicult and controversial aspects of regulation in the electrical energy distribution sector, as this does not involve a competitive market.
here is consensus that concessionaires of public services should receive a fair return on capital invested and that fair tarifs should also be levied on consumers and quality services provided. What is disputed is what is understood by “fair”; that is, what is the fair value that the investor must receive on investments carried out and that also results in an afordable tarif. he regulator has to seek the means to achieve fair value in a monopolistic market, in which the fair tarif value is not the fair value used by the accounting standards. For the consumer, a fair tarif is one for which the value is not abusive or disproportionate to investor costs and return, and without there being low quality services; that is, one resulting in socially desirable quality of service standards at a fair price.
In this study, the term “fair value” corresponds to the value that covers the payment of costs, recovering capital invested, and a return on the capital invested (investor), as well as accessible tarifs (consumer). A fair value is imposed by the market when there is free competition, as it depends on consumer willingness to pay a particular price. However, in sectors with a natural monopoly, the state needs to intervene in order to arbitrate the price, since users have no alternatives for substituting the product. In order to reach a fair value in regulated sectors, assumptions need to be altered, with the aim of satisfying the needs of investors and consumers.
hus, accounting is of the upmost importance in terms of providing information on the economic-inancial situation of companies. However, accounting in itself does not ensure fair value tarifs, but it can contribute
to a fairer measurement of the investments carried out and therefore to reaching a fair value for the taxpayer. As most of the inputs are commodities, such as aluminum and copper, among others, with high market volatility, both the investor and the consumer can be adversely afected (Pedell, 2006); that is, the risk is to both. However, when there is a loss, this is sustained by one of the parties involved, through an increase in tarifs or reduction in return on investment.
2.1 Regulatory Basis for Calculating Remuneration
The main component of the regulatory basis for calculating remuneration (RBR) is the value of assets related to providing electrical energy services, which are the biggest investments carried out by the companies. Among the diferent asset assessment criteria, ANEEL currently uses two methods: (i) the replacement cost (RC) method and (ii) RHC method. here are those who defend the use of book value, since this represents the value paid by the investor, thus being the fair value on which the “fair” return should be paid (Greenwald, 1980).
It is important to highlight that this study reviews the measurement of assets, which is part of investor return on capital, and does not discuss the other regulatory risks and opportunity cost that compose tarifs. However, as already mentioned, assets value is the main component of tarifs.
According to Foster and Antmann (2004), the diferent assessment methodologies available lead to quite diferent results when applied in regulated companies. here are many approaches for measuring assets in order to set tarifs. Based on the existing literature, this article discusses the methods based on asset costs: HC, RHC, DORC, and NRV.
same. Moreover, independent of the method adopted, the primary requisite is consistence in the valuation of assets over time, since this helps to reduce uncertainty and the perception of risk on the part of investors. Each approach is discussed below, laying out the advantages and disadvantages.
2.1.1 Historic cost.
he role of HC is to make calculations based on the concept that income is the result obtained on investments carried out in the past. It compares inlows of funds (revenue) with outlows of funds (expenditure) that have occurred or are still to occur in order to calculate earnings. It focuses on measuring income by comparing past and future (recognized receivables) cash inlows with past and future (recognized payables) cash outlows over time (income statement) and not equity value at a particular time. he cash value invested in ixed and intangible assets is spread over time via depreciation (or amortization) and as a result there is a complete link between income and “nominal” cash low over time.
his type of cost has been the most widely used basis for measurement in accounting (Dameda, Alves & Ott, 2011; Iudícibus, 2010), since it has the advantage of being based on easily conirmable accounting data; that is, it reduces the need for judgment when evaluating assets. However, for the purposes of remeasuring the economic value of an asset, it is only relevant at the time the good is acquired or produced, given that immediately aterwards this amount begins to lose economic substance as a result of various factors, such as inlation and/or a change in speciic prices due to technology, for example.
On the other hand, assets recorded at HC in times of big technological changes and very low inlation can be overestimated in accounting statements, since in this case the tendency is for the modern asset to be cheaper, which may even require its impairment to be recorded; that is, loss of the non-recoverable portion in the future. Part of the income calculated via this method may be illusionary, since in this aspect in order to calculate income, the date of formation is not considered; that is, the actual cash outlow date. his income is calculated using monetary values on diferent dates, and thus does not represent economic reality. herefore, part of this income does not constitute a genuine increase in equity, which only exists due to a surplus to the inlationary efect. HC is not very representative as a measure of value, both for measuring equity and earnings.
Bringing the discussion to the electricity sector, there is not much to be discussed with regards to this method for setting tarifs, as the costs are, and must be, updated using
some general or speciic price variation index. Despite this method presenting practicality and not leaving any margin for judgment, ultimately it is totally or partially invalidated in practice, by the persistent inlation, be this higher or lower in the long term, in any country.
2.1.2 Restated historic cost.
RHC is the value by which a good, revenue, or expense is recorded by its original value updated using a particular general price variation index; that is, keeping the original cost at a later date is made possible. It does not concern current cost, but simply recalculates HC in accordance with variations in the general purchasing power of a currency. hus, it does not represent a new sales value on the asset market, but rather the investment made in the asset updated monetarily or the value of an expense or revenue also corrected for inlationary efects. Its aim is simply to relect the efects of inlation and not to produce market values.
According to Martins (1972, p. 2), with this method it is possible to put various costs occurring on diferent dates into purchasing power values on the same date, resulting in better comparability. his comparison is one of the great advantages of this method; that is, to bring transaction values to the same date and to a currency with the same purchasing power. It thus enables the application of the concept of income based on maintaining monetary capital; that is, that income is the value in excess of the monetary capital originally invested; only improved by correcting this investment monetarily.
In Brazil, monetary restatement of balance sheets became mandatory in 1964, with the passing of Act n. 4,537/1964 (Brazil, 1964), but it had already been facultative since 1944. However, in 1995, this law was overruled with the enactment of Act n. 9,249/1995 (Brazil, 1995). he issue has been quite widely debated by Barbieri (1996), Martins (1982, 1984a, 1984b, 1985, 2002, 2004), Santos (2001a, 2001b, 2002), and Santos and Barbieri (1990). Other Brazilian studies such as those from Brunéli (1987), Feitosa (2002), Gabriel, Assaf, and Corrar (2003), Salotti, Lima, Corrar, Yamamoto, and Malacrida (2006), and Szuster (1985), and international ones such as those from Baran, Lakonishok, and Ofer (1980), Davis-Friday (2001), and Gordon (2001), have shown the importance of recognizing inlation in accounting statements.
equity (long-life non-monetary items), recording their efects in a single entry in the income statement; that is, simpliication is involved. As for CMC, which originated together with price level accounting, this updates all asset and income accounts, with accounting statement values shown in constant purchasing power currency. Although BMC results in acceptable net income and balance sheet values, CMC presents improvements that enable a more exact assessment of assets, since it identiies the items that generate losses or gains due to inlation.
Bringing this discussion to the electricity sector, measuring RBR in accordance with RHC can cause a value of investment that burdens tarifs in the long run, compared with what would occur with RC if this were lower than the evolution of inlation. Nonetheless, the monopolist may not have incentives to carry out prudent investments, but instead maintain redundant assets with the aim of receiving a return on them; however, a governance structure with eicient oversight can resolve this question.
Diferences can also occur in the choice of index to be used (Souza, 2004) or indices can be manipulated by the government (as has already occurred in Brazil and appears to be occurring in a neighboring country lately) and as a result reports can be distorted, this being a disadvantage of the RHC method. But the quality of these general price indices is determined by their structure, by the samples, and by the quality of information gathering, and most of these problems also exist when seeking replacement values for assets. Each index uses a diferent methodology and is also calculated by various diferent agencies.
In this article, the IPCA is defended since it relects oicial inlation. In the electricity sector, tarifs aim to enable investments made in the past to be recovered and to also enable an agreed rate of return. his study argues that RHC fulills this aim because it provides a tarif able to recover capital actually invested in the past and obtain a rate of return on this amount. And, when the useful life of an asset reaches its end and it needs to be substituted, the investor is obliged to ind the capital to carry out the new investment, be this greater or lower than the previous one, and this new capital will be recovered in the future as the good is used and a contractual rate of return is obtained based on this new investment. In light of this, RHC is an option for setting tarifs, especially because it balances costs and beneits and also because it considers the historical context and not uncertain and discretionary variables. It is also important to mention that even with the original value some distortions or imperfections can occur in their measurement, especially in the sector being analyzed.
2.1.3 Depreciated optimized replacement cost.
his method is seen as a reinement of RC, as it involves the current cost of replacing a modern asset, supposing that it will be substituted by a more eicient one, and it is adopted in Australia and New Zealand. According to Economic Insights (2009, p. 8),
Depreciated optimized replacement cost (DORC) is deined as the depreciated cost of replicating a system using modern equivalent asset values in the most eicient way possible, given the network’s service capability, with depreciation based on the age of the existing assets.
However, in a study by Spence (2004), the use of this methodology in the electricity sector was analyzed and it was concluded that it is a weak concept and does not resolve the problems of tarif regulation. hus, the authors defend the use of current cost or a previously agreed assessment in order to produce a better regulatory result and fairer prices for consumers.
his method can lead a company to receive tarifs as if its infrastructure were new, eicient, and at today’s prices, whereas in fact this may involve old assets with a long-lasting useful economic life. his means that the consumer would be funding an investment carried out long ago, as if it were being constructed today; that is, current performance being measured based on estimated future investments and not on past investments, as with RHC.
ANEEL used this method in the 1st CPTR, as there
were was not yet any reference database available for concessionaires. However, as Teixeira (2005) explains, the Brazilian experience of applying DORC was a diicult process, with undesirable consequences for the regulators and society, such as higher temporary tarifs, disincentives for investors to make new investments, and a complex methodology, leading to a lack of transparency and less regulatory body credibility.
2.1.4 New replacement value.
cost of the capital used, although it is not very widespread among Brazilian companies, which can make it diicult to apply.
herefore, if the new good value is used as the basis for setting tarifs, the investor receives a diferent amount from that initially invested. For example, if the cost of the good is R$ 100.00, corrected by inlation it would be R$ 110.00, and if when the tarif is reviewed, the new asset assessment is R$ 120.00, the investor receives for the R$ 120.00 and not for the R$ 110.00 actually spent; that is, the investor is rewarded for more than the capital invested and by the value of a good that is still to be replaced, the price of which may be very diferent at the time. If the opposite occurs, and the NRV is lower than what was invested, for example R$ 80.00, the company will lose out, since it spent R$ 100.00 in nominal terms and R$ 110.00 in corrected terms. In this case, the consumer beneits and this risk can also lead the investor to only enter into the business via an additional rate of return that compensates for this new risk.
2.1.5 Advantages and disadvantages of RHC and RC (DORC and NRV).
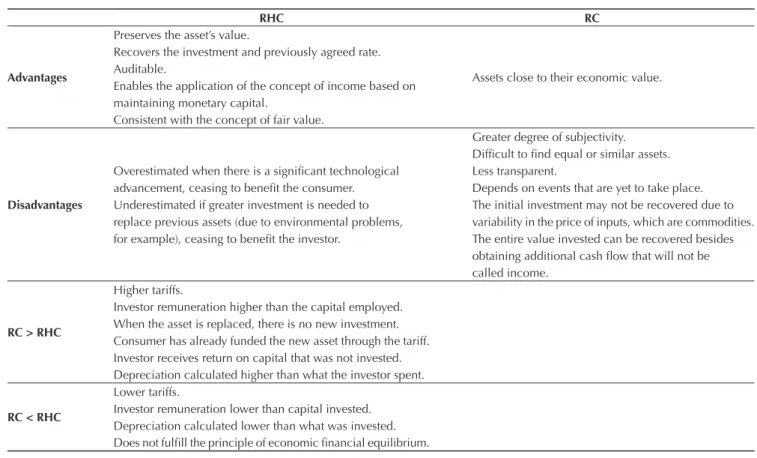
his topic aims to compare the two methodologies (RHC and RC), since this study is based on them, by revealing the strong and weak points of each one. Table 1 presents the advantages and disadvantages of RHC and of RC and the consequences of applying them. RHC presents more advantages than RC, in the view of these authors. he disadvantage of RHC for the consumer occurs when there is a signiicant technological advancement that leads to a decrease in the replacement value. However, when setting the tarif, the investor must be remunerated for the capital that was invested and not for what will be replaced in the future. Also, with regards to the investment carried out, this was what was most eicient at the time, and the investor cannot be penalized for this. RHC is more transparent and auditable and provides, in real terms, the value of the asset that was previously acquired. It is this value that should be the basis for remuneration, enabling investments to be recovered in consistent real terms, thus adhering to the concept of fair value adopted in this article.
RHC RC
Advantages
Preserves the asset’s value.
Assets close to their economic value. Recovers the investment and previously agreed rate.
Auditable.
Enables the application of the concept of income based on maintaining monetary capital.
Consistent with the concept of fair value.
Disadvantages
Greater degree of subjectivity. Dificult to ind equal or similar assets. Overestimated when there is a signiicant technological Less transparent.
advancement, ceasing to beneit the consumer. Depends on events that are yet to take place. Underestimated if greater investment is needed to The initial investment may not be recovered due to replace previous assets (due to environmental problems, variability in the price of inputs, which are commodities. for example), ceasing to beneit the investor. The entire value invested can be recovered besides
obtaining additional cash low that will not be
called income.
RC > RHC
Higher tariffs.
Investor remuneration higher than the capital employed. When the asset is replaced, there is no new investment. Consumer has already funded the new asset through the tariff. Investor receives return on capital that was not invested. Depreciation calculated higher than what the investor spent.
RC < RHC
Lower tariffs.
Investor remuneration lower than capital invested. Depreciation calculated lower than what was invested. Does not fulill the principle of economic inancial equilibrium.
RHC = restated historical cost; RC = replacement cost.
Source: Prepared by the authors.
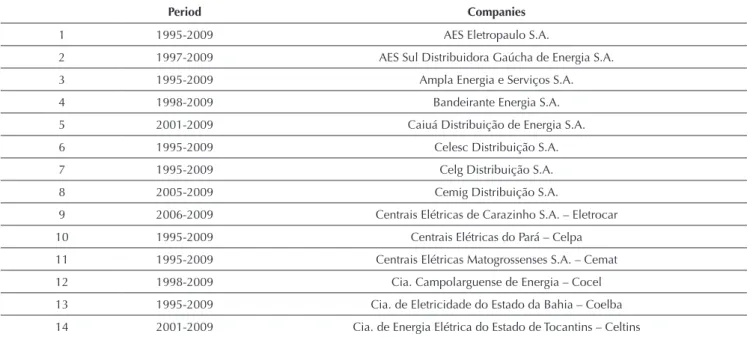
Table 2 Final study sample
Period Companies
1 1995-2009 AES Eletropaulo S.A.
2 1997-2009 AES Sul Distribuidora Gaúcha de Energia S.A.
3 1995-2009 Ampla Energia e Serviços S.A.
4 1998-2009 Bandeirante Energia S.A.
5 2001-2009 Caiuá Distribuição de Energia S.A.
6 1995-2009 Celesc Distribuição S.A.
7 1995-2009 Celg Distribuição S.A.
8 2005-2009 Cemig Distribuição S.A.
9 2006-2009 Centrais Elétricas de Carazinho S.A. – Eletrocar
10 1995-2009 Centrais Elétricas do Pará – Celpa
11 1995-2009 Centrais Elétricas Matogrossenses S.A. – Cemat
12 1998-2009 Cia. Campolarguense de Energia – Cocel
13 1995-2009 Cia. de Eletricidade do Estado da Bahia – Coelba 14 2001-2009 Cia. de Energia Elétrica do Estado de Tocantins – Celtins
One big disadvantage of RC is its degree of subjectivity, which impedes greater oversight by the regulator and by society, with it is thus being less transparent. And as the values are still to be determined, over a long period of time, this amount may be very diferent from the actual future value. As already mentioned, some inputs used in the investments are commodities with considerable volatility, and depending on the date of the assessment report, these prices may be increasing or decreasing, thus hampering a fair measurement. his variation can expose investors to unexpected risks, and to cover these risks, there has to be some compensation, such as an adjustment to the previously agreed rate of return.
For new investors to engage in decision making and
strategic planning, RC is advantageous, as it provides an asset value close to its economic value, but for setting tarifs it can be prejudicial for the investor and/or consumer. When the RC is higher than the RHC in the assessment report for the tarif review (that is, greater than inlation in the period), causing a higher tarif than is necessary, in this case the consumer will be “funding” a surplus for replacing an asset in the future. Conversely, if the RC is lower than the RHC, the consumer will beneit, but it puts future service provision at risk. he investor does not recover the capital previously invested, when another reality existed; that is, another technology was available at that time and was considered the most eicient.
3. RESEARCH DESIGN
The population studied in this paper covers the 63 concessionaire companies in the electric power distribution sector. he accounting statements required by corporate legislation were collected from the Brazilian Securities and Exchange Commission (CVM) website (http://www.cvm.gov.br) and/or the websites of the distributor companies and covered 1995 to 2009. he information made available in the public hearings for each distributor’s CPTR was also collected, especially the technical notes (TN), which provide the deinitive result, in which the approved values can be found for setting the tarifs.
Each company’s accounting statements were monetarily corrected up to December 2009 using the IPCA. Each
distributor has its own tarif review date and the asset assessment report is carried out six months beforehand; thus, when the review date was, for example, in April 2008, the report was carried out in November of 2007 – the accounting statement used for comparison purposes is the annual statement for 2007.
Table 2 presents the inal list of companies (of the 63 companies, only 44 are analyzed due to unavailable data) and the period in which the statements were monetarily updated. It is worth mentioning that the companies analyzed for the 2nd CPTR correspond to 96.55% of total
3.1 Sample Treatment
Initially, the data were updated monetarily using the model developed by Martins, Salotti, Amaral, Nagai, and Melo (2012). he steps were those described as follows. Fixed assets in service (FAS) were separated from ixed assets in the pipeline, as the latter are not included in the tarif calculation because they are not in use; special operations (SO) were not subtracted from FAS, given that the gross value of ixed assets is initially used. SO were subtracted when the basis for remuneration was
calculated, at the same time they were added to net equity. Accumulated depreciation only refers to FAS. he annual IPCA rates from 1996 to 2009 were collected, as well as the income tax and social security rates. In the explanatory notes (EN), the companies that carried out reassessments in the period were identiied, these being: Ampla Energia e Serviços S.A. (Ampla), Empresa Elétrica Bragantina S.A. (EEB), Caiuá Distribuição de Energia S.A. (Caiuá), Celg Distribuição S.A. (Celg-D), Centrais Elétricas do Pará (Celpa), Cia. de Energia Elétrica do Estado de Tocantins (Celtins), Centrais Elétricas Matogrossenses
Period Companies
15 1995-2009 Cia. Energética de Pernambuco – Celpe
16 1995-2009 Cia. Energética do Ceará – Coelce
17 1995-2009 Cia. Energética do Maranhão – Cemar
18 1995-2009 Cia. Energética do Rio Grande do Norte – Cosern 19 2006-2009 Cia. Estadual de Distribuição de Energia Elétrica – CEEE-D
20 2006-2009 Cia. Força e Luz do Oeste – CFLO
21 2004-2009 Cia. Hidroelétrica São Patrício – Chesp
22 2001-2009 Cia. Nacional de Energia Elétrica – CNEE
23 1998-2009 Cia. Paranaense de Energia – Copel D
24 1995-2009 Cia. Paulista de Força e Luz – CPFL Paulista 25 2006-2009 Cia. Paulista de Força e Luz Santa Cruz – CPFL Santa Cruz
26 2001-2009 CPFL Piratininga – CPFL Piratininga
27 1998-2009 Elektro Eletricidade e Serviços S.A.
28 2002-2009 Eletrobras Distribuição Alagoas – Ceal
29 2002-2009 Eletrobras Distribuição Acre – Eletroacre
30 2002-2009 Eletrobras Distribuição Piauí – Cepisa
31 2002-2009 Eletrobras Distribuição Rondônia – Ceron
32 1998-2009 Eletrobras Distribuição Roraima – Boa Vista Energia
33 2005-2009 Empresa de Distribuição de Energia Vale do Paranapanema S.A. – EDEVP
34 2001-2009 Empresa Elétrica Bragantina S.A. – EEB
35 1995-2009 Empresa Energética de Mato Grosso do Sul S.A. – Enersul 36 2004-2009 Empresa Luz e Força Santa Maria S.A. – ELFSM 37 1999-2009 Energisa Borborema Distribuidora de Energia S.A. 38 1995-2009 Energisa Minas Gerais Distribuidora de Energia S.A. 39 1999-2009 Energisa Nova Friburgo Distribuidora de Energia S.A. 40 1999-2009 Energisa Paraíba Distribuidora de Energia S.A. 41 1999-2009 Energisa Sergipe Distribuidora de Energia S.A. 42 1995-2009 Espírito Santo Centrais Elétricas – Escelsa
43 1995-2009 Light Serviços de Eletricidade S.A.
44 1997-2009 Rio Grande Energia S.A. – RGE
S.A. (Cemat), Cia. Força e Luz do Oeste (CFLO), Cia. Nacional de Energia Elétrica (CNEE), Centrais Elétricas de Carazinho S.A. (Eletrocar), AES Eletropaulo S.A. (Eletropaulo), and Rio Grande Energia S.A. (Rio Grande). he reassessed values were subtracted from FAS, from accumulated depreciation and depreciation expenses for the period, as well as from NE. his adjustment was made from the year in which the reassessment was recorded until its deinitive retirement, with the aim of removing any correction to the asset that was not by inlation. he data were transferred onto an Excel spreadsheet. hen the Martins et al. (2012) model was applied. First, the annual variations in gross FAS (retirements, acquisitions and/or transfers of FA in the pipeline) were calculated, by the diference, based on the published data, with the same occurring with FA in the pipeline, depreciation, and net equity. hen, the FA in service and in the initial pipeline were corrected for inlation and for the variations in each period.
he same procedures were adopted in relation to depreciation, to income, and to net equity, and as a result, the deferred taxes were calculated, as well as the efects on FA in service and in the pipeline. Deferred taxes were calculated on the diference between corrected and historical FAS in each period, which also generates a liability for the deferment of taxes due to the greater corrected net equity than nominal net equity. The diference between the inal and initial balance of deferred taxes is an adjustment to tax expenses for the period, decreasing corrected net income. Finally, it was possible to compare the historical and corrected values of FA in service and in the pipeline, net income, net equity, and also calculate the return on net equity (ROE), historical and corrected, which will be used subsequently.
Ater these steps and with the data already corrected using the IPCA, it was possible to recalculate the RBR based on corrected and historical FAS, in order to compare with the RBR at NRV validated by ANEEL. ANEEL publishes the deinitive result of each tarif review in TN. Each TN contains a table summarizing the approved RBR with NRV values. he FAS, ROE, tarif repositioning index (TRI), gross RBR (RBRg), market value in use (MVU), base value for remuneration (BVR), regulatory reintegration quota (RRQ), and capital remuneration (CR) variables were taken from this table and the ROE was calculated based on the data collected from the accounting statements. his table was reconstructed for each company with HC and RHC values for comparison purposes.
It is essential to establish which measure can represent fair value for the consumer and for the investor. It is understood that for the consumer the lowest tarif is best
and for the investor the highest return is best. he fair value will obviously be at the equilibrium between both aims and this equilibrium needs to derive from some assumption. As already stated in this paper, fair value is considered to be one which enables recovery of capital invested corrected by inlation plus the return on this capital, which considers the actual cost of the capital applied. he consumer would not bear the cost of paying for new investments still to be carried out and would not beneit from losses in the capital previously invested by the investor. And the opposite would also not occur: investors beneiting because new investments are being funded by the consumer and not by them, or investors being adversely afected because they cannot recover investments previously made. hus, it is understood that the main variables for the analysis are:
● TRI, where the lower the index, the lower the tarif; that is, it represents the greatest consumer interest;
● ROE, which constitutes one of the main measures of return and relates the investment made with the partner’s earnings; that is, it represents the investor interest, and the higher it is the better for the investor;
● Maintaining physical capital, which will be represented by FAS, and as with ROE, the higher it is the better for the investor, who will receive a higher return on the assets, as well as carrying out new investments.
With the data collected, it was also possible to analyze other variables:
● RBRg, which is the amount of FAS subtracted from SO, from totally depreciated goods, and from the overall utilization rate;
● MVU, which is calculated by FAS subtracted from accumulated depreciation;
● BVR, which represents MVU subtracted from the depreciated utilization rate;
● RRQ, which is the product of RBRg and the rate of depreciation;
● CR, which is the product between net RBR and the weighted average cost of capital (WACC) before calculating taxes.
3.2 Statistical Treatment
Ater forming the database, the comparison of means test was carried out. In order to deine the test to be applied, the Kolmogorov-Smirnov (K-S) data normality test, indicated for the sample size used, was carried out. If the distribution was normal at a level of signiicance above 5% (p > 0.05), the Student t parametric test would be used; otherwise (p < 0.05), it would be used the Wilcoxon test, which would be a non parametric test. he result, which will be detailed below, showed that there is data normality, and so the Wilcoxon test was used, the main aim of which is to verify the direction and intensity of
the diferences in the two related samples.
In the case of this study, the aim is to investigate whether there are signiicant diferences between the NRV and RHC methods for each variable. For this, the following procedure was adopted:
● he null hypothesis H0 indicates that there is no diference in the variables between the NRV and RHC measurement models.
● he alternative hypothesis H1 indicates that there is a diference in the variables between the NRV and RHC measurement models.
● 5% level of signiicance.
4. PRESENTATION AND DISCUSSION OF THE RESULTS
he results found for the 2nd CPTR are presented in the
next subsections. In the irst, an analytical approach was used for the data corrected by the IPCA. In the second, a statistical analysis of the data was carried out. he last lays out the conclusions drawn from the evidence found.
4.1 Analytical Approach for the 2nd CPTR - IPCA
With the RBR data determined, irst the percentage difference between the values found by the three measurement methods was calculated, based on the annual statement used for the 2nd CPTR and the respective
TN, which provides the deinitive results. hese diferences were calculated by dividing the NRV values by the corrected RHC values.
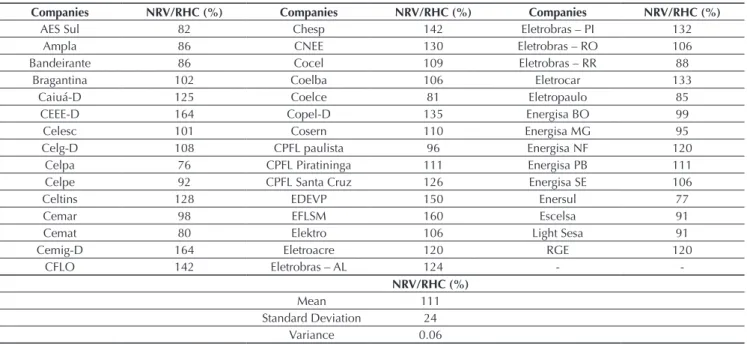
The results for the 44 companies can be seen in Table 3. As can be observed, the values are very diverse.
Table 3 Fixed assets in service – 2nd Cycle Periodic Tariff Review – extended consumer price index.
Companies NRV/RHC (%) Companies NRV/RHC (%) Companies NRV/RHC (%)
AES Sul 82 Chesp 142 Eletrobras – PI 132
Ampla 86 CNEE 130 Eletrobras – RO 106
Bandeirante 86 Cocel 109 Eletrobras – RR 88
Bragantina 102 Coelba 106 Eletrocar 133
Caiuá-D 125 Coelce 81 Eletropaulo 85
CEEE-D 164 Copel-D 135 Energisa BO 99
Celesc 101 Cosern 110 Energisa MG 95
Celg-D 108 CPFL paulista 96 Energisa NF 120
Celpa 76 CPFL Piratininga 111 Energisa PB 111
Celpe 92 CPFL Santa Cruz 126 Energisa SE 106
Celtins 128 EDEVP 150 Enersul 77
Cemar 98 EFLSM 160 Escelsa 91
Cemat 80 Elektro 106 Light Sesa 91
Cemig-D 164 Eletroacre 120 RGE 120
CFLO 142 Eletrobras – AL 124 -
-NRV/RHC (%)
Mean 111
Standard Deviation 24
Variance 0.06
RHC = restated historical cost; NRV = new replacement value.
Source: Prepared by the authors.
he measurements based on NRV were lower than those based on RHC for 36% of the companies (16 companies). As shown in the conceptual review, a lower value based on NRV than that based on RHC beneits the consumer with lower tarifs; however, the investor does not recover their investment. he 16 concessionaires will be able to replace their assets at the end of their useful life. However, because the capital is not recovered, there will be resistance to carrying out future investments in other public tender processes, with investors in 16 companies being remunerated below inlation.
And, in the other companies (28), the NRV was higher than the RHC. In this case, when the value based on NRV is higher than the one based on RHC, the adversely afected party is the consumer, who is remunerating the investor for more than what the latter previously invested. his means than this investor is funding an asset that will still be constructed and not an asset that is being used. Here it is worth returning to the airmation formulated in the introduction: NRV leads to current consumers
bearing the costs of a good that will be acquired in the future, and not the services already provided.
On average, FAS based on NRV were 11% higher than those based on RHC; that is, there is an indication that, on average, the investor is receiving values above inlation and the consumers are spending more than necessary.
Table 4 shows the TRI. he result coincides with that of the previous table, in which FAS based on NRV are compared with those based on RHC. his result was already expected, given that capital remuneration (CR) and RRQ directly depend on the value of FAS. In the case of TRI, the lower the percentage is, the lower the tarif. It is worth noting that in the 2nd CPTR, of the 44 companies,
Analyzing Table 4, it is perceived that 7 companies presented a positive TRI based on RHC. he result is the same when the NRV method is used, adding only AES Sul Distribuidora de Energia S.A. (AES Sul), for which the TRI based on RHC was positive by 0.15%. he greatest readjustment in the 2nd CPTR was that of Energisa NF, at
11.04%, and the smallest was that of Elektro (Elektro), at 20.52% negative. If the RHC methodology was adopted, Energisa NF would also present the greatest readjustment, but by a smaller percentage, of 7.66%, and Cemig-D would present the greatest fall in tarif, of 26.11%. he 16 companies that presented the lowest FAS based on NRV also had a lower tarif in relation to RHC. he other 28 had a higher TRI based on NRV than that calculated based on RHC, with the RHC method leading to lower tarifs for 64% of the companies. It can be inferred that when FAS calculated based on NRV is lower than when calculated based on RHC, the tarif will also be lower. he opposite is also true; that is, with a higher FAS value based on NRV than that based on RHC, the tarif will
also be higher: however, in percentage terms it is not proportional. Cemig-D, which presented a 64% higher FAS-NRV, experienced a fall in tarif of approximately 33%; that is, the TRI based on RHC was 26.11% negative, and that based on NRV was 19.68%; the TRI was also negative. For Celpa, which presented the lowest FAS based on NRV, 24% in relation to that based on RHC, there was an 8.38% fall with regards to the TRI calculation, and when measured based on RHC, it presented a 3.89% fall; that is, the diference between the two methods is more than 115% in this case.
Another important point is that the FAS value does not determine whether the TRI will be negative or positive. What it does determine is that, depending on the FAS value measured via each method, there will be a higher or lower tarif, but not whether the readjustment index will be positive or negative. his depends on other variables, such as the Portion A (which is not manageable) and the reference company amount, among others. On average, the tarifs at RHC were lower than those calculated using
Table 4 Result of the tariff repositioning index at new replacement value and restated historical cost – 2nd Periodic Tariff Review –
extended consumer price index.
Companies NRV (%) RHC (%) Companies NRV (%) RHC (%)
AES Sul -2.74 0.15 CPFL Paulista -14.07 -13.55
Ampla 1.83 5.55 CPFL Piratininga -13.50 -14.50
Bandeirante -9.79 -7.73 CPFL Santa Cruz -17.05 -19.08
Bragantina 2.19 1.90 EDEVP -4.77 -7.82
Caiuá -8.05 -9.88 EFLSM -14.82 -19.83
CEEE-D -0.39 -6.84 Elektro -20.52 -21.35
Celesc -9.16 -9.28 Eletroacre -6.94 -9.84
Celg-D -9.56 -10.41 Eletrobras – AL -17.71 -20.18
Celpa -8.38 -3.89 Cepisa -10.33 -13.29
Celpe -6.16 -4.81 Eletrobras – RO -19.66 -20.28
Celtins -7.24 -10.59 Eletrobras – RR -20.05 -18.34
Cemar -11.03 -10.48 Eletrocar -2.67 -3.92
Cemat -5.91 -1.80 Eletropaulo -8.07 -5.53
Cemig-D -19.68 -26.11 Energisa BO 6.05 6.19
CFLO -6.60 -8.55 Energisa MG -7.40 -6.72
Chesp -10.25 -15.39 Energisa NF 11.04 7.66
CNEE -9.90 -11.69 Energisa PB -14.73 -16.02
Cocel -11.74 -12.48 Energisa SE -14.49 -15.33
Coelba -13.75 -14.81 Enersul -7.76 -1.93
Coelce -8.89 -5.11 Escelsa 4.41 6.10
Copel-D -7.49 -10.90 Light Sesa 2.06 4.12
Cosern -8.04 -9.57 RGE -8.11 -10.19
RHC = restated historical cost; NRV = new replacement value.
Source: Prepared by the authors.
NRV (%) RHC (%)
Mean -8.41 -9.01
Standard Deviation 7.11 8.08
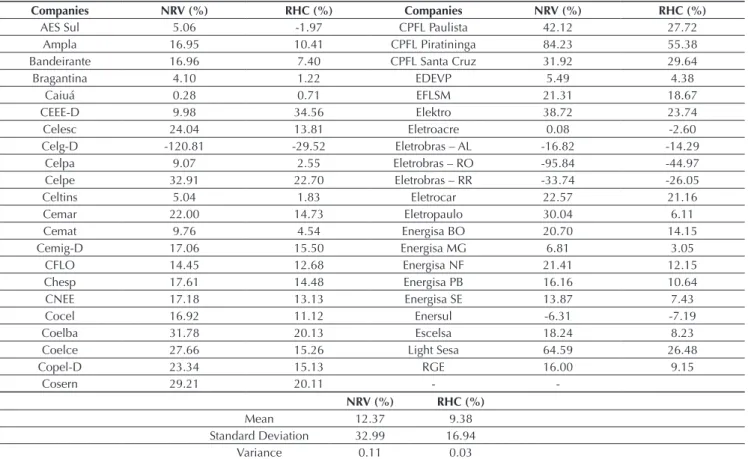
Table 5 Return on net equity at new replacement value and restated historical cost – 2nd Cycle Periodic Tariff Review – extended
consumer price index.
Companies NRV (%) RHC (%) Companies NRV (%) RHC (%)
AES Sul 5.06 -1.97 CPFL Paulista 42.12 27.72
Ampla 16.95 10.41 CPFL Piratininga 84.23 55.38
Bandeirante 16.96 7.40 CPFL Santa Cruz 31.92 29.64
Bragantina 4.10 1.22 EDEVP 5.49 4.38
Caiuá 0.28 0.71 EFLSM 21.31 18.67
CEEE-D 9.98 34.56 Elektro 38.72 23.74
Celesc 24.04 13.81 Eletroacre 0.08 -2.60
Celg-D -120.81 -29.52 Eletrobras – AL -16.82 -14.29
Celpa 9.07 2.55 Eletrobras – RO -95.84 -44.97
Celpe 32.91 22.70 Eletrobras – RR -33.74 -26.05
Celtins 5.04 1.83 Eletrocar 22.57 21.16
Cemar 22.00 14.73 Eletropaulo 30.04 6.11
Cemat 9.76 4.54 Energisa BO 20.70 14.15
Cemig-D 17.06 15.50 Energisa MG 6.81 3.05
CFLO 14.45 12.68 Energisa NF 21.41 12.15
Chesp 17.61 14.48 Energisa PB 16.16 10.64
CNEE 17.18 13.13 Energisa SE 13.87 7.43
Cocel 16.92 11.12 Enersul -6.31 -7.19
Coelba 31.78 20.13 Escelsa 18.24 8.23
Coelce 27.66 15.26 Light Sesa 64.59 26.48
Copel-D 23.34 15.13 RGE 16.00 9.15
Cosern 29.21 20.11 -
-RHC = restated historical cost; NRV = new replacement value.
Source: Prepared by the authors.
NRV, by -9.01% and -8.41%, respectively; that is, if the RHC method were used for the 2nd CPTR, the tarifs in
the sample studied would, on average, be 0.60% lower than those authorized at NRV, which represents a 7.17% diference.
Table 5 presents the results with regards to the ROE variable. Eletrobras Distribuição Piauí (Cepisa) was removed from this analysis given that the company presented negative net equity (net capital deiciency) and a loss. As can be seen, ive companies [Empresa Energética de Mato Grosso do Sul S.A. (Enersul), Eletrobras Distribuição Alagoas (Ceal), Boa Vista Energia (Boa Vista Energia), Ceron (Ceron), and Celg-D] presented a negative nominal ROE, given that in the year of the review they presented a loss; but for 38 companies, the nominal ROE was positive. With monetary correction, for the 5 companies with a negative nominal ROE, the efective ROE remained negative, but in diferent percentages. he diference in the efective ROE for Enersul was 13.95%, turning from 6.31% negative into 7.19% negative. As for the others, the efective ROE decreased, despite continuing
to be negative. Celg-D, for example, was the one that presented the greatest diference, moving from a negative nominal ROE of 120.81% to -29.25%, a diference of 75.56%. he highest nominal ROE found was for CPFL Piratininga (CPFL Piratininga), at 84.23%, and when corrected by IPCA it became 55.38%, a fall in returns when inlation in the period is deducted. he lowest was for Eletrobras Distribuição Acre (Eletroacre), at 0.08%, and when updated, it becomes 2.60% negative. For the companies in which the nominal ROE was positive, when updated this becomes lower, with the exception of Caiuá and CEEE-D. he smallest diference was for Eletrocar, with a fall of 6.25%, and the biggest was for Eletropaulo, with a fall of almost 80%. When updated, AES Sul, which presented a nominal ROE of 5.06%, becomes 1.97% negative (-1.97%). On average, the nominal ROE was 12.37% and the efective ROE was 9.38%. It is perceived that, in relation to the averages for FAS and TRI, there was a greater diference in terms of ROE between the two methods.
NRV (%) RHC (%)
Mean 12.37 9.38
Standard Deviation 32.99 16.94
4.2. Statistical analysis of the 2nd CPTR – IPCA
he next step was to apply the test of means to verify the differences in the variables with regards to the measurement method (MRV vs. RHC) for the year in which the 2nd CPTR occurred, by carrying out a joint
analysis of the companies.
As was already mentioned, in order to deine the test that would be carried out, it should be veriied whether the
variables have a normal distribution or not. For this, due to the size of the sample, the K-S test was carried out. here are indications that the variables do not have a normal distribution, given that the probabilities were lower than a 5% level of signiicance. As previously explained, with the variables not having a normal distribution, the Wilcoxon test was applied to evaluate the diference or not between these methods for each one of the variables. he results of these tests are presented in Table 6.
According to the results of the Wilcoxon test (Table 6), with the exception of the ROE variable, the variables calculated based on RHC and on NRV were considered to be statistically equal. With probabilities higher than 0.14, the null hypothesis was not rejected of equality between the two methods analyzed in the other variables. his means that there are no signiicant diferences in the variables when the NRV and RHC measurement methods are applied. However, in relation to the ROE variable, with a probability lower than 0.001, the RHC and NRV methods were considered to be statistically diferent; that is, the null hypothesis of equality is rejected. his result supports the previous inferences that company returns can be overestimated, and also conirms the diference in average between the two methods, in the descriptive analysis.
4.3 Conclusions from the Evidence Found
Despite not inding signiicant statistical diferences between the methods in the global analysis, with the exception of the ROE variable, in verifying the speciic cases a large number of “non-fair values” were found.
● It was found that, for 64% of the companies, FAS presents indications of being overestimated based on NRV, given that the value based on RHC was lower; that is, the FAS value using the NRV method was, on average, 11% lower than that calculated
based on RHC. In this case, it can be airmed that technological advancement does not lead to lower asset costs. he numbers cited above show that at least 16 companies are being remunerated above the rate of inlation; that is, their revenues exceed the capital invested. herefore, the irst hypothesis is accepted, in that measuring assets using the RHC method can contribute to reaching a fair value for the investor and the consumer, since it is not fair for some distributors to beneit and others not to.
● With regards to investor returns, represented by the ROE variable, despite the limitations of using HC for comparison, it was evident that most of the concessionaires are presenting positive returns (38 companies). When inlation is deducted, returns remain positive, but at lower percentages (36 companies).
It can be airmed that, on average, the companies are being adequately remunerated. RHC corrected by IPCA, as we airmed, also provides a fair return for investors. he return calculated using RHC is closer to its economic value. However, in Brazil this was only the case on average and not for each one of the consumers and each one of the investors. Many consumers lost out and many consumers gained from the substitution of RHC by NRV, and the same applies for investors: many gained and many lost out with this new basis for measurement.
Table 6 Results of the Wilcoxon test – 2nd Cycle Periodic Tariff Review – extended consumer price index.
Indicator Statistic Probability Indicator Statistic Probability
FAU -0.455 0.649 CR -0.420 0.674
RRB -0.420 0.674 ROE -3.921 0.000*
TRI -1.470 0.141 BRV -0.478 0.632
RRQ -0.420 0.674 MVU -0.478 0.632
FAS = ixed assets in service; RBR = Regulatory basis for calculating remuneration; TRI = tariff repositioning index; RRQ = regulatory reintegration quota; ROE = return on net equity; CR = capital remuneration; BRV = base remuneration value; MVU = market value in use.
* statistically different.
In summary, the indings of the study allow for it to be suggested that the currently used NRV measurement method should be changed to the RHC method corrected using the oicial rate of inlation – IPCA, since it is understood that this method provides a fair value for the consumer and the investor, for the following reasons: greater transparency and less subjectivity when calculating fixed assets in service, and therefore CR and RRQ, contributing to minimizing the problem of informational asymmetry. It is understood that there will be less discrepancy between company remunerations, since as was seen, some are receiving above the capital invested and others are not, and fewer discrepancies between consumers, who today are separated into two main groups: winners and losers, with diferent distributions between each one of the groups.
It is therefore concluded that the use of NRV is a bad public policy because it either beneits the consumer but discourages the investor, or adversely afects the consumer and beneits the investor. Equality only occurs when NRV accompanies the rate of inlation. hus, although there are, on average, no statistical diferences between the RHC and NRV methods, the theoretical framework and arguments presented suggest that RHC is the most recommended method for assessing electricity sector assets.
It is important to highlight that the results and conclusions found are exclusive to the regulated sector, in that tariffs are set by a regulatory body, and the RC method is relevant for commercial and industrial companies (mainly) from competitive sectors when their replacement costs are rising and they need, through their own activities, to raise funds to replace their assets.
For example, in a commercial activity it is extremely relevant that in the case of selling goods that have experienced an increase in RC, the stored goods are sold at an adjusted price in order to be able to raise suicient funds for their replacement. Otherwise, the seller will have to inject capital or take out a loan to renew this stock. he discussion in this paper is, however, the use of
RC in public service concessionaire companies whose tarifs are regulated, as tarifs based on the RC of a ixed asset that has increased, passed onto the consumer, attributes the responsibility to the consumer to provide funds that investors should invest in this replacement; this responsibility should not be that of consumers. And if the tarif produces the funds for this renewal, why should investors receive remuneration for an asset that they did not fund?
In the case of a lower replacement price than that of the asset to be renewed, something diferent occurs: if the seller prices the good being sold based on a replacement that will require a smaller investment, they will in fact be able to replace this product, but they will sufer a loss of capital invested in the good being sold. In the case of a tarifed service, if the ixed asset needs a smaller investment to replace the previous one, and the tarif accompanies this decrease, this is great for the consumer, but the investor may not be able to recover their investment, which would discourage them from continuing in the segment and discourage others from entering, unless they managed to increase the rate of return contained within the tarif in order to compensate for the increase in risk being incurred. For deeper analyses of the problems of variation in replacement price, including in the presence of inlation, see Szuster (1985).
Finally, the conclusion from the empirical and realistic analysis in the Brazilian setting is what the statistical analysis shows: for Brazil, replacement price does not, on average, present any signiicant diference compared to using pure and simple monetary correction for assets instead of new replacement values; but this simply hides something very relevant, since the average is derived from two main groups: (i) consumers who are paying more for energy services than they should, which constitutes a visible beneit to investors and adversely afects these consumers; and (ii) consumers who are paying less than they should, which beneits them, but adversely afects the investors.
5. FINAL REMARKS
his article sought to demonstrate the efects of each concept and criterion in treating the RBR of assets and their inluence on tarif setting in the Brazilian electricity sector, based on theories of equity valuation and inance. he two measurement methods most widely used in the electricity sector around the world (NRV and RHC) were empirically analyzed.
As laid out in this study, regulation needs to be eicient and leave little room for discretion, in order to avoid government opportunism. Moreover, constant changes in the rules lead to uncertainty in the sector. It is suggested for future cycles that an assessment of the totality of assets be repeated in a simpliied manner and in the most assertive way possible, considering the prices at the time of their immobilization; that is, the concessionaire should be remunerated by the value of the investment actually made, and based on this, a correction should be carried out using the IPCA.
Any interpretation of this study should include some limitations: the literature with regards to the topic is scare; it was not possible to analyze all of the concessionaires in the electricity sector due to it being impossible to access the data. However, it is worth noting that the sample represents 70% of the companies, and as already mentioned, accounts for more than 95% of the country’s consumer units; the model adopted to calculate the inlationary efects was carried out with approximate values, as a correction of stocks was not possible, as well as the exact dates of acquisition or retirement of each asset, for example.
Based on the analysis carried out, the measurement of assets in the Brazilian electricity sector using RHC is defended, due to the evidence presented throughout this article, given that it was shown that RHC decreases investor risk and uncertainties regarding return on invested capital, as they will receive what was actually spent at the time of investment, monetarily corrected by IPCA (which is considered representative of the oicial
Brazilian rate of inlation). Using the NRV method, this risk is inherent, since investments are remunerated by the value that will be replaced, at the time of the assessment report, which may present diferent values (higher or lower), mainly due to the volatility of commodities and technological advancement. It is interesting that the test of means did not detect any statistical diference at a 5% level of signiicance between the RHC and NRV methods, taking into account the country as a whole. here was, on average, compensation between investor and consumer gains and losses, which does not characterize a fair tarif.
Another point that warrants highlighting is that, as was already laid out over the course of this study, with the application of RHC, consumers bear the cost of what was really spent by the investor and not an amount that may be funding future investments; that is, the concessionaires may be being remunerated for investments not carried out, thus burdening consumers. he opposite can also occur if the NRV method is adopted, given that the investor can receive less than was spent, representing an expropriation of wealth by the regulator and a lack of incentives for new ventures. herefore, the conclusion is reached that replacement price tends to always lead to a loss for the consumer and beneit the investor, or exactly the opposite, depending on the evolution of this price with regards to inlation. Once again, these facts occur in individual analyses, since on average there is no statistical diference.
It is therefore believed that measuring assets using RHC is a fair public policy for setting tarifs in order to beneit the parties involved.
REFERENCES
Agência Nacional de Energia Elétrica - (s.n.). ANEEL. Retrieved from www.aneel.gov.br.
Agência Nacional de Energia Elétrica (2011). Resolução Normativa nº 457 de 08 de novembro de 2011. Retrieved from http:// www2.aneel.gov.br/cedoc/ren2011457.pdf
Anuatti, F., Neto, Pelin, E. P., & Peano, C. R. (2004). O papel do fator X na regulação por incentivos e a consolidação com a manutenção do equilíbrio econômico-inanceiro. Contribuição enviada para ANEEL referente à AP nº 43/2003. São Paulo, SP: Fundação Instituto de Pesquisas Econômicas/Universidade de São Paulo).
Baran, A., Lakonishok, J., & Ofer, A. R. (1980). he information content of general price level adjusted earnings: some empirical evidence. he Accounting Review,15(1), 22-35. Barbieri, G. (1996). Lucro inlacionário e luxo de caixa. Caderno
de Estudos, 13(jan.-jun).
Beesley, M., & Littlechild, S. (1989). he regulation of privatized monopolies in the UK. Rand Journal of Economics, 20, 454-472.
Brasil (1964). Lei nº 4.537, de 16 de julho de 1964. Autoriza a emissão de Obrigações do Tesouro Nacional, altera a legislação do imposto sobre a renda, e dá outras providências. Brasília, DF: Diário Oicial da União.
Brasil (1995). Lei nº 9.249, de 26 de dezembro de 1995. Altera a legislação do imposto de renda das pessoas jurídicas, bem como da contribuição social sobre o lucro líquido, e dá outras providências. Brasília, DF: Diário Oicial da União.
Brunéli, T. C. (1987). Os bancos comerciais sob o efeito da inlação – relexo nas suas demonstrações contábeis: um estudo de caso (Master’s Degree). Fundação Getúlio Vargas, Rio de Janeiro. Dameda, A. N., Alves, T. W., & Ott, E. (2011). Uso do custo
corrente na avaliação de ativos de empresas de tecnolgia de informação. Revista Universo Contábil, 7(3), 25-40. Davis-Friday, P. Y. (2001). Equity valuation and current cost
disclosures: the case of Mexico. Journal of International Financial Management and Accounting 12(3), 260-285. Economic Insights. (2009). Asset valuation and
capital maintenance. Report by Erwin Diewert, Denis Lawrence and John Fallon. Retrieved from http://econ.sites. olt.ubc.ca/iles/2013/06/pdf_paper_erwin-diewert-asset-valuation-productivity.pdf.
Feitosa, A. (2002). Uma análise dos efeitos inlacionários sobre demonstrações contábeis de empresas brasileiras traduzidas para apresentação no exterior (Master’s Degree). Faculdade de Economia, Administração e Contabilidade de São Paulo, Universidade de São Paulo, São Paulo.
Foster, V., & Antmann, P. (2004). he regulatory challenge of asset valuation: a case study from the Brazilian electricity distribution sector. Retrieved from http://documents.worldbank.org/ curated/en/316591468744268475/he-regulatory-challenge- of-asset-valuation-a-case-study-from-the-Brazilian-electricity-distribution-sector.
Gabriel, F., Assaf, A., Neto, & Corrar, L. J. (2003). O impacto do im da correção monetária no retorno do patrimônio líquido dos bancos no Brasil. Retrieved from http:// www.institutoassaf.com.br/downloads/Impacto_Fim_ Corre%C3%A7%C3%A3o_Monet%C3%A1ria_%20Retorno_ Patrim%C3%B4nio_L%C3%ADquidodos_Bancos_Brasileiros. pdf.
Gordon, E. A. (2001). Accounting for changing prices: the value relevance of historical cost, price level, and replacement cost accounting in Mexico. Journal of Accounting Research, 39(1), 177-200.
Greenwald, B. (1980). Admissible rate bases, fair rates of return and the structure of regulation. he Journal of Finance, 35(2), 359-368.
Iudícibus, S. (2010). Teoria da contabilidade (8a. ed.) São Paulo, SP: Atlas.
Martins, E. (1972). Contribuição à avaliação do ativo intangível (Doctoral hesis). Faculdade de Economia, Administração e Contabilidade, Universidade de São Paulo, São Paulo. Martins, E. (1982). O signiicado da correção monetária
patrimonial. Boletim IOB, Temática Contábil e Balanços, 3, 82. Martins, E. (1984a). Análise da correção monetária das
demonstrações inanceiras – implicações no lucro e na alavancagem inanceira (2a. ed.). São Paulo, SP: Atlas. Martins, E. (1984b). Contabilidade e inlação – como entender
um pouco mais. Boletim IOB, Temática Contábil e Balanços, 22, 251.
Martins, E. (1985). Correção integral de balanço. Revista da CVM, 3(7), 9-15.
Martins, E. (2002). A posição do Conselho Federal de Contabilidade com relação à atualização monetária dos balanços: decepção! Boletim IOB, Temática Contábil e Balanços, 15, 1-6.
Martins, E. (2004). Um pouco da história dos juros sobre o capital próprio. Boletim IOB, Temática Contábil e Balanços, 49, 1-7. Martins, E., Salotti, B., Amaral, J. V., Nagai, C., & Melo, S. (2012).
Demonstrações contábeis sem efeitos inlacionários: uma abordagem relativa às empresas distribuidoras de energia elétrica. Contabilidade, Gestão e Governança, 15(2), 21-35. Pedell, B. (2006). Regulatory risk and the cost of capital:
determinants and implication for rate regulation. Berlin: Springer.
Salotti, B. M., Lima, G. S., Corrar, J. L., Yamamoto, M. M., & Malacrida, M. C. (2006). Um estudo empírico sobre o im da correção monetária integral e seu impacto na análise das demonstrações contábeis: uma análise setorial. UnB Contábil, 9(2).
Santos, A. (2002). Pior que decepção! Dá para entender os resultados publicados pelas empresas? Boletim IOB, Temática Contábil e Balanços, 36, 1-7.
Santos, A., & Barbieri, G. (1990). Os bancos ganham ou não com a inlação? Boletim IOB, Temática Contábil e Balanços, 17, 168-169.
Santos, A. (2001a). Avaliação da falta de reconhecimento dos efeitos inlacionários no Brasil no período de 1966-2000 (1ª parte). Boletim IOB, Temática Contábil e Balanços, 27, 1-6. Santos, A. (2001b). Avaliação da falta de reconhecimento dos efeitos inlacionários no Brasil no período de 1966-2000 (2ª parte). Boletim IOB, Temática Contábil e Balanços, 28, 1-6. Souza, J. Â. (2004). Para entender os índices de preços – uma visão
moderna. Revista de Economia Mackenzie, 2(2), 141-168. Spence, C. (2004). he regulation of energy utilities based on
depreciated optimised replacement cost (DORC), valuation of assets (Doctoral hesis). Departamenting of Accounting and Finance, University of Wollongong, Wollongong.
Szuster, N. (1985). Análise do lucro passível de distribuição: uma abordagem reconhecendo a manutenção do capital da empresa (Doctoral hesis). Faculdade de Economia, Administração e Contabilidade, Universidade de São Paulo, São Paulo. Teixeira, D. (2005). Regulators’ challenge in the price ceiling –
the valuation of regulatory assets in the Brazil’s electricity ratemaking [Working Paper]. he George Washington University. Retrieved from https://www2.gwu.edu/~ibi/ minerva/Spring2005/Denise.Teixeira.pdf.
Address for correspondence
Maria Elisabeth Moreira Carvalho Andrade
Universidade Federal de Uberlândia, Faculdade de Ciências Contábeis Avenida João Naves de Ávila, 2121, Bloco F, Sala 205 – CEP: 38400-902 Campus Santa Mônica – Uberlândia – MG – Brazil