w w w . r b h h . o r g
Revista
Brasileira
de
Hematologia
e
Hemoterapia
Brazilian
Journal
of
Hematology
and
Hemotherapy
Original
article
Frequencies
of
polymorphisms
of
the
Rh,
Kell,
Kidd,
Duffy
and
Diego
systems
of
Santa
Catarina,
Southern
Brazil
Daiane
Cobianchi
Costa
a,
Alessandra
Arruda
Schinaider
a,
Thais
Mattos
Santos
a,
Everaldo
José
Schörner
b,
Daniel
Simon
c,
Sharbel
Weidner
Maluf
a,
Ana
Carolina
Rabello
de
Moraes
a,
Maria
Claudia
Silva
Silva
a,∗aUniversidadeFederaldeSantaCatarina,Florianópolis,SC,Brazil
bHemocentrodeSantaCatarina,Florianópolis,SC,Brazil
cUniversidadeLuteranadoBrasil,Canoas,RS,Brazil
a
r
t
i
c
l
e
i
n
f
o
Articlehistory:
Received25October2015
Accepted11April2016
Availableonline3May2016
Keywords:
Genotype
Bloodgroup
Blooddonors
a
b
s
t
r
a
c
t
Background:Redblood cellgenesare highlypolymorphicwiththedistributionofalleles
varyingbetweendifferentpopulationsandethnicgroups.Theobjectiveofthisstudywas
toinvestigategenepolymorphismsofbloodgroupsinthestateofSantaCatarina,Southern
Brazil.
Methods:Threehundred andseventy-threeunrelated blood donorsand31
transfusion-dependentpatientswereevaluated toinvestigatepolymorphismsoftheRh,Kell,Duffy,
Kidd,andDiegobloodgroupsystemsinapopulationfromthestateofSantaCatarina.The
subjects,fromsevenregionsthatcomprisetheblood-bankingnetworkofthestate,were
assessedbetweenAugust2011andMarch2014.ThegenotypesoftheRh,Kell,Duffy,Kidd,
andDiegosystemsweredeterminedusingtherestrictionfragmentlength
polymorphism-polymerasechainreactionandallele-specificpolymerasechainreactiontechniques.
Results:Thegenotypefrequenciesinthisstudyweresignificantlydifferentwhen
popula-tionsfromdifferentregionsofSantaCatarinawerecompared.Furthermore,therewerealso
significantdifferencesinthegeneticfrequenciescomparedtootherBrazilianstates.The
genotypefrequenciesoftheKellandKiddbloodgroupsaresimilartoEuropeanpopulations
fromNaples,ItalyandZurich,Switzerland.
Conclusion: Thisarticlereportsforthefirsttimethefrequencyofpolymorphismsofblood
groupsystemsinblooddonorsfromSantaCatarina,SouthernBrazil.
©2016Associac¸ ˜aoBrasileiradeHematologia,HemoterapiaeTerapiaCelular.Published
byElsevierEditoraLtda.ThisisanopenaccessarticleundertheCCBY-NC-NDlicense
(http://creativecommons.org/licenses/by-nc-nd/4.0/).
∗ Correspondingauthorat:UniversidadeFederaldeSantaCatarina,CentrodeCiênciasdaSaúde,Pós-Graduac¸ãoemFarmácia,Campus
Trindade,88040-900Florianópolis,SC,Brazil.
E-mailaddress:[email protected](M.C.S.Silva).
http://dx.doi.org/10.1016/j.bjhh.2016.04.005
1516-8484/©2016Associac¸ ˜aoBrasileiradeHematologia,HemoterapiaeTerapiaCelular.PublishedbyElsevierEditoraLtda.Thisisan
Introduction
AccordingtotheInternationalSocietyofBloodTransfusion
(ISBT),thereare about340antigens,308ofwhichare
clus-teredinto36bloodgroupsystems.1,2Forgenotypingpurposes,
the causative polymorphism of red cell antigensare
stud-iedatthemolecularlevel.3 Knowingthemolecularbasisof
thesegenesisimportanttodevelopmolecularbiology
meth-ods,identifynewmutations,understandpolymorphisms,and
discovernewallelesandnewsystems.4,5
Redbloodcell(RBC)genesarehighlypolymorphic.Typing
ofRBCpolymorphismsattheDNAlevelisimportantin
trans-fusionmedicinetocreateaninventoryofdonorunitssuitable
forpatientswithrarephenotypesandtoselectappropriate
bloodunitsformulti-transfusedpatients.6,7 Furthermore,it
isusefultoidentifydonorsforthepreparationofreagentsin
RBCpanelsusedtodetectoridentifyantibodies.8Additionally,
knowingtheRBCpolymorphismsofrepeatblooddonorscan
contributetotheunderstandingofthedistributionofthese
polymorphismsinapopulation.
Molecularmethodsareappliedinsomecountriesto
iden-tifybloodgroups.8–13Furthermore,therearewell-established
bloodgroupgenotypingprotocolsvalidatedfortheBrazilian
population(e.g. Paraná StateinSouthern Brazil).14–17
How-ever,duetotheethnicdiversityinthecountry,bloodgroup
polymorphismsshouldbeinvestigatedinthedifferentregions
ofBrazil.Forinstance,nostudyhasbeenpublishedtodate
onthe populationofthe stateofSantaCatarina,Southern
Brazil.Hence,thepurposeofthisstudywastoevaluatethe
frequenciesofpolymorphismsofclinicallyimportantblood
groupsystems[Rh,Kell(KEL),Duffy(FY),Kidd(JK),andDiego
(Di)]inapopulationfromSantaCatarina.
Methods
Donorsamples
Three hundred and seventy-three blood donors were
ran-domly selected from the Hemocentro de Santa Catarina
(HEMOSC) between August 2011 and March 2014. All
sub-jects provided written consentbefore participating in this
study. This study was carried out in accordance with the
standardsrecommendedbytheEthicsCommitteeonHuman
Research of the Universidade Federal de Santa Catarina
(UFSC).
Thepopulationstudiedwasselectedfromsevendifferent
regionsofthestateofSantaCatarinaandwasarepresentative
sampleofthestate’sblood-bankingnetwork.
Patientsamples
Thirty-onesamplesfromthepooloftransfusion-dependent
patientswere analyzed. Thepatients were splitinto sickle
celldisease(SCD–n=11),myelodysplasticsyndrome(n=5),
leukemia (n=5), -thalassemia major (n=3), and anemia
(n=7).All patientshad receivedatleast threetransfusions
inthepreviousthreemonths.Everypatientprovidedwritten
consent.
Molecular
typing
GenomicDNAextraction
Toobtain theDNA,5mLofperipheralbloodwere collected
in tubescontainingethylenediaminetetraacetic acid (EDTA)
andcentrifuged(2500rpmfor10min)toobtaintheBuffycoat.
TheDNA wasextractedusingQIAamp DNABloodMiniKit
(Qiagen®,Chatsworth,CA,USA)followingthemanufacturer’s
instructions.
RHD,RHCE,Kell,Duffy,Kidd,andDiegogenotyping
Primers and amplification conditions have been described
previously.18,19RHCE*C/candRHDgenotypingwasperformed
by multiplex assay,20 and the RHD*pseudogene (RHD*,
RHD*04N.01) was detected using allele-specific polymerase
chain reaction.21 RHCE*E/e, KEL*01.1/KEL*02, FY*01/FY*02,
FY*02N.01(GATA-1mutation),JK*01/JK*02(SLC14A1gene),and
DI*01/DI*02genotypingwasperformedusingtherestriction
fragment length polymorphism-polymerase chain reaction
(RFLP-PCR) technique according to protocols previously
describedintheliterature22–24withsomemodifications.The
PCR used 200ng of DNA, 50pmol of each primer, 2nmol
of each dNTP, 1.0U of Taq DNA polymerase (Invitrogen
Life Technologies®, Grand Island, NY, USA), and buffer to
make up a final volume of50L. The amplification cycles
wereperformedinaMastercycler®PersonalThermalCycler
(Eppendorf, Hamburg, Germany) and consisted of
denatur-ation at 95◦C for 15min and 35 cycles of 20s at 94◦C,
20s at 62◦C, and 20s at 72◦C, followed by an extension
step of 10min at 72◦C. The products obtained RHCE*E/e,
KEL*01.1/KEL*02,FY*01/FY*02, FY*02N.01(GATA-1mutation),
JK*01/JK*02(SLC14A1gene),andDI*01/DI*02PCRweredigested
overnight with their respective restriction enzymes (New
EnglandBiolabsBeverly,MA,USA):BsmI,BanI,StyI,MnlI,
andMspI,infinalvolumesof20L,using10LofPCRproduct
and10Loftheenzyme/buffermixture,followingthe
manu-facturer’sinstructions.AnalysesofmutationsintheGATA-1
gene and in the other alleles [RHCE*E/e, KEL*01.1/KEL*02,
FY*01/FY*02,JK*01/JK*02(SLC14A1gene),andDI*01/DI*02]were
performed after electrophoresis in 10% polyacrylamide gel
stainedwithGelRedTM(BiotiumInc.,Hayward,CA,USA).
Statisticalanalysis
Genotypicfrequenciesobservedwerecomparedwiththe
fre-quenciesexpectedbytheHardy–Weinbergequilibriumusing
the chi-square test. A comparisonof genotypicand allelic
frequencieswasachievedbythechi-squaretestwithYate’s
correction using the Openepi software or,where
appropri-ate, Fisher’sexact testwitha2×2contingencytableusing
theSimpleInteractiveStatisticalAnalysis(SISA)software.24A
p-value<0.05wasconsideredsignificant.
Results
Threehundredandseventy-threeunrelatedhealthyOblood
theblood-bankingnetworkinthestateofSantaCatarinawere
selectedforthisstudy.Ofalldonors,105(28.2%)werefrom
Florianópolis,47(12.6%)werefromBlumenau,55(14.7%)were
fromLages,36(9.7%)werefromChapecó,58(15.5%)werefrom
Criciúma,33(8.8%)werefrom Joac¸aba,and39(10.5%)were
fromJoinville.
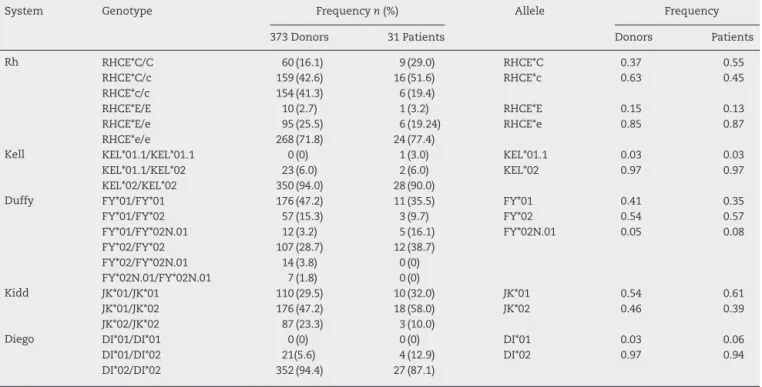
Theclinicallyimportantgenotypeandallelefrequenciesof
theRH,KEL,FY,JK,andDibloodgroupsystemsofthe
popula-tionareshowninTable1.Thepopulationwasfoundtobein
Hardy–Weinbergequilibriumforalltheanalyzedgenes.
Table2showstheanalysisofthegenotypeandallele
fre-quencies ofblood donorsfrom the seven regions ofSanta
Catarina.
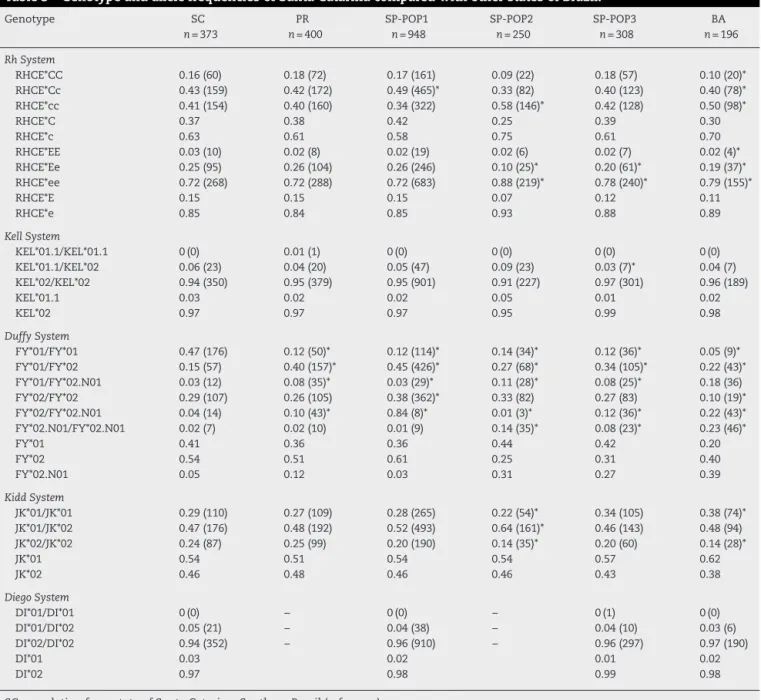
ThefrequencieswerecomparedwithotherBrazilianand
Europeanpopulations(Tables3and4,respectively).
Statistical differences were observed on comparing
these results with other Brazilian populations. The
geno-types RHCE*Ee, KEL*01.1/KEL*02, FY*01/FY*01, JK*01/JK*01,
and JK*02/02 were more prevalent in the population from
the state of Santa Catarina compared to the state of
São Paulo. In addition, the RHCE*Cc, RHCE*cc, RHCE*ee,
FY*01/FY*02,FY*01/FY*02.N01,FY*02/FY*02,FY*02/FY*02.N01,
FY*02.N01/FY*02.N01,and JK*01/JK*02genotypes were more
commoninthepopulationfromthestateofSãoPaulo.
WhenthedatawerecomparedwiththestateofBahia,only
thefrequenciesoftheKELandDisystemsdidnotdifferanda
differencewasobservedonlyfortheFYsysteminrespectto
thestateofParaná.
When the data were compared with European
popula-tions,onlytheRHCE*Cc,RHCE*EE,RHCE*ee,KEL*01.1/KEL*01.1,
KEL*01.1/KEL*02,KEL*02/KEL*02 JK*01/JK*01, and DI*01/DI*01
genotypesdidnotdifferstatistically(Table4).
A significant difference was also observed among the
regionsofSantaCatarinaasisshowninTable2.
Discussion
Knowing RBC polymorphisms ina populationisimportant
andhasbeenofinterestmainlyinthefieldsoftransfusion
medicine andanthropology.Several studieshavebeen
con-ductedwiththeaimofknowingthegenotypefrequenciesin
variouspopulationsfromdifferentcountries,includingBrazil.
The state of Santa Catarina is located in the southern
regionofBraziland,accordingtotheBraziliancensus
depart-ment (InstitutoBrasileiro deGeografiaeEstatística –IBGE),
thestatehas6,634,254inhabitants,about3.3%oftheBrazilian
population.25AccordingtoMantaetal.,26thepopulationofthe
stateofSantaCatarinaispredominantlyofEuropeanorigin
(79.7%),withacontributionofAfricans(11.4%)and
Amerindi-ans(8.9%).
Statistical differences were observed on comparing the
populationfromSantaCatarinawithpopulationsfromother
statesinBrazil(Table3).SantaCatarinaandParaná17had
sim-ilar resultsfortheRh,KEL,JK,andDibloodgroupsystems
withdifferences onlyforthe FYsystem, whichshows that
these twopopulations are geneticallysimilar probablydue
toasimilarmiscegenationpattern.However,thedifference
observed forthe FY system shows that, despitethis
simi-larity, theymay havegreater influencesbydifferent ethnic
groups.
Differenceswerealsoobservedbetweenthegenotype
fre-quenciesofSantaCatarinaandSãoPaulo15,27(Table3).These
differencescanbeexplainedbythehighpopulationdensityin
Table1–GenotypeandallelefrequenciesforRh,Kell.Duffy,KiddandDiegosystemsobservedinapopulationof373
voluntaryblooddonorsand31patientsfromsouthernBrazil.
System Genotype Frequencyn(%) Allele Frequency
373Donors 31Patients Donors Patients
Rh RHCE*C/C 60(16.1) 9(29.0) RHCE*C 0.37 0.55
RHCE*C/c 159(42.6) 16(51.6) RHCE*c 0.63 0.45
RHCE*c/c 154(41.3) 6(19.4)
RHCE*E/E 10(2.7) 1(3.2) RHCE*E 0.15 0.13
RHCE*E/e 95(25.5) 6(19.24) RHCE*e 0.85 0.87
RHCE*e/e 268(71.8) 24(77.4)
Kell KEL*01.1/KEL*01.1 0(0) 1(3.0) KEL*01.1 0.03 0.03
KEL*01.1/KEL*02 23(6.0) 2(6.0) KEL*02 0.97 0.97
KEL*02/KEL*02 350(94.0) 28(90.0)
Duffy FY*01/FY*01 176(47.2) 11(35.5) FY*01 0.41 0.35
FY*01/FY*02 57(15.3) 3(9.7) FY*02 0.54 0.57
FY*01/FY*02N.01 12(3.2) 5(16.1) FY*02N.01 0.05 0.08
FY*02/FY*02 107(28.7) 12(38.7)
FY*02/FY*02N.01 14(3.8) 0(0)
FY*02N.01/FY*02N.01 7(1.8) 0(0)
Kidd JK*01/JK*01 110(29.5) 10(32.0) JK*01 0.54 0.61
JK*01/JK*02 176(47.2) 18(58.0) JK*02 0.46 0.39
JK*02/JK*02 87(23.3) 3(10.0)
Diego DI*01/DI*01 0(0) 0(0) DI*01 0.03 0.06
DI*01/DI*02 21(5.6) 4(12.9) DI*02 0.97 0.94
Table2–GenotypefrequenciesandallelesfortheRh,Kell,Duffy,KiddandDiegosystemsinvoluntaryblooddonors
fromsevenregionsofthestateofSantaCatarina.
Genotype FLN
n=105
BLU
n=47
LGS
n=55
CPO
n=36
CRI
n=58
JOA
n=33
JOI
n=39
RhSystem
RHCE*CC 0.14(15) 0.15(7) 0.16(9) 0.19(7) 0.10(6) 0.24(8) 0.21(8)
RHCE*Cc 0.49(50) 0.36(17) 0.42(23) 0.50(18) 0.33(19) 0.43(14) 0.46(18)
RHCE*cc 0.38(40) 0.49(23) 0.42(23) 0.31(11) 0.57(33) 0.33(11) 0.33(13)
RHCE*C 0.39 0.33 0.33 0.44 0.27 0.45 0.44
RHCE*c 0.61 0.67 0.64 0.56 0.73 0.55 0.56
RHCE*EE 0(0) 0.02(1) 0.04(2) 0.06(2) 0.09(5) 0.06(2) 0(0)
RHCE*Ee 0.26(27) 0.30(14) 0.29(16) 0.28(10) 0.24(14) 0.82(27) 0.25(10)
RHCE*ee 0.74(78) 0.68(32) 0.67(37) 0.67(24) 0.67(39) 0.12(4) 0.74(29)
RHCE*E 0.13 0.17 0.18 0.19 0.21 0.47 0.13
RHCE*e 0.87 0.83 0.82 0.81 0.79 0.53 0.87
KellSystem
KEL*01.1/KEL*01.1 0(0) 0(0) 0(0) 0(0) 0(0) 0(0) 0(0)
KEL*01.1/KEL*02 0.08(8) 0.09(4) 0.13(7) 0.03(1) 0.02(1) 0.03(1) 0.03(1)
KEL*02/KEL*02 0.92(97) 0.91(43) 0.87(48) 0.97(35) 0.98(57) 0.97(32) 0.97(38)
KEL*01.1 0.04 0.04 0.06 0.01 0.01 0.01 0.01
KEL*02 0.96 0.96 0.97 0.99 0.99 0.99 0.99
DuffySystem
FY*01/FY*01 0.11(12) 0.15(7) 0.11(6) 0.22(8) 0.16(9) 0.16(5) 0.23(9)
FY*01/FY*02 0.50(52) 0.47(22) 0.45(25) 0.50(18) 0.47(27) 0.39(13) 0.49(19)
FY*01/FY*02.N01 0.00(0) 0.04(2) 0.07(4) 0.03(1) 0.07(4) 0.03(1) 0.00(0)
FY*02/FY*02 0.32(34) 0.30(14) 0.31(17) 0.19(7) 0.26(15) 0.33(11) 0.26(10)
FY*02/FY*02.N01 0.06(6) 0.02(1) 0.04(2) 0.06(2) 0.03(2) 0.03(1) 0.00(0)
FY*02.N01/FY*02.N01 0.01(1) 0.02(1) 0.02(1) 0.00(0) 0.01(1) 0.06(2) 0.02(1)
FY*01 0.36 0.40 0.37 0.49 0.42 0.36 0.47
FY*02 0.60 0.54 0.55 0.47 0.51 0.55 0.50
FY*02.N01 0.04 0.06 0.08 0.04 0.07 0.09 0.03
KiddSystem
JK*01/JK*01 0.26(27) 0.49(22) 0.31(17) 0.19(7) 0.31(18) 0.30(10) 0.23(9)
JK*01/JK*02 0.51(54) 0.33(16) 0.49(27) 0.61(22) 0.38(22) 0.45(15) 0.51(20)
JK*02/JK*02 0.23(24) 0.18(9) 0.20(11) 0.20(7) 0.31(18) 0.24(8) 0.26(10)
JK*01 0.51 0.64 0.55 0.50 0.50 0.53 0.49
JK*02 0.49 0.36 0.45 0.50 0.50 0.47 0.51
DiegoSystem
DI*01/DI*01 0.00(0) 0.00(0) 0.00(0) 0.00(0) 0.00(0) 0.00(0) 0.00(0)
DI*01/DI*02 0.06(6) 0.09(4) 0.05(3) 0.11(4) 0.02(1) 0.03(1) 0.05(2)
DI*02/DI*02 0.94(99) 0.91(43) 0.95(52) 0.89(32) 0.98(57) 0.97(32) 0.95(37)
DI*01 0.03 0.04 0.03 0.06 0.01 0.02 0.03
DI*02 0.97 0.96 0.97 0.94 0.99 0.98 0.97
FLN:Florianópolis;BLU:Blumenau;LGS:Lages;CPO:Chapecó;CRI:Criciúma;JOA:Joac¸aba;JOIN:Joinville. Figuresshownasn(%);*p-value<0.05.
thestateofSãoPaulo,SoutheasternBrazil,andthecontinuous immigrationfromthecountry’snortheasternregion.Astudy by Manta et al.26 showed that the genetic composition of
thestate ofSão Paulocomprises Europeans(61.9%),Blacks
(25.5%),andAmerindians(11.6%).ThispercentageofBlacks
mayexplainthestatisticallysignificant differenceobserved
betweenthestudiesfortheFY*01/FY*02.N01,FY*02/FY*02.N01,
andFY*02.N01/FY*02.N01genotypes.TheFY*02N.01alleleis
rareinCaucasianandAsianpopulationsandismorecommon
inAfricans.28–30
ThegenotypefrequenciesinSantaCatarinawerealso
dif-ferenttothepopulationofBahia.Thisanalysisaimedtoshow
thedifficultyinfindingcompatibilityforsicklecellpatients.
Althoughitwasexpectedthatsicklecellpatientsinthisstudy
(35.5%ofthesample)wouldhavegreatercompatibilitywith
theBrazilianNortheast,frequenciesdifferedfortheRHCE*CC,
RHCE*cc, FY*01/FY*01, FY*02/FY*02, FY*02/FY*02N.01,
FY*02N.01/FY*02N.01,JK*A/JK*A,DI*01/DI*02,andDI*02/DI*02
genotypes.
Furthercomparisonswereperformedtoanalyzethe
simi-laritybetweenthegenotypefrequenciesfoundinthisstudy
and frequenciesinEuropeanpopulations.20,31,32 Ingeneral,
the genotype frequenciesof Santa Catarina were different
however,somepopulations(Naples,ItalyandZurich,
Switzer-land)weresimilarinrespecttotheKELandJKsystems.The
difference observed for the Di system might be explained
by the Amerindian influencein theBrazilian population.24
Table3–GenotypeandallelefrequenciesofSantaCatarinacomparedwithotherstatesofBrazil.
Genotype SC
n=373
PR
n=400
SP-POP1
n=948
SP-POP2
n=250
SP-POP3
n=308
BA
n=196
RhSystem
RHCE*CC 0.16(60) 0.18(72) 0.17(161) 0.09(22) 0.18(57) 0.10(20)*
RHCE*Cc 0.43(159) 0.42(172) 0.49(465)* 0.33(82) 0.40(123) 0.40(78)*
RHCE*cc 0.41(154) 0.40(160) 0.34(322) 0.58(146)* 0.42(128) 0.50(98)*
RHCE*C 0.37 0.38 0.42 0.25 0.39 0.30
RHCE*c 0.63 0.61 0.58 0.75 0.61 0.70
RHCE*EE 0.03(10) 0.02(8) 0.02(19) 0.02(6) 0.02(7) 0.02(4)*
RHCE*Ee 0.25(95) 0.26(104) 0.26(246) 0.10(25)* 0.20(61)* 0.19(37)*
RHCE*ee 0.72(268) 0.72(288) 0.72(683) 0.88(219)* 0.78(240)* 0.79(155)*
RHCE*E 0.15 0.15 0.15 0.07 0.12 0.11
RHCE*e 0.85 0.84 0.85 0.93 0.88 0.89
KellSystem
KEL*01.1/KEL*01.1 0(0) 0.01(1) 0(0) 0(0) 0(0) 0(0)
KEL*01.1/KEL*02 0.06(23) 0.04(20) 0.05(47) 0.09(23) 0.03(7)* 0.04(7)
KEL*02/KEL*02 0.94(350) 0.95(379) 0.95(901) 0.91(227) 0.97(301) 0.96(189)
KEL*01.1 0.03 0.02 0.02 0.05 0.01 0.02
KEL*02 0.97 0.97 0.97 0.95 0.99 0.98
DuffySystem
FY*01/FY*01 0.47(176) 0.12(50)* 0.12(114)* 0.14(34)* 0.12(36)* 0.05(9)*
FY*01/FY*02 0.15(57) 0.40(157)* 0.45(426)* 0.27(68)* 0.34(105)* 0.22(43)*
FY*01/FY*02.N01 0.03(12) 0.08(35)* 0.03(29)* 0.11(28)* 0.08(25)* 0.18(36)
FY*02/FY*02 0.29(107) 0.26(105) 0.38(362)* 0.33(82) 0.27(83) 0.10(19)*
FY*02/FY*02.N01 0.04(14) 0.10(43)* 0.84(8)* 0.01(3)* 0.12(36)* 0.22(43)*
FY*02.N01/FY*02.N01 0.02(7) 0.02(10) 0.01(9) 0.14(35)* 0.08(23)* 0.23(46)*
FY*01 0.41 0.36 0.36 0.44 0.42 0.20
FY*02 0.54 0.51 0.61 0.25 0.31 0.40
FY*02.N01 0.05 0.12 0.03 0.31 0.27 0.39
KiddSystem
JK*01/JK*01 0.29(110) 0.27(109) 0.28(265) 0.22(54)* 0.34(105) 0.38(74)*
JK*01/JK*02 0.47(176) 0.48(192) 0.52(493) 0.64(161)* 0.46(143) 0.48(94)
JK*02/JK*02 0.24(87) 0.25(99) 0.20(190) 0.14(35)* 0.20(60) 0.14(28)*
JK*01 0.54 0.51 0.54 0.54 0.57 0.62
JK*02 0.46 0.48 0.46 0.46 0.43 0.38
DiegoSystem
DI*01/DI*01 0(0) – 0(0) – 0(1) 0(0)
DI*01/DI*02 0.05(21) – 0.04(38) – 0.04(10) 0.03(6)
DI*02/DI*02 0.94(352) – 0.96(910) – 0.96(297) 0.97(190)
DI*01 0.03 0.02 0.01 0.02
DI*02 0.97 0.98 0.99 0.98
SC:populationfromstateofSantaCatarina,SouthernBrazil(reference). PR:MixedBrazilianpopulationfromstateofParana,SouthernBrazil.25
SP(POP1,POP2andPOP3):MixedpopulationfromthestateofSãoPaulo,southeasternBrazil14,17andunpublisheddata.
BA:MixedpopulationfromstateofBahia,northeasternBrazil–unpublisheddata. Figuresshownasn(%)*p-value<0.05.
thestate ofSantaCatarina has8.9%ofAmerindians inits
geneticcomposition.TheDi(a)antigenisscarcely foundin
CaucasiansorBlacks (1.0%),but ithasbeenfoundinsome
NativeNorthandSouthAmericanIndiangroups(morethan
30%)andAsians(6–15%).33,34
Statisticaldifferenceswerealsoobservedamongtheseven
regionsofthe stateofSanta Catarina(Table3),whichmay
beexplainedbyethnicinfluences.SantaCatarinawas
colo-nizedpredominantlybyEuropeans;eachregionisinfluenced
bydifferentethnicgroups.AccordingtodatafromtheIBGE,
thepopulationofFlorianópolishashighproportionsof
Por-tuguese, German, Italian, Polish, Swedish, Austrian, and
SpanishdescendantswhereasthepopulationsofBlumenau,
Joac¸aba, andLages havemoreItalian andGerman
descen-dants.Moreover,thepopulationofChapecóismadeupmore
ofItalian,German,Polish,andAmerindiandescendantsand
thepopulationofCriciúmahasagreaterinfluenceofItalians,
Germans,Poles,Portuguese,andBlacks.35
The data of studies that determine genotype
frequen-ciesareusefulintransfusionmedicinetocreateadatabase
ofgenotypeddonors tofacilitatetheselection ofadequate
blood componentsforpatients(in particularsicklecell
dis-easepatients),todiscovernewalleles,andtofinddonorswith
Table4–GenotypeandallelefrequenciesofsouthernBrazilcomparedwithEuropeanpopulations.
Genotype SC
373
Austria36
n=200
Naples31
n=225
Zurich32
n=4000
RhSystem
RHCE*CC 0.16(60) – 0.31(69)* –
RHCE*Cc 0.43(159) – 0.48(109) –
RHCE*cc 0.41(154) – 0.21(47)* –
RHCE*C 0.37 0.44
RHCE*c 0.63 0.56
RHCE*EE 0.03(10) – 0.03(7) –
RHCE*Ee 0.25(95) – 0.18(42)* –
RHCE*ee 0.72(268) – 0.79(176) –
RHCE*E 0.15 0.12
RHCE*e 0.85 0.88
KellSystem
KEL*01.1/KEL*01.1 0(0) 0(1) 0(0) 0(9)
KEL*01.1/KEL*02 0.06(23) 0.08(17) 0.03(7) 0.05(196)
KEL*02/KEL*02 0.94(350) 0.91(182) 0.97(218) 0.95(3795)
KEL*01.1 0.03 0.05 0.02 0.03
KEL*02 0.97 0.95 0.98 0.97
DuffySystem
FY*01/FY*01 0.47(176) 0.20(40)* 0.18(40)* 0.18(703)*
FY*01/FY*02 0.15(57) 0.36(72)* 0.43(98)* 0.47(1862)*
FY*01/FY*02.N01 0.03(12) 0(0) 0.02(5) 0.01(52)*
FY*02/FY*02 0.29(107) 0.44(88)* 0.36(82)* 0.32(1311)
FY*02/FY*02.N01 0.04(14) 0(0)* 0(0)* 0.01(71)*
FY*02.N01/FY*02.N01 0.02(7) 0(0) 0(0)* 0(1)*
FY*01 0.41 0.38 0.41 0.42
FY*02 0.54 0.62 0.58 0.56
FY*02.N01 0.05 0 0.01 0.02
KiddSystem
JK*01/JK*01 0.29(110) 0.24(47) 0.24(55) 0.26(1053)
JK*01/JK*02 0.47(176) 0.48(97)* 0.52(116) 0.50(2001)
JK*02/JK*02 0.24(87) 0.28(56)* 0.24(54) 0.24(946)
JK*01 0.54 0.48 0.50 0.51
JK*02 0.46 0.52 0.50 0.49
DiegoSystem
DI*01/DI*01 0(0) – 0(0) –
DI*01/DI*02 0.05(21) – 0(0)* –
DI*02/DI*02 0.94(352) – 1.0(225)* –
DI*01 0.03 0
DI*02 0.97 1.00
Figuresshownasn(%).
Conclusion
ThegenotypefrequenciesoftheRh,KEL,FY,JK,andDisystems
inthepopulationofthestateofSantaCatarinawere
signifi-cantlydifferentfromthoseinotherBrazilianstates.Moreover,
thegenotypefrequenciesdifferedamongthepopulationsof
thedifferentregionsofthestateofSantaCatarina,showing
that,evenwithinthestate,thepopulationisheterogeneous.
Furthermore,thepopulation ofthestate ofSanta Catarina
hasgenotypefrequenciessimilartothoseofpopulationsfrom
Naples,ItalyandZurich,SwitzerlandfortheKELandJK
sys-tems.
Funding
ThisresearchwassupportedbyascholarshipforCosta,DC
from Capes – Coordenac¸ão de Aperfeic¸oamento de Pessoal
NívelSuperior.Thisstudywasdonewithnootherfinancial
support.
Conflicts
of
interest
Theauthorsdeclarenoconflictsofinterest.
Acknowledgements
WethankDr.MariaLuizaBazzoandtheSantaCatarinaBlood
Bankfortechnicalsupport.
r
e
f
e
r
e
n
c
e
s
Partyonredcellimmunogeneticsandbloodgroup
terminology:Cancunreport(2012).VoxSang.2014;107(1):90–6.
2. CastilhoL,PellegrinoJJr,ReidME.Fundamentosde Imuno-hematologia.Atheneu.2015.
3. JungbauerC.Bloodgroupmoleculargenotyping.ISBTScience Series.2011;6(2):399–403.
4. YipSP.SequencevariationatthehumanABOlocus.Ann HumGenet.2002;66(Pt1):1–27.
5. DanielsG.Themoleculargeneticsofbloodgroup polymorphism.HumGenet.2009;126(6):729–42.
6. DanielsG,CastilhoL,FlegelWA,FletcherA,GarrattyG, LeveneC,etal.Internationalsocietyofbloodtransfusion committeeonterminologyforredcellsurfaceantigens: Macaoreport.VoxSang.2009;96(2):153–6.
7. SmartE,ArmstrongB.Bloodgroupsystems.ISBTScience Series.2008;3(2):68–92.
8. ReidME,YasdanbakhshK.Molecularinsightsintobloodand implicationsforbloodtransfusions.CurrOpinHematol. 1998;5(2):93–102.
9. ReidM,RiosM.Applicationsofmoleculargenotypingto immunohematology.BrJBiomedSci.1999;56(2):145–52.
10.DenommeG,RiosM,ReidME.Molecularprotocolsin transfusionmedicine.SanDiego(CA):AcademicPress;2000.
11.ReidME,RiosM,YazdanbakhshK.Applicationsofmolecular biologytechniquestotransfusionmedicine.SeminHematol. 2000;37(2):166–76.
12.BeiboerSH,Wieringa-JelsmaT,Maaskant-vanwijkPA,van derSchootCE,vanZwietenR,RoosD,etal.Rapide
genotypingofbloodgroupantigensbymultiplexpolymerase chainreactionandDNAmicroarrayhybridization.
Transfusion.2005;45(5):667–79.
13.HashmiG,ShariffT,SeulM,VissavajjhalaP,Hue-RoyeK, Charles-PierreD,etal.Aflexiblearrayformatforlarge-scale, rapidbloodgroupDNAtyping.Transfusion.2005;45(5):680–8.
14.NovarettiMC,RuizAS,Dorlhiac-LlacerPE,ChamoneDA. Applicationofreal-timePCRandmeltingcurveanalysisin rapidDiegobloodgroupgenotyping.Immunohematology. 2010;26(2):66–70.
15.RibeiroKR,GuarnieriMH,CostaDC,CostaFF,PellegrinoJJr, CastilhoL.DNAarrayanalysisforredbloodcellantigens facilitatesthetransfusionsupportwithantigen-matched bloodinpatientswithsicklecelldisease.VoxSang. 2009;97(2):147–52.
16.daCostaDC,PellegrinoJJr,GuelsinGA,RibeiroKA,GilliSC, CastilhoL.Molecularmatchingofredbloodcellsissuperior toserologicalmatchinginsicklecelldiseasepatients.Rev BrasHematolHemoter.2013;35(1):35–8.
17.GuelsinGA,SellAM,CastilhoL,MasakiVL,deMeloFC, HashimotoMN,etal.GeneticpolymorphismsofRh,Kell, DuffyandKiddsystemsinapopulationfromtheStateof Parana,southernBrazil.RevBrasHematolHemoter. 2010;33(1):21–5.
18.CastilhoL,RiosM,BiancoC,PellegrinoJJR,AlbaertoFL,Saad ST,etal.DNA-basedtypingforthemanagementof
multiply-transfusedsicklecelldiseasepatients.Transfusion. 2002;42(2):232–8.
19.CastilhoL,RiosM,PellegrinoJJr,SaadST,CostaFF.Blood groupgenotypingfacilitatestransfusionofbeta-thalassemia patients.JClinLabAnal.2002;16(5):216–20.
20.Maaskant-VanWijkPA,FaasBH,deRuijterJA,OverbeekeMA, VondemBorneAE,vanRhenenDJ.GenotypingofRHDby
multiplexpolymerasechainreactionanalysisofsix RHD-specificexons.Transfusion.1998;38(11–12):1015–21.
21.SingletonBK,GreenCA,AventND,MartinPG,SmartE,Daka A,etal.ThepresenceofonRHDpseudogenecontaininga37 basepairduplicationandanonsensemutationinAfricans withtheRh-neativebloodgroupphenotype.Blood. 2000;95(1):12–8.
22.ReidME.Transfusionintheageofmoleculardiagnostics. HematolAmSocHematolEducProgram.2009;(1):171–7.
23.YazdanbakhshK,RiosM,StorryJR,KosowerN,ParasolN, ChaudhuriA,etal.Molecularmechanismsthatleadto reducedexpressionofDuffyantigens.Transfusion. 2000;40(3):310–20.
24.BaleottiWJr,RiosM,ReidM,FabronAJr,PellegrinoJJr,Saad ST,etal.AnovelDIAallelewithouttheband3-memphis mutationinAmazonianIndians.VoxSang.2003;84(4):326–30.
25.SvejgaardA,JersildC,NielsenS,BodmerWF.HL-Aantigens anddisease.Statisticalandgeneticalconsiderations.Tissue Antigens.1974;4(2):95–105.
26.MantaFS,PereiraR,ViannaR,deAraújoAR,GitaíDL,daSilva DA,etal.Revisitingthegeneticancestryofbraziliansusing autosomalAIM-Indels.PloSOne.2013;8(9):e75145.
27.PellegrinoJJr,CastilhoL,RiosM,DeSouzaCA.Bloodgroup genotypinginapopulationofhighlydiverseancestry.JClin LabAnal.2001;15(1):8–13.
28.TournamilleC,ColinY,CartronJP,LeVanKimC.Disruptionof aGATAmotifintheDuffygenepromoterabolisheserythroid geneexpressioninDuffy-negativeindividuals.NatGenet. 1995;10(2):224–8.
29.IwamotoS,LiJ,SugimotoN,OkudaH,KajiiE.
CharacterizationoftheDuffygenepromotor.Evidencefor tissue-specificabolishmentofexpressioninFy(a-b-)ofblack individuals.BiochemBiophysResCommun.
1996;222(3):852–9.
30.ParasolN,ReidME,RiosM,CastilhoL,HarariI,KosowerNS.A novelmutationinthecodingsequenceoftheFY*Balelleof theDuffychemokinereceptorgeneisassociatedwithan alterederythrocytephenotype.Blood.1998;92(7):2237–43.
31.BelsitoA,CostaD,FioritoC,DeIorioG,CasamassimiA, PerrottaS,etal.Erythrocytegenotypingfor
transfusion-dependentpatientsattheAziendaUniversitaria PoliclinicoofNaples.TransfusApherSci.2015;52(1):72–7.
32.MeyerS,VollmertC,TrostN,BrönnimannC,GottschalkJ, BuserA,etal.High-throughputKell,Kidd,andDuffy matrix-assistedlaserdesorption/ionization,time-of-flight massspectrometry-basedbloodgroupgenotypingof4000 donorsshowsclosetofullconcordancewithserotypingand detectsnewalleles.Transfusion.2014;54(12):3198–207.
33.JunqueiraPC,WishartPJ,OttensooserF,PasqualinR,Loureiro FernandezP,KalmusH.TheDiegobloodfactorinBrazilian Indians.Nature.1956;177(4497):41.
34.KomatsuF,HasegawaK,YanagisawaY,KawabataT,KanekoY, WatanabeS,etal.PrevalenceofDiegobloodgroupDia antigeninmongolians:comparisonwiththatinJapanese. TransfusApherSci.2004;30(2):119–24.
35.BrasilInstitutoBrasileirodeGeografiaeEstatística(IBGE).
[cited2015April2015]Availablefrom:http://www.ibge.gov.br/
home/estatistica/populacao/estimativa2013.
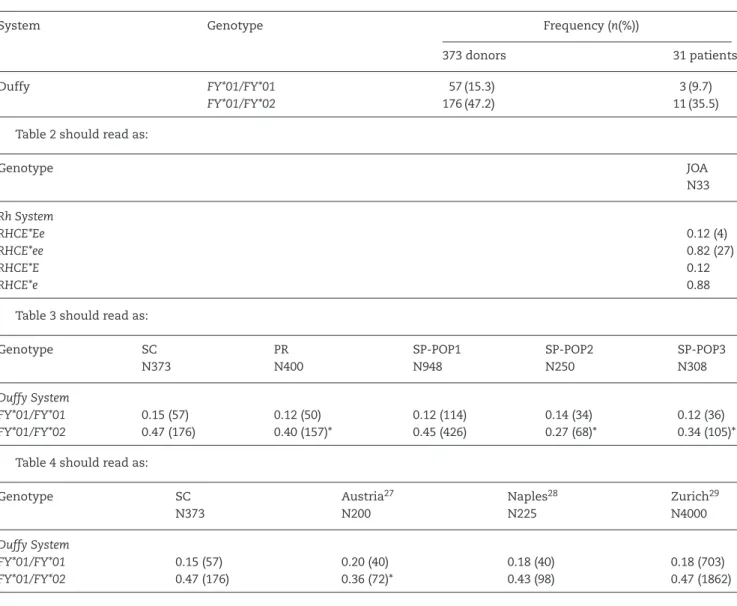
Pleaseconsiderthefollowingcorrection:
Results
Page 201 – “Statistical differences were observed in the comparison with Brazilian populations. Thegenotypes RHCE*Ee,
KEL*01.1/KEL*02,FY*01/FY*01,JK*01/JK*01,andJK*02/02weremoreprevalentinthepopulationfromthestateofSantaCatarina incomparisonwiththestateofSãoPaulo.Inaddition,RHCE*Cc,RHCE*cc,RHCE*ee,FY*01/FY*02,FY*01/FY*02.N01,FY*02/FY*02,
FY*02/FY*02.N01, FY*02.N01/FY*02.N01, and JK*01/JK*02 genotypes were morecommon inthe population from the state of
São Paulo” shouldread as “Statisticaldifferenceswere observedinthe comparisonwithBrazilianpopulations. The
geno-typesRHCE*Ee,KEL*01.1/KEL*02,FY*01/FY*02,JK*01/JK*01,andJK*02/02weremoreprevalentinthepopulationfromthestateof SantaCatarinaincomparisonwiththestateofSãoPaulo.Inaddition,RHCE*Cc,RHCE*cc,RHCE*ee,FY*01/FY*02.N01,FY*02/FY*02, FY*02/FY*02.N01,FY*02.N01/FY*02.N01,andJK*01/JK*02genotypesweremorecommoninthepopulationfromthestateofSão Paulo.”
Page 201 –“Whenthe datawere comparedwithEuropeanpopulations,onlythe genotypesRHCE*Cc, RHCE*EE,RHCE*ee,
KEL*01.1/KEL*01.1,KEL*01.1/KEL*02,KEL*02/KEL*02JK*01/JK*01,andDI*01/DI*01didnotdifferstatistically(Table4)”shouldreadas
“WhenthedatawerecomparedwithEuropeanpopulations,onlythegenotypesRHCE*Cc,RHCE*EE,RHCE*ee,KEL*01.1/KEL*01.1, KEL*01.1/KEL*02,KEL*02/KEL*02,FY*01/FY*01,JK*01/JK*01,andDI*01/DI*01didnotdifferstatistically(Table4)”.
Tables
Table1shouldreadas:
System Genotype Frequency(n(%))
373donors 31patients
Duffy FY*01/FY*01 57(15.3) 3(9.7)
FY*01/FY*02 176(47.2) 11(35.5)
Table2shouldreadas:
Genotype JOA
N33
RhSystem
RHCE*Ee 0.12(4)
RHCE*ee 0.82(27)
RHCE*E 0.12
RHCE*e 0.88
Table3shouldreadas:
Genotype SC
N373
PR N400
SP-POP1 N948
SP-POP2 N250
SP-POP3 N308
DuffySystem
FY*01/FY*01 0.15(57) 0.12(50) 0.12(114) 0.14(34) 0.12(36)
FY*01/FY*02 0.47(176) 0.40(157)* 0.45(426) 0.27(68)* 0.34(105)*
Table4shouldreadas:
Genotype SC
N373
Austria27
N200
Naples28
N225
Zurich29
N4000
DuffySystem
FY*01/FY*01 0.15(57) 0.20(40) 0.18(40) 0.18(703)