revbrashematolhemoter.2016;38(3):225–239
w w w . r b h h . o r g
Revista
Brasileira
de
Hematologia
e
Hemoterapia
Brazilian
Journal
of
Hematology
and
Hemotherapy
Original
article
Assessment
of
blood
sample
stability
for
complete
blood
count
using
the
Sysmex
XN-9000
and
Mindray
BC-6800
analyzers
Sabrina
Buoro
a,∗,
Tommaso
Mecca
a,
Michela
Seghezzi
a,
Barbara
Manenti
a,
Lorenzo
Cerutti
a,
Paola
Dominoni
a,
Gavino
Napolitano
a,
Stefano
Resmini
a,
Alberto
Crippa
a,
Cosimo
Ottomano
b,
Giuseppe
Lippi
caHospitalPapaGiovanniXXIII,Bergamo,Italy
bCAMCentroAnalisiMonza,Monza,Italy
cUniversitaàdegliStudidiVerona,Verona,Italy
a
r
t
i
c
l
e
i
n
f
o
Articlehistory:
Received4April2016 Accepted30May2016 Availableonline23June2016
Keywords:
XN-9000 BC-6800 Samplestability Completebloodcount Pre-analyticalphase
a
b
s
t
r
a
c
t
Background:Differenthematologicalanalyzershavedifferentanalyticalperformancesthat
areoftenreflectedinthecriteriaforsamplestabilityofthecompletebloodcount.Thisstudy aimedtoassessthestabilityofseveralhematologicalparametersusingtheXN-9000Sysmex andBC-6800Mindrayanalyzers.
Methods:Theimpactofstorageatroomtemperatureand4◦Cwasevaluatedafter2,4,6,
8,24,36and48husingtennormaland40abnormalbloodsamples.Thevariationfrom thebaselinemeasurementwasevaluatedbytheSteel–Dwass–Critchlow–Flignertestandby Bland–Altmanplots,usingqualityspecificationsandcriticaldifferenceasthetotalallowable variation.
Results:Red bloodcells andreticulocyteparameters (i.e. hematocrit,mean corpuscular
volume,mean corpuscularhemoglobinconcentration,redbloodcelldistributionwidth, immaturereticulocytefractions,low-fluorescencereticulocytes,middle-fluorescence retic-ulocytes,highfluorescencemononuclearcells)showedlessstabilitycomparedtoleukocyte andplateletparameters(exceptformonocytecountandmeanplateletvolume).Thebias forhematocrit,meancorpuscularvolume,meancorpuscularhemoglobinconcentration andredbloodcelldistributionwidthcoefficientofvariationwashigherthanthecritical differenceafter8husingbothanalyzers.
Conclusion: Bloodsamplesmeasuredwithbothanalyzersdonotshowanalytically
signifi-cantchangesinupto2hofstorageatroomtemperatureand4◦C.However,themaximum
timeforanalysiscanbeextendedforupto8hwhenthebiasiscomparedtothecritical difference.
©2016Associac¸ ˜aoBrasileiradeHematologia,HemoterapiaeTerapiaCelular.Published byElsevierEditoraLtda.ThisisanopenaccessarticleundertheCCBY-NC-NDlicense (http://creativecommons.org/licenses/by-nc-nd/4.0/).
∗ Correspondingauthorat:ClinicalChemistryLaboratory,PapaGiovanniXXIIIHospital,SquareOMS,1-24127Bergamo,Italy.
E-mailaddress:[email protected](S.Buoro).
http://dx.doi.org/10.1016/j.bjhh.2016.05.010
226
revbrashematolhemoter.2016;38(3):225–239Introduction
Modern hematological analyzers not only enable accurate quantitativeandqualitativeassessmentofbloodcells,butalso provideavastarrayofhematologicalparametersthatmaybe usefulforthediagnosticandprognosticassessmentofmany bloodcelldisorders.Thevastmajorityoflaboratoryerrors(up to70%)emergefromthepre-analyticalphase.1Thisphaseis
influencedbyanumberofvariables,includingthepreparation ofthepatientbeforetesting,theproceduresusedtocollect andtransportthebiologicalspecimens,aswell asthetime andstorageconditionsofbloodsamplesbeforeanalysis.In particular,itwasrecentlyproventhatthestabilityofmany hematologicalparametersisstronglyinfluencedbythe stor-agetemperatureofthesampleandthetimeelapsedbetween collectionandanalysis.2–4
Anotherfactorthatmayhaveaninfluenceonthe stabil-ityofhematologicalparametersisthetechnologyusedbythe differenthematologicalanalyzers.3Basically,theinstruments
currentlyavailableonthemarketusedifferentmethodsand technologies toassess basicparameters such asred blood cell (RBC), platelet (PLT), total leukocyte (WBC) and leuko-cytesubclass[neutrophils(NE),lymphocytes(LY),monocytes (MO),eosinophils(EO),basophils(BA)]counts.5Itisforthis
reason that a more profound knowledge of the potential impactoftime and storagetemperatureofsamples before analysisshould be regarded asa mainstaytoincrease the qualityofhematologicaltestingandtoimprovetheclinical interpretationofdataobtainedwithdifferentanalyzersand techniques.2–4Notably,thelatestgenerationofhematological
analyzersprovidesanumberofinnovativequantitativeand qualitativeparameters,suchastheenumerationofhigh fluo-rescencemononuclearcells(HFC)5–7andnucleatedredblood
cell(NRBC)count,7andtheRBCdistributionwidthexpressed
asastandarddeviation(RDW-SD)orcoefficientofvariation (RDW-CV).8Moreover,theymayprovideplateletdistribution
width(PDW),plateletcrit(PCT),meanplateletvolume(MPV), percentage of large platelet (P-LCR) parameters,5,9,10 along
withthereticulocytecount(RET)andimmaturereticulocyte fractions[IRF, high-fluorescence (HFR), middle-fluorescence (MFR)andlow-fluorescencereticulocytes(LFR)],allofwhich areusefulforthediagnosisandclassificationofanemiaorfor monitoringbonemarrowerythropoiesis.11,12
Theimportanceofverifyingthestabilityofthe aforemen-tionedparametersisnowunquestionableandpublisheddata aboutbloodsamplestabilitybeforeanalysisisscarceforthe newgeneration ofhematological analyzers.Therefore, this studyaimedtoassessandcomparethe stabilityofa num-ber of hematological parameters in normal and abnormal bloodsamplesmeasuredusingtwonovelanalyzers,XN-9000 (SysmexCo.,Kobe,Japan)andBC-6800(Mindray,Shenzhen, China),accordingtotheGuidelinesoftheInternational Coun-cilforStandardizationofHaematology(ICSH)4andtheClinical
andLaboratoryStandardsInstitute(CLSI)DocumentH26-P2.13
Bloodsamples
The study population consisted of ten adult and osten-sibly healthy volunteers recruited from the laboratory
staff (five women, mean age 37.5±0.8 years and five males, mean age 35.0±7.4 years). All subjects were Cau-casian,hadnodiabetesmellitus,hypertensionandhadnot taken any medication for onemonthbefore the study.Six venous blood samplesfrom each subjectwere collected in K3-ethylenediaminetetraaceticacid(K3-EDTA)tubes(Becton
Dickinson, Franklin Lakes, NJ). All samples were analyzed immediatelyaftervenipuncture(i.e.,within30min).The anal-ysisoftheimpactofdifferentstoragetemperatureswasthen carriedoutbystoringthreebloodtubesfromeachindividualat roomtemperature(RT)andthreebloodtubesweredividedin sixaliquotsandstored(refrigerated)at4◦C.Repeated
meas-ureswerethenperformedoneachsampleafter2h,4h,6h, 8h,24h,36hand48hofstorage.Anadditionalstudywas per-formedusing40routinesampleswithabnormalvalues,that is, containingatleastoneabnormalityofhemoglobin(Hb), platelet(PLT)orwhitebloodcell(WBC)countsor morpholog-icalalterations(i.e.,atleastonemorphologicalflagforWBC). CountabnormalitiesincludedHblowerthan70g/dL,PLTlower than100×109/Lorhigherthan400×109/L;WBClowerthan
1.00×10⁹/Lorhigherthan12.00×109/L.Hematological
test-ingwasperformedimmediatelyuponarrivalinthelaboratory (i.e.,within30min)andtheneachsamplewasdividedinto8 aliquots,fourwerestoredat4◦CandfourwerestoredatRT.
Thetestswererepeatedafter4h,8h,24h36hand48hof stor-age.Allmeasures(i.e.,thebaselineandtherepeatedanalyses) wereperformedinduplicateandthefinalvaluewasexpressed asthemeanofthetwoanalysesateachtimepoint.
Studydesign
Thefollowingparameterswereassessedtocheckblood sam-ple stability: extended complete blood count (CBC) profile parameters, including all basic CBC parameters [RBC, Hb, hematocrit(HT)],meancorpuscularvolume(MCV),mean cor-puscularhemoglobin(MCH), mean corpuscularhemoglobin concentration (MCHC),RDW-SD, RDW-CVand NRBC. More-over,theextendeddifferentialcounts(DIFF)(includingWBC, NE,LY,MO,EO,BAandHFC),PLTprofileparameters(including PLT,PCT,MPV,PDWandP-LCR)andtheRETprofile(including RET,IRF,LFR,MFRandHFR)wereevaluated.
Themeasurementsatthedifferenttimepointswere con-comitantly performed withboth the XN-9000 and BC-6800 analyzers. The mean analytical characteristics of the two analyzers are summarized in Table 1. Briefly, the XN-9000 andtheBC-6000analyzersperforma5-partDIFF,RETcount, NRBCcount,withflagsappearinginthepresenceofabnormal results.7,14,15Bothanalyzersuseacombinationofflow
cytom-etryandfluorescencewithlysingbuffersforleukocyteDIFF andidentification ofabnormalcells.Aseparatechannelfor NRBCassessmentisalsoavailableintheBC-6800.
The between-run imprecision ofboth the XN-9000 and BC-6800wasevaluatedaccordingtotheCLSIdocument EP5-A3,16 byanalysisinduplicateofthreelevels(i.e., level1,2
revbrashematolhemoter.2016;38(3):225–239
227
Table1–XN-9000andBC-6800parameterswithoptimalperformanceBias%andCriticalDifference%(CD).
Parameters XN-9000 BC-6800 Optimal
performance Bias%
Critical Difference% onXN-9000
Critical Difference%on
BC-6800
Redbloodcell RBC RBC 0.9 9.1 9.3
Hemoglobin HGB HGB 0.9 7.9 8.1
Hematocrit HCT HCT 0.9 8.4 9.5
Meanvolume,redbloodcells MCV MCV 0.6 4.2 5.3
Meancorpuscularhemoglobin MCH MCH 0.7 5.0 5.4
Meancorpuscularhemoglobinconcentration MCHC MCHC 0.4 5.8 6.7
RBCdistributionwidth RDW-CV RDW-CV 0.9 9.8 9.9
RDW-SD RDW-SD NA NA NA
Nucleatedredbloodcell NRBC NRBC NA NA NA
Whitebloodcells WBC WBC 2.8 30.5 30.6
Neutrophil NEUT Neu 4.6 45.4 45.2
Lymphocyte LYMPH Lym 3.7 30.2 30.4
Monocyte MONO Mon 6.6 53.7 57.4
Eosinophil EO Eos 9.9 62.0 58.9
Basophil BASO Bas 7.7 77.9 88.1
Highfluorescencecells HFLC HFC NA NA NA
Platelet PLT PLT 3.0 26.1 26.2
Meanvolumeplatelet MPV MPV 1.2 12.3 12.6
PLTdistributionwidth PDW PDW NA NA NA
Plateletcrit PCT PCT NA NA NA
PLTlargercellratio P-LCR P-LCR NA NA NA
Reticulocyte RET RET 3.9 31.7 31.1
Immaturereticulocytefraction IRF IRF NA NA NA
Low-fluorescencereticulocyte LFR LFR NA NA NA
Medium-fluorescencereticulocyte MFR MFR NA NA NA
High-fluorescencereticulocyte HFR HFR NA NA NA
NA:notavailable.
relevantlocallegislationandwithpriorapprovaloftheLocal
EthicsCommittee.
Statisticalanalysis
Thesignificanceofthedifferenceoftheparametersobtained
in paired samples measured with the two analyzers was
estimated according to the Steel–Dwass–Critchlow–Fligner
test,withassessmentbytheHodges–Lehmannlocationshift
formultiple comparisons of means and medians between
differentgroups,afterverificationofvaluedistributionbythe
Shapiro–Wilktest.Statisticalsignificancewassetforp-values
<0.05. The results were then reported as delta variations
from baselineanalysis immediately aftercollection, asX
(TX−T0), where “X” isthe different timing and “0” is the
baselineresult.Percentagevariationsfromthebaselineresult
(T0)insampleswithstatisticallysignificantdifferenceswere
then analyzedusing Bland–Altmanplots (Bias%)and
com-paredwiththecurrentqualityspecificationsforoptimalbias
(OP-Bias%),17thatiscalculatedusingintra-individual
biolog-icalvariability(CVi)andinter-individualbiologicalvariability (CVg)followingtheequation:OP-Bias%=0.250(CVi+CVg)1/2.
Bias%wasalsocomparedwiththereferencechangevalues orcriticaldifference(CD)18,19whentheseindiceswere
avail-able. The CD percentage is the highest relative difference betweentwo consecutive measurements,that, ata chosen levelofprobability, maystillbeduetothecombinedeffect oftheanalytical(Va)andbiological(Vi)variations.Itisgiven bythe followingequation: CD%=K×(Va2+Vi2)1/2, where K
dependsonthechosenprobability.Thecomparisonbetween Bias% and CD% was performed only forthose parameters exhibitingastatisticallysignificantdifferencebetweenBias% and OP-Bias% throughoutthe study period. The statistical analysis was performed using Analyse-it software version 3.90.1(Analyse-itSoftwareLtd.;Leeds,UK).
Results
Overall, 2480measurements were performed withthe XN-9000andBC-6800analyzers.Allresultsobtainedinthenormal samples group were included in the statistical analysis, whereas160measurementswereperformedintheabnormal samplesgroup. Unfortunately,severalmeasurements could notbeperformedduetothelowresidualsamplevolumein this second groupofsamples. Theresultsofthese studies andtherelativevariationsaccordingtothedifferentstorage conditionsareshowninTables2–5.
Redbloodcellparameters
Themedianvaluesobtainedatbaseline(i.e.,T0)inthenormal sample group did not significantly differ between the two analyzersforalltheparameterstested,exceptforMCHand MCHC(Table2).Inthisgroupofnormalsamples,thevalues ofWBC,RBC,HB,MCHandNRBCwerefoundtobestableup to48hatRTand4◦Cusingbothanalyzers.Conversely,theHT
228
rev
bras
hema
tol
hemoter.
2
0
1
6;
3
8(3)
:225–239
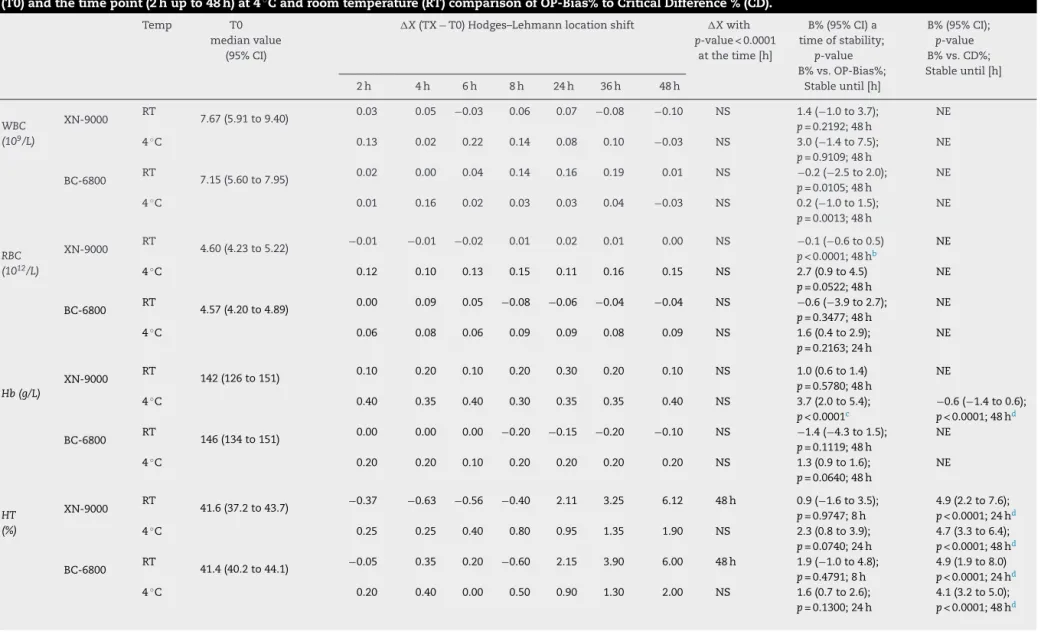
Table2–SamplesstabilityofgroupofnormalsamplesforCBCandRETprofilesparameters.MedianHodges–Lehmannlocationshift(X);Bias%(B%)betweenbaseline (T0)andthetimepoint(2hupto48h)at4◦Candroomtemperature(RT)comparisonofOP-Bias%toCriticalDifference%(CD).
Temp T0
medianvalue (95%CI)
X(TX−T0)Hodges–Lehmannlocationshift Xwith
p-value<0.0001 atthetime[h]
B%(95%CI)a timeofstability;
p-value B%vs.OP-Bias%;
Stableuntil[h]
B%(95%CI);
p-value B%vs.CD%; Stableuntil[h] 2h 4h 6h 8h 24h 36h 48h
WBC (109/L)
XN-9000 RT 7.67(5.91to9.40) 0.03 0.05 −0.03 0.06 0.07 −0.08 −0.10 NS 1.4(−1.0to3.7);
p=0.2192;48h
NE
4◦C 0.13 0.02 0.22 0.14 0.08 0.10 −0.03 NS 3.0(−1.4to7.5);
p=0.9109;48h
NE
BC-6800 RT 7.15(5.60to7.95) 0.02 0.00 0.04 0.14 0.16 0.19 0.01 NS −0.2(−2.5to2.0);
p=0.0105;48h
NE
4◦C 0.01 0.16 0.02 0.03 0.03 0.04 −0.03 NS 0.2(−1.0to1.5);
p=0.0013;48h
NE
RBC (1012/L)
XN-9000 RT 4.60(4.23to5.22) −0.01 −0.01 −0.02 0.01 0.02 0.01 0.00 NS −0.1(−0.6to0.5)
p<0.0001;48hb
NE
4◦C 0.12 0.10 0.13 0.15 0.11 0.16 0.15 NS 2.7(0.9to4.5)
p=0.0522;48h
NE
BC-6800 RT 4.57(4.20to4.89) 0.00 0.09 0.05 −0.08 −0.06 −0.04 −0.04 NS −0.6(−3.9to2.7);
p=0.3477;48h
NE
4◦C 0.06 0.08 0.06 0.09 0.09 0.08 0.09 NS 1.6(0.4to2.9);
p=0.2163;24h
NE
Hb(g/L)
XN-9000 RT 142(126to151) 0.10 0.20 0.10 0.20 0.30 0.20 0.10 NS 1.0(0.6to1.4)
p=0.5780;48h
NE
4◦C 0.40 0.35 0.40 0.30 0.35 0.35 0.40 NS 3.7(2.0to5.4);
p<0.0001c
−0.6(−1.4to0.6); p<0.0001;48hd
BC-6800 RT 146(134to151) 0.00 0.00 0.00 −0.20 −0.15 −0.20 −0.10 NS −1.4(−4.3to1.5);
p=0.1119;48h
NE
4◦C 0.20 0.20 0.10 0.20 0.20 0.20 0.20 NS 1.3(0.9to1.6);
p=0.0640;48h
NE
HT (%)
XN-9000 RT 41.6(37.2to43.7) −0.37 −0.63 −0.56 −0.40 2.11 3.25 6.12 48h 0.9(−1.6to3.5);
p=0.9747;8h
4.9(2.2to7.6); p<0.0001;24hd
4◦C 0.25 0.25 0.40 0.80 0.95 1.35 1.90 NS 2.3(0.8to3.9);
p=0.0740;24h
4.7(3.3to6.4); p<0.0001;48hd
BC-6800 RT 41.4(40.2to44.1) −0.05 0.35 0.20 −0.60 2.15 3.90 6.00 48h 1.9(−1.0to4.8);
p=0.4791;8h
4.9(1.9to8.0) p<0.0001;24hd
4◦C 0.20 0.40 0.00 0.50 0.90 1.30 2.00 NS 1.6(0.7to2.6);
p=0.1300;24h
rev
bras
hema
tol
hemoter.
2
0
1
6;
3
8(3)
:225–239
229
Table2–(Continued)
Temp T0
medianvalue (95%CI)
X(TX−T0)Hodges–Lehmannlocationshift Xwith
p-value<0.0001 atthetime[h]
B%(95%CI)a timeofstability;
p-value B%vs.OP-Bias%;
Stableuntil[h]
B%(95%CI);
p-value B%vs.CD%; Stableuntil[h] 2h 4h 6h 8h 24h 36h 48h
MCV (fL)
XN-9000 RT 87.45(86.2to90.5) −0.42 −1.24 −1.02 −1.27 3.51 6.10 13.1 24h 0.5(0.2to0.7);
p=0.3676;2h
−1.5(−2.1to
−0.8);
p<0.0001;8hd
4◦C −1.25 −1.30 −1.40 −1.00 0.10 0.50 2.00 NS 0.3(−0.2to0.8);
p=0.2932;24h
2.0(1.3to2.7); p<0.0001;48hd
BC-6800 RT 89.8(88.2to92.7) −0.25 −0.45 −0.50 −0.35 5.70 8.80 13.4 24h −0.2(−0.8to0.5);
p=0.1688;8h
−0.2(−0.8to0.5); p<0.0001;8hd
4◦C −1.50 −1.40 −1.55 −1.10 −0.15 0.70 1.55 NS 0.8(0.3to1.4);
p=0.3793;36h
2.1(1.3to2.9); p<0.0001;48hd
MCHa (pg)
XN-9000 RT 30.0(29.0to30.6) 0.30 0.40 0.50 0.40 0.50 0.30 0.30 NS 1.1(0.6to1.6);
p=0.1069;48h
NE
4◦C 0.40 0.40 0.40 0.30 0.20 0.10 0.20 NS 0.6(0.1to1.1);
p=0.7434;48h
NE
BC-6800 RT 31.4(30.7to32.3) −0.20 −0.30 −0.30 −0.30 −0.30 −0.50 −0.30 NS 0.9(0.2to1.6);
p=0.5672;48h
NE
4◦C −0.30 −0.30 −0.10 −0.30 −0.30 −0.30 −0.30 NS 0.8(0.1to1.8);
p=0.8085;48h
NE
MCHCa (g/dL)
XN-9000 RT 34.2(33.4to34.4) 0.60 0.80 1.00 0.90 −0.80 −1.90 −4.20 4h 1.7(1.1to2.6);
p<0.0001c
−2.4(−3.5to −1.3); p<0.0001;8hd
4◦C 1.10 0.90 1.10 0.80 0.40 0.10 −0.50 2h 3.1(2.5to3.7);
p<0.0001c
1.4(0.6to2.2); p<0.0001;48hd
BC-6800 RT 35.6(33.4to36.2) −0.10 −0.30 −0.10 −0.20 −2.30 −3.50 −4.90 24h −0.7(−1.2to−0.2); p=0.2126;8h
−0.7(−1.2to −0.2); p<0.0001;8hd
4◦C 0.20 0.10 0.30 0.00 −0.40 −0.60 −1.10 48h 0.9(0.3to1.4);
p=0.1027;24h
2.9(2.1to3.7); p<0.0001;48hd
RDW-CV (%)
XN-9000 RT 12.9(12.7to13.1) 0.00 0.00 0.10 0.10 0.70 1.20 1.50 24h 0.9(0.4to1.4);
p=0.9785;8h
8.7(7.6to9.8); p<0.0001;48hd
4◦C −0.10 −0.10 −0.10 −0.10 −0.30 −0.30 −0.30 24h 0.9(0.6to1.3);
p=0.8055;8h
2.3(1.4to3.1); p<0.0001;48hd
BC-6800 RT 12.9(12.4to13.2) 0.00 0.20 0.30 0.30 1.20 1.60 1.90 24h 0.5(0.1to0.8);
p<0.0001;2hb
2.7(2.0to3.3); p<0.0001;8hd
4◦C 0.10 0.20 0.20 0.20 −0.10 0.00 −0.10 NS 0.3(−0.3to1.0);
p=0.0912;48h
NE
RDW-SD (fL)
XN-9000 RT 41.4(39.4to43.2) −0.10 −0.70 −0.25 −0.55 4.40 7.00 12.0 24h 10.2(8.6to11.8)
CD%datanot available
4◦C −1.10 −1.20 −1.10 −1.10 −1.20 −1.10 −0.50 NS 0.9(−0.4to2.2)
BC-6800 RT 40.5(39.5to41.5) 0.00 0.50 0.70 0.90 7.15 10.1 12.8 24h 14.9(12.5to17.4)
230
rev
bras
hema
tol
hemoter.
2
0
1
6;
3
8(3)
:225–239
Table2–(Continued)
Temp T0
medianvalue (95%CI)
X(TX−T0)Hodges–Lehmannlocationshift Xwith
p-value<0.0001 atthetime[h]
B%(95%CI)a timeofstability;
p-value B%vs.OP-Bias%;
Stableuntil[h]
B%(95%CI);
p-value B%vs.CD%; Stableuntil[h] 2h 4h 6h 8h 24h 36h 48h
NRBC (109/L)
XN-9000 RT 0.0(0.0to0.0) 0.00 0.00 0.00 0.00 0.00 0.00 0.00 NS 20.0(−31.7to71.7)
4◦C 0.00 0.00 0.00 0.00 0.00 0.00 0.00 NS 0.0(−42.9to42.9)
BC-6800 RT 0.0(0.0to0.0) 0.00 0.00 0.00 0.00 0.00 0.00 0.00 NS 0.0(0.0to0.0)
4◦C 0.00 0.00 0.00 0.00 0.00 0.00 0.00 NS 0.0(0.0to0.0)
RETa (109/L)
XN-9000 RT 48.1(35.1to60.3) 0.63 −0.89 −1.05 −1.50 −3.71 −0.59 −1.77 NS 2.5(−1.5to6.6);
p=0.4964;48h
NE
4◦C 1.01 1.15 0.36 0.08 −0.07 0.27 −0.11 NS 0.3(−3.9to4.4);
p=0.0840;48h
NE
BC-6800 RT 37.4(26.8to44.4) 0.85 1.55 0.30 −1.10 0.45 −1.20 −2.60 NS 6.1(0.3to12.0);
p=0.4344;36h
9.8(4.5to15.1); p<0.0001;48hd
4◦C 0.00 0.50 −1.30 0.25 1.30 1.65 3.45 NS 5.0(1.2to8.8);
p=0.5394;36h
10.7(6.2to15.2); p<0.0001;48hd
IRFa (%)
XN-9000 RT 9.3(6.9to10.3) −0.81 −0.49 −1.08 −1.37 −1.94 −1.85 −2.07 24h −25.1(−38.7to−11.5)
CD%datanot available
4◦C 0.15 −0.98 −0.42 −0.96 −0.64 −0.66 0.45 NS 4.0(−5.3to13.4)
BC-6800 RT 3.4(2.5to4.3) 0.20 0.20 0.20 −0.20 −0.85 −1.35 −2.00 36h −90.2(−110.8to−69.6)
4◦C 0.0 −0.80 −0.60 −0.70 0.10 0.50 0.90 NS 22.1(4.4to39.6)
LFRa (%)
XN-9000 RT 90.7(89.7to93.1) 0.81 0.48 1.08 1.37 1.94 1.85 2.07 24h 2.1(1.0to3.2)
4◦C −0.16 0.98 0.42 0.96 0.64 0.66 −0.45 NS −0.5(−1.4to0.4)
BC-6800 RT 96.5(95.7to97.5) −0.20 −0.20 −0.20 0.20 0.85 1.35 2.00 36h 2.1(1.5to2.7)
4◦C 0.00 0.80 0.60 0.70 −0.10 −0.50 −0.90 NS −0.8(−1.3to−0.2)
MFRa (%)
XN-9000 RT 8.4(6.5to8.9) −0.72 −0.43 −1.02 −1.20 −1.58 −1.70 −1.68 24h −23.7(−37.6to−9.7)
4◦C 0.15 −0.78 −0.48 −0.82 −0.77 −0.66 0.04 NS −0.9(−11.2to9.5)
BC-6800 RT 3.4(2.5to4.3) 0.20 0.20 0.20 −0.20 −0.85 −1.35 −2.00 36h −90.2(−67.9to−35.5)
4◦C 0.00 −0.80 −0.60 −0.70 0.10 0.50 0.90 NS 22.0(4.4to39.7)
HFRa (%)
XN-9000 RT 0.9(0.6to1.3) 0.00 0.00 −0.10 −0.10 −0.30 −0.10 −0.30 NS −51.1(−79.2to−23.0)
4◦C 0.10 −0.15 0.10 −0.10 0.10 0.10 0.40 NS 46.8(21.2to72.4)
BC-6800 RT 0.0(0.0to0.0) 0.00 0.00 0.00 0.00 0.00 0.00 0.00 NS 0.0(0.0to0.0)
4◦C 0.00 0.00 0.00 0.00 0.00 0.00 0.00 NS 0.0(0.0to0.0)
WBC:whitebloodcells;RBC:redbloodcell;RT:Roomtemperature;Hb:hemoglobin;HT:hematocrit;MCV:meancorpuscularvolume;MCH:meancorpuscularhemoglobin;MCHC:meancorpuscular hemoglobinconcentration;RDW-CV:distribution-coefficientofvariation;RDW-SD:RBCdistributionwidth-standarddeviation;NRBC:nucleatedredbloodcell;RET:reticulocyte;IRF:immature reticulocytefraction;LFR:low-fluorescencereticulocyte;MFR:medium-fluorescencereticulocyte;HFR:high-fluorescencereticulocyte;NS:Xnotsignificantthroughoutthestudyperiod;NE:not evaluated;Temp:Temperature.
a ParameterswithmedianvalueaT0significantdifferencebetweentwoanalyzerinthesamesampleswithp<0.0001.
b Bias%(betweenbaselineT0andthetimepointX)islowerthanOP-Bias%.
c Bias%(betweenbaselineT0andthetimepointX)isalwayshigherthanOP-Bias%.
revbrashematolhemoter.2016;38(3):225–239
231
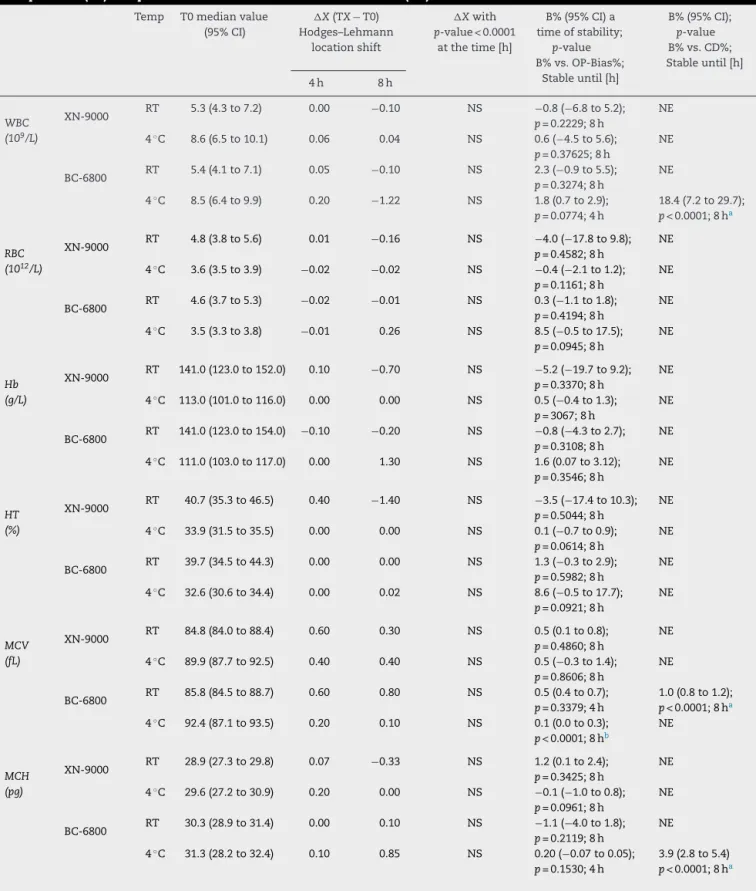
Table3–Samplesstabilityongroupofpathologicalsamplesfor:CBCandRETprofilesparameters.Median
Hodges–Lehmannlocationshift(X);Bias%(B%)betweenbaseline(T0)andthetimepoint(4hupto8h)at4◦Candroom
temperature(RT)comparisonofOP-Bias%toCriticalDifference%(CD).
Temp T0medianvalue (95%CI)
X(TX−T0) Hodges–Lehmann
locationshift
Xwith
p-value<0.0001 atthetime[h]
B%(95%CI)a timeofstability;
p-value B%vs.OP-Bias%;
Stableuntil[h]
B%(95%CI);
p-value B%vs.CD%; Stableuntil[h]
4h 8h
WBC (109/L)
XN-9000 RT 5.3(4.3to7.2) 0.00 −0.10 NS −0.8(−6.8to5.2);
p=0.2229;8h
NE
4◦C 8.6(6.5to10.1) 0.06 0.04 NS 0.6(−4.5to5.6); p=0.37625;8h
NE
BC-6800 RT 5.4(4.1to7.1) 0.05 −0.10 NS 2.3(−0.9to5.5);
p=0.3274;8h
NE
4◦C 8.5(6.4to9.9) 0.20 −1.22 NS 1.8(0.7to2.9); p=0.0774;4h
18.4(7.2to29.7);
p<0.0001;8ha
RBC (1012/L)
XN-9000 RT 4.8(3.8to5.6) 0.01 −0.16 NS −4.0(−17.8to9.8);
p=0.4582;8h
NE
4◦C 3.6(3.5to3.9) −0.02 −0.02 NS −0.4(−2.1to1.2); p=0.1161;8h
NE
BC-6800 RT 4.6(3.7to5.3) −0.02 −0.01 NS 0.3(−1.1to1.8);
p=0.4194;8h
NE
4◦C 3.5(3.3to3.8) −0.01 0.26 NS 8.5(−0.5to17.5);
p=0.0945;8h
NE
Hb (g/L)
XN-9000 RT 141.0(123.0to152.0) 0.10 −0.70 NS −5.2(−19.7to9.2); p=0.3370;8h
NE
4◦C 113.0(101.0to116.0) 0.00 0.00 NS 0.5(−0.4to1.3); p=3067;8h
NE
BC-6800 RT 141.0(123.0to154.0) −0.10 −0.20 NS −0.8(−4.3to2.7); p=0.3108;8h
NE
4◦C 111.0(103.0to117.0) 0.00 1.30 NS 1.6(0.07to3.12); p=0.3546;8h
NE
HT (%)
XN-9000 RT 40.7(35.3to46.5) 0.40 −1.40 NS −3.5(−17.4to10.3);
p=0.5044;8h
NE
4◦C 33.9(31.5to35.5) 0.00 0.00 NS 0.1(−0.7to0.9);
p=0.0614;8h
NE
BC-6800 RT 39.7(34.5to44.3) 0.00 0.00 NS 1.3(−0.3to2.9);
p=0.5982;8h
NE
4◦C 32.6(30.6to34.4) 0.00 0.02 NS 8.6(−0.5to17.7);
p=0.0921;8h
NE
MCV (fL)
XN-9000 RT 84.8(84.0to88.4) 0.60 0.30 NS 0.5(0.1to0.8);
p=0.4860;8h
NE
4◦C 89.9(87.7to92.5) 0.40 0.40 NS 0.5(−0.3to1.4);
p=0.8606;8h
NE
BC-6800 RT 85.8(84.5to88.7) 0.60 0.80 NS 0.5(0.4to0.7);
p=0.3379;4h
1.0(0.8to1.2); p<0.0001;8ha
4◦C 92.4(87.1to93.5) 0.20 0.10 NS 0.1(0.0to0.3);
p<0.0001;8hb
NE
MCH (pg)
XN-9000 RT 28.9(27.3to29.8) 0.07 −0.33 NS 1.2(0.1to2.4);
p=0.3425;8h
NE
4◦C 29.6(27.2to30.9) 0.20 0.00 NS −0.1(−1.0to0.8); p=0.0961;8h
NE
BC-6800 RT 30.3(28.9to31.4) 0.00 0.10 NS −1.1(−4.0to1.8);
p=0.2119;8h
NE
4◦C 31.3(28.2to32.4) 0.10 0.85 NS 0.20(−0.07to0.05); p=0.1530;4h
232
revbrashematolhemoter.2016;38(3):225–239Table3–(Continued)
Temp T0medianvalue (95%CI)
X(TX−T0) Hodges–Lehmann
locationshift
Xwith
p-value<0.0001 atthetime[h]
B%(95%CI)a timeofstability;
p-value B%vs.OP-Bias%;
Stableuntil[h]
B%(95%CI);
p-value B%vs.CD%; Stableuntil[h]
4h 8h
MCHC (g/dL)
XN-9000 RT 33.6(32.5to34.5) −0.10 −0.60 NS 0.5(−0.3to1.2);
p=0.8634;4h
NE
4◦C 32.9(32.4to33.5) 0.02 −0.20 NS 0.6(0.3to0.9); p=0.1932;8h
NE
BC-6800 RT 35.3(34.7to35.6) −0.35 −0.40 NS −2.1(−5.0to0.8);
p=0.812;8h
NE
4◦C 34.1(33.7to34.3) 0.10 0.85 8h 0.0(−0.3to0.3); p<0.0001b;4h
3.8(1.6to6.1); p<0.0001;8ha
RDW-CV (%)
XN-9000 RT 13.3(13.1to15.9) 0.20 0.35 NS 2.8(−9.7to15.4);
p<0.7469;8h
NE
4◦C 14.2(13.4to14.6) 0.10 0.10 NS 0.7(0.1to1.2);
p=0.4190;8h
NE
BC-6800 RT 13.4(13.0to15.6) 0.30 0.50 NS 2.1(1.8to2.4);
p<0.0001c
3.6(2.9to4.2); p<0.0001;8ha
4◦C 13.7(13.4to14.1) 0.10 0.25 NS 0.9(0.5to1.2);
p=0.9609;4h
2.1(1.2to2.9); p<0.0001;8ha
RDW-SD (fL)
XN-9000 RT 42.3(41.1to44.3) 1.00 1.85 NS p3.6=0.6544;(−9.0to816.2);h
CD%datanot available
4◦C 44.2(43.1to48.4) 0.50 0.60 NS 1.2(−0.2to2.5);
p=0.6629;8h
BC-6800 RT 41.5(40.3to43.3) 1.20 2.00 8h 4.3(3.6to5.1)
4◦C 42.7(41.9to47.8) 0.40 0.90 NS 2.0(1.0to2.9)
NRBC (109/L)
XN-9000 RT 0.0(0.0to0.0) 0.00 0.01 8h 103.3(41.9to164.8)
4◦C 0.0(0.0to0.0) 0.01 0.02 4h 129.9(95.5to164.4)
BC-6800 RT 0.0(0.0to0.0) 0.00 0.00 NS 78.6(26.4to130.8)
4◦C 0.0(0.0to0.0) 0.00 0.02 8h 124.0(78.5to169.6)
RET (109/L)
XN-9000 RT 53.1(46.3to72.1) 0.11 −3.39 NS −4.4(−24.8to16.1);
p=0.3996;8h
NE
4◦C 54.0(46.0to68.1) 1.20 1.50 NS 3.0(−0.1to6.1);
p=0.5427;8h
NE
BC-6800 RT 41.5(31.9to55.2) 2.30 3.55 NS 7.3(3.3to11.4);
p=0.0912;8h
NE
4◦C 52.2(41.1to60.1) 1.14 3.45 NS 5.4(−5.2to16.0);
p=0.7652;8h
NE
IRF (%)
XN-9000 RT 6.6(4.1to7.9) 0.00 0.60 NS 6.1(−28.3to40.5)
CD%datanot available 4◦C 15.5(11.5to20.5) 0.20 0.10 NS −0.1(−6.5to6.3)
BC-6800 RT 1.7(0.9to2.5) −0.20 −0.30 NS −8.5(−28.5to11.5)
4◦C 8.4(5.0to12.9) −0.60 −0.80 NS −21.5(−44.7to1.7)
LFR (%)
XN-9000 RT 93.4(92.1to95.9) 0.00 −0.60 NS −0.7(−6.5to5.0)
4◦C 84.6(79.5to88.5) −0.20 −0.10 NS −0.7(−2.6to1.1)
BC-6800 RT 98.3(97.5to99.1) 0.20 0.30 NS 0.1(−0.5to0.6)
4◦C 91.7(87.1to95.0) 0.60 0.80 NS 0.7(0.2to1.2)
MFR (%)
XN-9000 RT 6.1(4.0to6.9) 0.15 0.60 NS 6.8(−22.5to36.2)
4◦C 12.0(10.6to13.8) −0.55 −0.40 NS −5.6(−10.7to−0.5)
BC-6800 RT 1.7(0.9to2.5) −0.20 −0.30 NS −8.9(−28.9to11.1)
4◦C 8.0(5.0to11.6) −0.30 −0.60 NS −18.9(−42.5to4.8)
HFR (%)
XN-9000 RT 0.5(0.1to1.0) 0.00 0.00 NS 6.9(−56.2to70.0)
4◦C 2.8(1.4to7.9) 0.40 0.30 NS 19.0(−2.1to40.1)
BC-6800 RT4◦C 0.00.0(0.0(0.0toto0.0)1.2) 0.000.00 0.000.00 NSNS 2.6(−1.7to6.9) −38.8(−70.2to−7.4)
WBC:whitebloodcells;RBC:redbloodcell;RT:Roomtemperature;Hb:hemoglobin;HT:hematocrit;MCV:meancorpuscularvolume;MCH: meancorpuscularhemoglobin;MCHC:meancorpuscularhemoglobinconcentration;RDW-CV:distribution-coefficientofvariation;RDW-SD: RBCdistributionwidth-standarddeviation;NRBC:nucleatedredbloodcell;RET:reticulocyte;IRF:immaturereticulocytefraction;LFR: low-fluorescencereticulocyte;MFR:medium-fluorescencereticulocyte;HFR:high-fluorescencereticulocyte;NS:Xnotsignificantthroughoutthe studyperiod;NE:notevaluated;Temp:Temperature.
a Bias%(betweenbaselineT0andthetimepointX)islowerthanCD%.
b Bias%(betweenbaselineT0andthetimepointX)islowerthanOP-Bias%.
rev
bras
hema
tol
hemoter.
2
0
1
6;
3
8(3)
:225–239
233
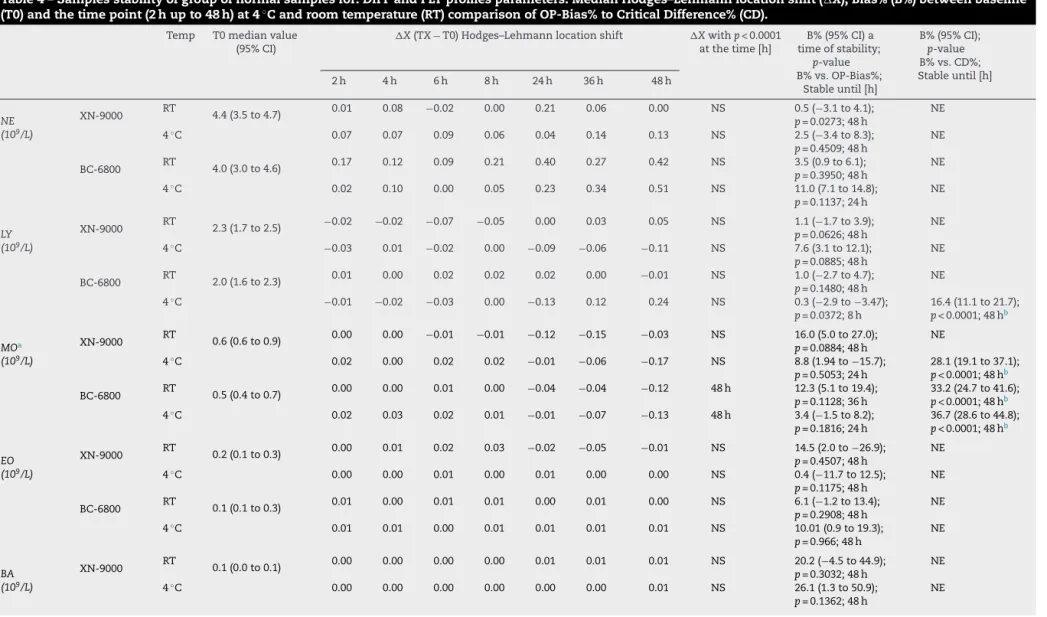
Table4–Samplesstabilityofgroupofnormalsamplesfor:DIFFandPLTprofilesparameters.MedianHodges–Lehmannlocationshift(X);Bias%(B%)betweenbaseline (T0)andthetimepoint(2hupto48h)at4◦Candroomtemperature(RT)comparisonofOP-Bias%toCriticalDifference%(CD).
Temp T0medianvalue (95%CI)
X(TX−T0)Hodges–Lehmannlocationshift Xwithp<0.0001 atthetime[h]
B%(95%CI)a timeofstability;
p-value B%vs.OP-Bias%;
Stableuntil[h]
B%(95%CI);
p-value B%vs.CD%; Stableuntil[h]
2h 4h 6h 8h 24h 36h 48h
NE (109/L)
XN-9000 RT 4.4(3.5to4.7) 0.01 0.08 −0.02 0.00 0.21 0.06 0.00 NS 0.5p=0.0273;(−3.1to484.1);h NE
4◦C 0.07 0.07 0.09 0.06 0.04 0.14 0.13 NS 2.5(−3.4to8.3);
p=0.4509;48h
NE
BC-6800 RT 4.0(3.0to4.6) 0.17 0.12 0.09 0.21 0.40 0.27 0.42 NS 3.5(0.9to6.1);
p=0.3950;48h
NE
4◦C 0.02 0.10 0.00 0.05 0.23 0.34 0.51 NS 11.0(7.1to14.8);
p=0.1137;24h
NE
LY (109/L)
XN-9000 RT 2.3(1.7to2.5) −0.02 −0.02 −0.07 −0.05 0.00 0.03 0.05 NS 1.1(−1.7to3.9);
p=0.0626;48h
NE
4◦C −0.03 0.01 −0.02 0.00 −0.09 −0.06 −0.11 NS 7.6(3.1to12.1); p=0.0885;48h
NE
BC-6800 RT 2.0(1.6to2.3) 0.01 0.00 0.02 0.02 0.02 0.00 −0.01 NS 1.0(−2.7to4.7);
p=0.1480;48h
NE
4◦C −0.01 −0.02 −0.03 0.00 −0.13 0.12 0.24 NS 0.3(−2.9to−3.47); p=0.0372;8h
16.4(11.1to21.7);
p<0.0001;48hb
MOa (109/L)
XN-9000 RT 0.6(0.6to0.9) 0.00 0.00 −0.01 −0.01 −0.12 −0.15 −0.03 NS 16.0(5.0to27.0);
p=0.0884;48h
NE
4◦C 0.02 0.00 0.02 0.02 −0.01 −0.06 −0.17 NS 8.8(1.94to−15.7);
p=0.5053;24h
28.1(19.1to37.1); p<0.0001;48hb
BC-6800 RT 0.5(0.4to0.7) 0.00 0.00 0.01 0.00 −0.04 −0.04 −0.12 48h 12.3(5.1to19.4);
p=0.1128;36h
33.2(24.7to41.6); p<0.0001;48hb
4◦C 0.02 0.03 0.02 0.01 −0.01 −0.07 −0.13 48h 3.4(−1.5to8.2);
p=0.1816;24h
36.7(28.6to44.8); p<0.0001;48hb
EO (109/L)
XN-9000 RT 0.2(0.1to0.3) 0.00 0.01 0.02 0.03 −0.02 −0.05 −0.01 NS 14.5(2.0to−26.9);
p=0.4507;48h
NE
4◦C 0.00 0.00 0.01 0.00 0.01 0.00 0.00 NS 0.4(−11.7to12.5);
p=0.1175;48h
NE
BC-6800 RT 0.1(0.1to0.3) 0.01 0.00 0.01 0.01 0.00 0.01 0.00 NS p6.1=0.2908;(−1.2to4813.4);h NE
4◦C 0.01 0.01 0.00 0.01 0.01 0.01 0.01 NS 10.01(0.9to19.3);
p=0.966;48h
NE
BA (109/L)
XN-9000 RT 0.1(0.0to0.1) 0.00 0.00 0.00 0.00 0.01 0.01 0.01 NS 20.2(−4.5to44.9);
p=0.3032;48h
NE
4◦C 0.00 0.00 0.00 0.00 0.00 0.00 0.01 NS 26.1(1.3to50.9);
p=0.1362;48h
234
rev
bras
hema
tol
hemoter.
2
0
1
6;
3
8(3)
:225–239
Table4–(Continued)
Temp T0medianvalue (95%CI)
X(TX−T0)Hodges–Lehmannlocationshift Xwithp<0.0001 atthetime[h]
B%(95%CI)a timeofstability;
p-value B%vs.OP-Bias%;
Stableuntil[h]
B%(95%CI);
p-value B%vs.CD%; Stableuntil[h] 2h 4h 6h 8h 24h 36h 48h
BC-6800 RT 0.0(0.0to0.0) 0.00 0.00 0.00 0.00 0.00 0.00 0.00 NS p3.8=0.5552;(−9.9to4817.4);h NE
4◦C 0.00 0.00 0.00 0.00 0.00 0.00 0.00 NS 10.5(−10.8to30.9); p=0.7777;48h
NE
HFC (109/L)
XN-9000 RT 0.0(0.0to0.0) 0.00 0.00 0.00 0.00 −0.01 −0.01 −0.01 NS −88.3(−134.8to−41.9)
CD%datanot available 4◦C 0.00 0.00 0.00 0.00 0.00 0.00 0.00 NS −26.7(−73.9to20.6)
BC-6800 RT 0.0(0.0to0.0) 0.00 0.00 0.00 0.00 0.00 0.00 0.00 NS −28.7(−84.4to27.1) 4◦C 0.00 0.00 0.00 0.00 0.00 0.00 0.00 NS −58.0(−112.1to−3.9)
PLT (109/L)
XN-9000 RT 262.0299.0)(231.0to −1.0 3.0 −3.0 −1.0 −19.0 −15.0 −10.0 NS 5.2p=0.1847;(1.9to8.5);48h NE
4◦C −14.5 −16.5 −20.5 −19.0 −21.0 −19.5 −23.0 NS 6.0(4.0to8.0); p<0.0001c
9.5(6.1to12.8); p<0.0001;48hb
BC-6800 RT 250.0279.0)(227.0to 9.0 7.0 12.0 6.5 3.0 7.0 5.0 NS 4.0p=0.0045;(1.2to6.8);48h NE
4◦C 4.0 3.0 4.0 −1.0 −3.0 −2.0 −5.0 NS −0.6(−2.9to1.7);
p=0.4497;48h
NE
MPVa(fL) XN-9000
RT
10.8(10.2to11.3) 0.40 0.50 0.60 0.60 1.30 1.50 0.90 24h 3.7(2.9to4.5);p<0.0001c 9.2(6.9to1.0); p<0.0001;48hb
4◦C 0.00 −0.10 0.20 0.10 0.50 0.60 0.90 48h 0.8(−0.4to1.5);
p=0.1719.8h
5.7(4.3to7.0); p<0.0001;48hb
BC-6800 RT 9.5(9.1to9.9) 0.60 0.80 1.00 0.80 0.80 0.80 1.10 4h 6.1(4.9to7.2);p<0.0001c 8.8p<0.05;(5.7to2411.9);hb
4◦C 0.60 0.50 0.70 0.60 0.90 1.00 1.20 24h 1.3(1.1to1.4);
p=0.5307;48h
1.3(1.1to1.4); p<0.0001;48hb
PDWa (fL)
XN-9000 RT 12.5(11.8to14.0) 0.70 0.90 1.00 0.90 1.30 3.40 2.05 24h 19.7(14.7to24.3)
CD%datanot available
4◦C 0.20 −0.20 0.40 0.00 1.00 1.30 2.00 48h 13.7(10.9to16.4)
BC-6800 RT4◦C 11.30)10.95(10.40to 0.801.00 1.100.60 1.251.20 1.101.30 1.601.30 1.201.60 2.101.50 2424hh 1.71.3(1.1(0.5toto2.0)2.3)
PCTa(%) XN-9000
RT
0.28(0.25to0.33) 0.01 0.01 0.01 0.01 0.02 0.03 0.02 NS 7.2(3.9to10.5)
4◦C −0.02 −0.02 0.02 −0.02 −0.01 −0.01 0.00 NS −2.3(−4.8to0.3)
BC-6800 RT4◦C 0.2(0.2to0.3) 0.020.02 0.020.01 0.030.02 0.010.03 0.020.02 0.030.02 0.300.03 NSNS 11.615.4(8.5(10.5toto14.7)20.4)
P-LCRa (%)
XN-9000 RT 32.3(27.4to36.0) 3.65 4.20 5.00 4.45 10.70 12.00 7.40 24h 30.3(23.2to37.3)
4◦C 0.05 −0.70 1.25 0.40 3.55 5.00 6.95 48h 20.1(18.1to22.2)
BC-6800 RT 23.4(19.8to25.5) 3.80 5.00 6.00 5.30 5.05 5.00 6.80 6h 30.1(19.1to41.0)
4◦C 3.95 3.00 4.65 4.20 6.40 6.90 8.25 24h 33.0(28.0to38.0)
NE:neutrophil;LY:lymphocyte;MO:monocyte;RT:Roomtemperature;EO:eosinophil;BA:basophil;HFC:HIGHfluorescencecells;PLT:platelet;MPV:meanvolumeplatelet;PDW:PLTdistributionwidth; PCT:plateletcrit;P-LCR:PLTlargercellratio;NS:Xnotsignificantthroughoutthestudyperiod;NE:notevaluated;Temp:Temperature.
a ParameterswithmedianvalueaT0significantdifferencebetweentwoanalyzerinthesamesampleswithp<0.0001. b Bias%(betweenbaselineT0andthetimepointX)islowerthanCD%.
revbrashematolhemoter.2016;38(3):225–239
235
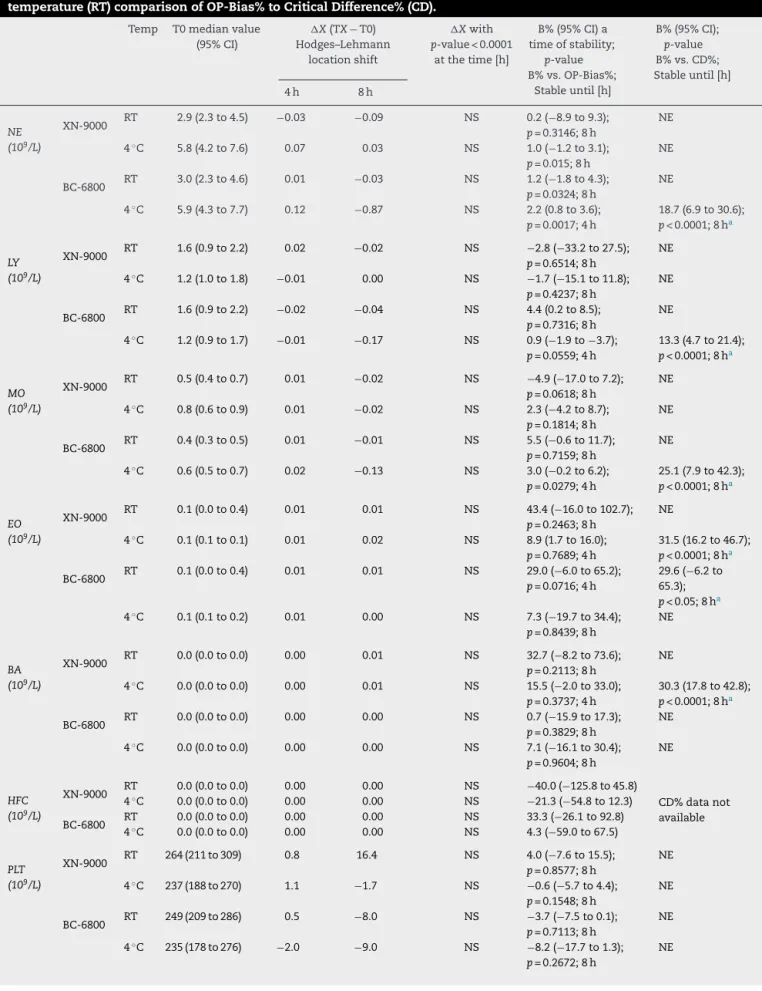
Table5–SamplesstabilityofgroupofpathologicalsamplesforDIFFandPLTprofilesparameters.Median
Hodges–Lehmannlocationshift(X);Bias%(B%)betweenbaseline(T0)andthetimepoint(4hupto8h)at4◦Candroom
temperature(RT)comparisonofOP-Bias%toCriticalDifference%(CD).
Temp T0medianvalue (95%CI)
X(TX−T0) Hodges–Lehmann
locationshift
Xwith
p-value<0.0001 atthetime[h]
B%(95%CI)a timeofstability;
p-value B%vs.OP-Bias%;
Stableuntil[h]
B%(95%CI);
p-value B%vs.CD%; Stableuntil[h]
4h 8h
NE (109/L)
XN-9000 RT 2.9(2.3to4.5) −0.03 −0.09 NS 0.2(−8.9to9.3);
p=0.3146;8h
NE
4◦C 5.8(4.2to7.6) 0.07 0.03 NS 1.0(−1.2to3.1); p=0.015;8h
NE
BC-6800 RT 3.0(2.3to4.6) 0.01 −0.03 NS 1.2(−1.8to4.3);
p=0.0324;8h
NE
4◦C 5.9(4.3to7.7) 0.12 −0.87 NS 2.2(0.8to3.6); p=0.0017;4h
18.7(6.9to30.6);
p<0.0001;8ha
LY (109/L)
XN-9000 RT 1.6(0.9to2.2) 0.02 −0.02 NS −2.8(−33.2to27.5);
p=0.6514;8h
NE
4◦C 1.2(1.0to1.8) −0.01 0.00 NS −1.7(−15.1to11.8);
p=0.4237;8h
NE
BC-6800 RT 1.6(0.9to2.2) −0.02 −0.04 NS 4.4(0.2to8.5);
p=0.7316;8h
NE
4◦C 1.2(0.9to1.7) −0.01 −0.17 NS 0.9(−1.9to−3.7);
p=0.0559;4h
13.3(4.7to21.4); p<0.0001;8ha
MO (109/L)
XN-9000 RT 0.5(0.4to0.7) 0.01 −0.02 NS −4.9(−17.0to7.2);
p=0.0618;8h
NE
4◦C 0.8(0.6to0.9) 0.01 −0.02 NS 2.3(−4.2to8.7);
p=0.1814;8h
NE
BC-6800 RT 0.4(0.3to0.5) 0.01 −0.01 NS 5.5(−0.6to11.7);
p=0.7159;8h
NE
4◦C 0.6(0.5to0.7) 0.02 −0.13 NS 3.0(−0.2to6.2);
p=0.0279;4h
25.1(7.9to42.3); p<0.0001;8ha
EO (109/L)
XN-9000 RT 0.1(0.0to0.4) 0.01 0.01 NS 43.4(−16.0to102.7);
p=0.2463;8h
NE
4◦C 0.1(0.1to0.1) 0.01 0.02 NS 8.9(1.7to16.0);
p=0.7689;4h
31.5(16.2to46.7); p<0.0001;8ha
BC-6800 RT 0.1(0.0to0.4) 0.01 0.01 NS 29.0(−6.0to65.2);
p=0.0716;4h
29.6(−6.2to 65.3); p<0.05;8ha
4◦C 0.1(0.1to0.2) 0.01 0.00 NS 7.3(−19.7to34.4);
p=0.8439;8h
NE
BA (109/L)
XN-9000 RT 0.0(0.0to0.0) 0.00 0.01 NS 32.7(−8.2to73.6);
p=0.2113;8h
NE
4◦C 0.0(0.0to0.0) 0.00 0.01 NS 15.5(−2.0to33.0);
p=0.3737;4h
30.3(17.8to42.8); p<0.0001;8ha
BC-6800 RT 0.0(0.0to0.0) 0.00 0.00 NS 0.7(−15.9to17.3);
p=0.3829;8h
NE
4◦C 0.0(0.0to0.0) 0.00 0.00 NS 7.1(−16.1to30.4);
p=0.9604;8h
NE
HFC (109/L)
XN-9000 RT 0.0(0.0to0.0) 0.00 0.00 NS −40.0(−125.8to45.8)
CD%datanot available
4◦C 0.0(0.0to0.0) 0.00 0.00 NS −21.3(−54.8to12.3)
BC-6800 RT 0.0(0.0to0.0) 0.00 0.00 NS 33.3(−26.1to92.8)
4◦C 0.0(0.0to0.0) 0.00 0.00 NS 4.3(−59.0to67.5)
PLT (109/L)
XN-9000 RT 264(211to309) 0.8 16.4 NS 4.0(−7.6to15.5);
p=0.8577;8h
NE
4◦C 237(188to270) 1.1 −1.7 NS −0.6(−5.7to4.4);
p=0.1548;8h
NE
BC-6800 RT 249(209to286) 0.5 −8.0 NS −3.7(−7.5to0.1);
p=0.7113;8h
NE
4◦C 235(178to276) −2.0 −9.0 NS −8.2(−17.7to1.3);
p=0.2672;8h
236
revbrashematolhemoter.2016;38(3):225–239Table5–(Continued)
Temp T0medianvalue (95%CI)
X(TX−T0) Hodges–Lehmann
locationshift
Xwith
p-value<0.0001 atthetime[h]
B%(95%CI)a timeofstability;
p-value B%vs.OP-Bias%;
Stableuntil[h]
B%(95%CI);
p-value B%vs.CD%; Stableuntil[h]
4h 8h
MPV (fL)
XN-9000 RT 10.7(10.2to11.3) 0.10 0.05 NS 0.3(−4.0to4.6);
p=0.6606;8h
NE
4◦C 11.2(10.6to12.0) 0.11 0.30 NS 1.0(0.3to1.6); p=0.4789;4h
2.6%(1.4to3.8);
p<0.0001;8ha
BC-6800 RT 9.7(8.7to10.2) 0.30 0.40 NS 2.6(1.5to3.7);
p<0.0001b
3.7%(2.7to4.7); p<0.0001;8ha
4◦C 9.9(9.4to10.5) 0.20 0.50 NS 2.7(2.1to3.3);
p<0.0001b
4.7%(3.7to5.9); p<0.0001;8ha
PDW (fL)
XN-9000 RT 13.0(11.3to15.1) 0.29 0.10 NS 0.3(−7.4to8.1)
CD%datanot available
4◦C 13.2(12.2to15.1) 0.20 0.60 NS 4.6(2.1to7.2)
BC-6800 RT 15.9(15.4to16.1) −0.05 0.00 NS 0.0(−0.6to0.5)
4◦C 15.8(15.7to16.1) 0.00 0.00 NS 0.1(−0.5to0.7)
PCT (%)
XN-9000 RT 0.3(0.3to0.3) 0.00 0.01 NS 4.4(−6.1to14.9)
4◦C 0.3(0.2to0.3) 0.00 0.01 NS 2.1(−3.4to7.5)
BC-6800 RT 0.2(0.2to0.2) 0.00 0.00 NS −0.1(−4.0to3.8)
4◦C 0.2(0.2to0.3) 0.00 0.00 NS −4.2(−13.8to5.4)
P-LCR (%)
XN-9000 RT 31.3(25.9to36.5) 1.36 0.72 NS 1.7(−9.7to13.1)
4◦C 34.3(29.4to40.3) 0.74 2.24 NS 6.5(3.7to9.4)
BC-6800 RT 23.8(15.5to29.7) −0.20 −0.30 NS 9.2(6.7to11.7)
4◦C 24.5(21.0to29.4) 1.40 3.95 NS 12.8(8.8to16.7)
NE:neutrophil;RT:Roomtemperature;LY:lymphocyte;MO:monocyte;EO:eosinophil;BA:basophil;HFC:highfluorescencecells;PLT:platelet; MPV:meanvolumeplatelet;PDW:PLTdistributionwidth;PCT:plateletcrit;P-LCR:PLTlargercellratio;NS:Xnotsignificantthroughoutthe studyperiod;NE:notevaluated;Temp:Temperature.
a Bias%(betweenbaselineT0andthetimepointX)islowerthanCD%.
b Bias%(betweenbaselineT0andthetimepointX)isalwayshigherthanOP-Bias%.
collectioninsamplesstoredatRT(butnotinthosestoredat 4◦C)whenmeasuredwithbothanalyzers.Thecomparison
oftheBias%atdifferenttimepoints(TX)withtheOP-Bias% showedthatHTisstableatroomtemperatureforupto8h usingboththeXN-9000(Bias%:0.9)andBC-6800(Bias%:1.9), whereastheBias%forHTinsamplesstoredatRTremained lower than the CD% for up to 24h. The same analysis in samplesstoredat4◦C showedgood stabilityforupto24h
aftercollectionwhencomparedwiththeOP-Bias%,whereas theBias%alwaysremainedlowerthantheCD%throughout thestudyperiod(i.e.,upto48h)usingbothanalyzers.
ThevaluesofMCVandRDW-SDdisplayedsignificant differ-encesafter24hofstorageatRT,whereastheresultsremained substantiallyunchangedforupto48haftercollectionin sam-plesstoreda4◦C.Interestingly,theBias%ofMCVexceeded
theOP-Bias%after2hofstorageatRTwiththeXN-9000and after8hofstorageatRTwiththeBC-6800,respectively.The Bias%ofMCVwaslowerthantherelativeCD%forupto8h ofstorageusingbothanalyzersatRT.Atvariance,theBias% alwaysremainedlowerthanCD%throughoutthestudyperiod insamplesstoredat4◦C.TheRDW-CVexhibitedsignificant
variationsafter24hfromcollectionusingbothanalyzersat RT,whereassignificantdifferenceswereobservedafter24h ofstorageinsamplesstoredat4◦Cusing theXN-9000 but
notwiththeBC-6800(Table2).Whencomparedwiththe OP-Bias%,RDW-CVvalueswerefoundtobestableforupto8h atbothRTand4◦CusingtheXN-9000,andforupto2hat
RTwiththeBC-6800.TheBias%ofRDW-CVwasalwayslower than the OP-Bias%for up to48h ofstorageusing the BC-6800.
Atvariancewithpreviousparameters,thevaluesofMCHC displayed a specific and instrument-dependent variation. Morespecifically,significantdifferenceswereobservedafter 4hofstorageatRTand2hofstorageat4◦CwiththeXN-9000.
Accordingly,theBias%exceededtheOP-Bias%at2hofstorage atbothtemperatures,whereastheBias%didnotexceedthe CD%forupto8hofstorageatRTandforupto48hofstorage at4◦C.AsregardsMCHCvaluesobtainedwiththeBC-6800,
significantdifferenceswerefoundafter24hofstorageatRT andatthe48htimepointafterstorageat4◦C.TheOP-Bias%
wasexceededafter8hofstorageatRTand24hofstorage at4◦C,whereastheBias%remainedlowerthantheCD%for
upto8hofstorageatRTandforupto48hofstorageat4◦C
(Table2).
Alltheseparametersappearedtobesubstantiallystablefor upto8hatbothRTand4◦Cintheabnormalsamplesgroup
usingbothanalyzers.Themostrelevantexceptionsare sum-marizedinTable3.Specifically,theNRBCmeasuredwiththe XN-9000showedsignificantvariations8haftercollectionin samplesstoredatRTand4haftercollectioninthosestored at4◦C,whereassignificantvariationsofNRBCmeasuredwith
theBC-6800couldonlybeobservedafter8hofstorageat4◦C.