Prevalence of alcohol and
drug consumption among
adolescents: data analysis of the
National Survey of School Health
Prevalência do consumo de álcool e
drogas entre adolescentes: análise
dos dados da Pesquisa Nacional de
Saúde Escolar
Deborah Carvalho Malta I
Márcio Dênis Medeiros Mascarenhas II Denise Lopes Porto III
Eliane Aparecida Duarte IV Luciana Monteiro Sardinha V Sandhi Maria Barreto VI
Otaliba Libânio de Morais Neto VII
I General Coordination of Non-Communicable Diseases (CGDANT) of the Health
Surveillance Secretariat (SVS) at the Ministry of Health, Brasília (DF); Nursing School at Universidade Federal de Minas Gerais (UFMG) – Belo Horizonte (MG), Brazil
II CGDANT of the SVS at the Ministry of Health, Brasília (DF); Universidade Federal
do Piauí (UFPI) – Teresina (PI), Brazil
III Department of Health Situation Analysis (DASIS) of the SVS at the Ministry of
Health – Brasília (DF), Brazil
IV CGDANT of the SVS at the Ministry of Health, Brasília (DF), Brazil
V CGDANT of the SVS at the Ministry of Health, Brasília (DF), Brazil
VI Medical School at UFMG – Belo Horizonte (MG), Brazil
VII DASIS of the SVS at the Ministry of Health – Brasília (DF), Brazil
Financial Support: Ministry of Health
Correspondence to: Deborah Carvalho Malta – General Coordination of Non-Communicable
Diseases – Department of Health Situation Analysis – Health Surveillance Secretariat, Ministry of HealthMinistry of Health – SAF Sul, Trecho 2, Lote 5/6, Torre I – Edifício Premium – Room 14 – Ground floor – CEP: 70070-600 – Brasília (DF), Brazil – E-mail: [email protected]
Conflict of interest: nothing to declare.
Abstract
Objective: To describe the prevalence of alcohol and other drugs consumption, among adolescent students. Methods: A cross-sectional study with conglomerate samples of 60,973 students at freshman year high school in public and private schools in capitals and the Federal District in Brazil, in 2009. he 95% conidence interval and prevalence of alcohol and drug consump-tion were analyzed. Results: For the set of surveyed students, the following were identiied: experimenting alcoholic bever-ages (71.4%; 95%CI 70.8-72.0); regular alcoholic beverage consumption (27.3%; 95%CI 26.7-28.0); drunkenness in lifetime (22.1%; 95%CI 21.6-22.7); family is worried when the student gets home drunk (93.8%; 95%CI 93.3-94.2); problems with alcohol use (9.0%; 95%CI 8.6-9.4); consumption of other drugs (8.7%; 95%CI 8.3-9.1). Conclu-sion: he study shows the extension of the alcohol and drugs problem among Brazilian adolescents, with special emphasis on the easy access of students to alcoholic bever-ages at parties, bars, stores, and at homes.
Introduction
Adolescence is a stage of human development which is characterized by biological, cognitive, emotional and social changes that are important for reassuring and consolidating the habits of adult life. In this phase, it is common to experiment psychoactive substances, such as alcohol and illicit drugs. Alcohol use in adolescence is an exposure factor for health problems in the adult age, and it significantly increases the risk of the individual becoming an excessive consumer throughout life1.
Alcohol abuse is associated with negative consequences for the health of the population, since it is one of the main risk factors for vascular diseases, car accidents and homicides, which are the leading causes of death among youngsters2,3. Each year, approximately
5.2 million deaths are caused by accidents and violence all over the world, out of which around 1.8 million are associated with alcohol consumption4.
Alcohol use has proved to be a risk factor for the use of other substances, such as tobacco, illegal drugs, and for the manifestation of conditions like depressive disorders, anxiety, school fights, property damage and police-re-lated problems4. Other studies reported
that alcohol in adolescence is associated with the absence of parental relationship, the fact of studying in public schools, and school failure1,5.
The constant exposure of adoles-cents to alcohol advertisement was also related to alcohol consumption in this age group6,7. Some studies demonstrate
that the lower the socioeconomic status, the higher the risk to consume alcohol in adolescence1. Besides alcohol, other
drugs are important risk factors in this stage of life, since it is a vulnerable period to acquire the habit to consume psycho-active substances4.
Considering the importance of adolescence as a vulnerable stage of life
Resumo
Objetivo: Descrever a prevalência do consumo de álcool e outras drogas entre estudantes adolescentes. Método: Estudo transversal com amostra de conglomera-dos de 60.973 estudantes do nono ano do Ensino Fundamental de escolas públicas e privadas das capitais dos estados brasilei-ros e do Distrito Federal, em 2009. Foram analisadas as prevalências e os intervalos de coniança de 95% (IC95%) do consu-mo de álcool e drogas. Resultados: Para o conjunto dos alunos entrevistados, identi-icou-se o seguinte: experimentação de bebida alcoólica (71,4%; IC95% 70,8-72,0); consumo regular de álcool (27,3%; IC95% 26,7-28,0); embriaguez na vida (22,1%; IC95% 21,6-22,7); preocupação da família se chegasse bêbado em casa (93,8%; IC95% 93,3-94,2); problemas com uso de álcool (9,0%; IC95% 8,6-9,4) e experimenta-ção de outras drogas (8,7%; IC95% 8,3-9,1).
Conclusão: O estudo demonstra a exten-são do problema do uso de álcool e drogas entre adolescentes brasileiros, destacando a facilidade com que os jovens entrevistados tiveram acesso ao álcool em festas, bares, lojas e até em suas próprias casas.
to acquire habits that may last for life, the present study has the objective to describe the prevalence of alcohol use, as well as other drugs among adolescent students enrolled in private and public schools in Brazilian state capitals and the Federal District in 2009.
Methods
The results of the National Survey of School Health (Pesquisa Nacional de Saúde do Escolar – PeNSE) were analyzed, which was conducted by the Brazilian Institute of Geography and Statistics (IBGE) and the Ministry of Health, regarding students of the ninth grade enrolled in public and private schools of state capitals and the Federal District of Brazil in the first semester of 2009.
The conglomerate sample with two stages used data from the School Census 2007. Schools were selected in the first stage, and groups were divided in the second stage by interviews with students8. The sample size was calculated
to estimate proportion (or prevalence) of some characteristics of interest in each geographic stratum (the 27 state capitals and the Federal District), with maximum error of 0.03 (3%) and 95% confidence interval (95%CI). Details on the survey may be obtained from specific publications8,9.
The data collection instrument was elabo-rated in accordance with models used in previous national and international studies about adolescent behavior after adaptation to the Brazilian reality based on tests performed in schools of Rio de Janeiro, Belém and Recife9.
For PeNSE, the questionnaire was given to students of the selected groups by means of a portable computer operated by the student in the Personal Digital Assistante (PDA), which automatically registered the information. Data were stored throughout the day, being further transferred to one spreadsheet. he students who did not feel encouraged to participate in the study were considered as losses.
In total, 1,453 schools were selected, with 2,175 groups and 68,735 regular students. On the data collection day, 63,411 students were present; loss rate was 7.7% at this phase. Also, 501 students who refused to participate or did not ill in the variable “sex” were excluded from the sample. hus, data from 60,973 students were analyzed with a non-response rate of 11.3%.
The statistical package SPSS10 was
used to calculate the prevalence and the 95%CI regarding variables, which were analyzed according to sex and adminis-trative management of the school (public or private) for the total of 26 state capitals and the Federal District, also enabling the identification of statistically significant differences.
The following aspects were analyzed: experimenting alcohol in life; drunk-enness episodes in life; regular alcohol consumption or just in the previous 30 days; problems with family or friends due to alcohol use such as missing classes, getting hurt or fighting; family perception regarding drunkenness; and experimenting some other type of drug (marijuana, cocaine, crack, shoe glue, inhalants, ecstasy etc.).
The variables: experimenting alcohol and some other type of drug at least once were described for each capital according to sex and age and 95%CI. The number of alcohol glasses consumed per day in the past 30 days and how to get the alcohol were described, with respective 95%CI.
The study was approved by the National Commission on Ethics in Research (CONEP) of the Ministry of Health, amendment nº 005/2009, related to Register 11,537. The research was preceded by a contact with the State and County Secretaries of Education and the administration of the selected schools.
Results
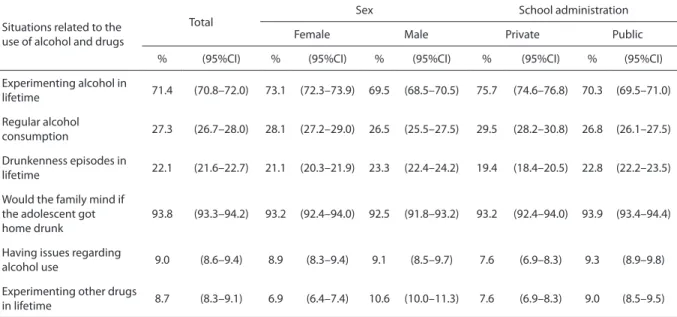
alcohol at least once. This situation was significantly higher among females (73.1%; 95%CI 72.3-73.9) from private schools (75.7%; 95%CI 74.6-76.8) when compared to males (69.5%; 95%CI 68.5-70.5) and students from public schools (70.3%; 95%CI 69.5-71.0), respectively (Table 1).
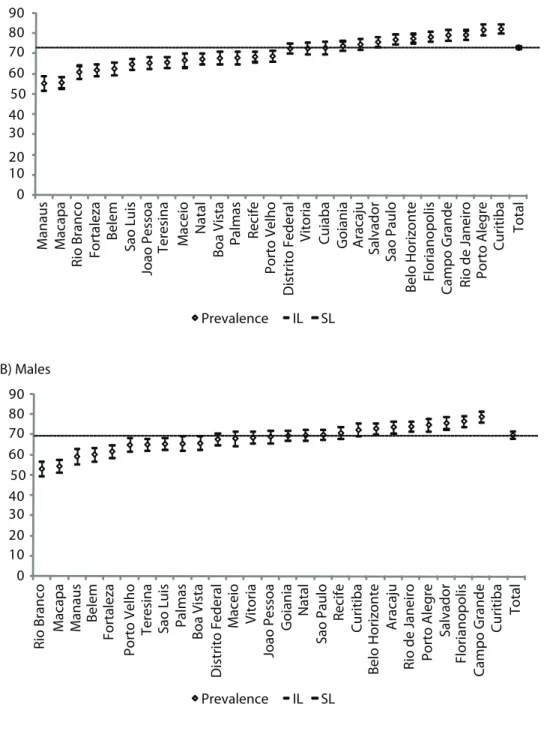
The prevalence of alcohol consumption also varied according to the city, ranging from 55.1% in Macapá to 80.7% in Curitiba. Among females, the capitals with higher prevalence levels were: Curitiba (82.3%; 95%CI 80.1-84.5), Porto Alegre (81.9%; 95%CI 79.2-84.6), Rio de Janeiro (79.4%; 95%CI 77.1-81.7), Campo Grande (79.3%; 95%CI 76.7-81.8), Florianópolis (78.4%; 95%CI 75.9-80.9), Belo Horizonte (77.6%; 95%CI 75.4-79.9), and São Paulo (77.1%; 95%CI 74.6-79.5). As to males, the highest prevalence was found in the following capitals: Curitiba (78.9%; 95%CI 76.4-81.3), Campo Grande (78.7%; 95%CI 75.9-81.4), Florianópolis (76.5%; 95%CI 73.8-79.1), Salvador
(75.6%; 95%CI 72.6-78.5), Porto Alegre (74.7%; 95%CI 71.5-77.9), Rio de Janeiro (73.9%; 95%CI 71.4-76.4), Aracaju (73.6%; 95%CI 70.6-76.5) and Belo Horizonte (72.9%; 95%CI 70.2-75.6), as demon-strated in Figure 1.
Regular consumption of alcohol among students, based on the past 30 days, was of 27.3% (95%CI 26.7-28.0) for the state capitals and the Federal District. Females consumed more in the past 30 days (28.1%; 95%CI 27.2-29.0) than males (26.5%; 95%CI 25.5-27.5); however, the difference is not statistically significant. Regular consumption of alcohol was significantly higher among students from private schools (29.5%; 95%CI 28.2-30.8) in relation to those enrolled in public schools (26.8%; 95%CI 26.1-27.5), as demonstrated in Table 1.
The research showed that approxi-mately one out of five students has already gotten drunk (22.1%; 95%CI 21.6-22.7), and such episodes were significantly
Situations related to the use of alcohol and drugs
Total
Sex School administration
Female Male Private Public
% (95%CI) % (95%CI) % (95%CI) % (95%CI) % (95%CI)
Experimenting alcohol in
lifetime 71.4 (70.8–72.0) 73.1 (72.3–73.9) 69.5 (68.5–70.5) 75.7 (74.6–76.8) 70.3 (69.5–71.0)
Regular alcohol
consumption 27.3 (26.7–28.0) 28.1 (27.2–29.0) 26.5 (25.5–27.5) 29.5 (28.2–30.8) 26.8 (26.1–27.5)
Drunkenness episodes in
lifetime 22.1 (21.6–22.7) 21.1 (20.3–21.9) 23.3 (22.4–24.2) 19.4 (18.4–20.5) 22.8 (22.2–23.5)
Would the family mind if the adolescent got home drunk
93.8 (93.3–94.2) 93.2 (92.4–94.0) 92.5 (91.8–93.2) 93.2 (92.4–94.0) 93.9 (93.4–94.4)
Having issues regarding
alcohol use 9.0 (8.6–9.4) 8.9 (8.3–9.4) 9.1 (8.5–9.7) 7.6 (6.9–8.3) 9.3 (8.9–9.8)
Experimenting other drugs
in lifetime 8.7 (8.3–9.1) 6.9 (6.4–7.4) 10.6 (10.0–11.3) 7.6 (6.9–8.3) 9.0 (8.5–9.5)
Table 1. Prevalence* and respective 95%CI of situations related to alcohol and drugs consumption referred by students at freshman year high school, according to sex and administrative dependence of the school. Brazilian state capitals and Federal District, 2009
Figure 1. Prevalence* and respective 95%CI of experimenting alcohol beverages in life, from students at freshman year high school according to sex. Brazilian State Capitals and Federal District, 2009
Figura 1. Prevalência* e respectivos IC95% de experimentação de bebida alcoólica na vida entre escolares do nono ano do Ensino Fundamental, segundo sexo. Capitais brasileiras e Distrito Federal, 2009
90 A) Females
B) Males 0
Manaus Macapa Rio Branco Fortaleza
Fortaleza
Belem
Belem
Sao Luis
Sao Luis
Joao Pessoa
Teresina
Teresina
Maceio Natal
Boa Vista
Boa Vista
Palmas
Palmas
Recife
Porto Velho
Porto Velho
Distrito Federal
Distrito Federal
Maceio Vitoria
Joao Pessoa
Goiania
Natal
Sao Paulo
Recife
Curitiba
Belo Horizonte
Aracaju
Rio de Janeiro Porto Alegre
Salvador
Florianopolis
Campo Grande
Curitiba
Total
Vitoria Cuiaba Goiania Aracaju Salvador Sao Paulo
Belo Horizonte Florianopolis Campo Grande Rio de Janeiro
Porto Alegre
Curitiba
Total
10 20 30 40
Prevalence IL SL
Prevalence IL SL
50 60 70 80
90
0 10 20 30 40 50 60 70 80
Rio Branco
Macapa Manaus
*Weighted percentage to represent the population of students enrolled in the ninth year of elementary school, in 2008. 95%CI: 95% Confidence Interval; IL: inferior limit; SL: superior limit. Non-informed percentage: 0.5%.
more frequent among male (23.3%; 95%CI 22.4-24.2) than female adolescents (21.1%; 95%CI 20.3-21.9). The proportion of adolescents who have already gotten drunk was higher in public schools (22.8%; 95%CI 22.2-23.5) than in private institutions (19.4%; 95%CI 18.4-20.5), as demonstrated in Table 1.
When the adolescents were asked about their parents perception of them getting home drunk, most conirmed that the parents would be worried about the situation (93.8%; 95%CI 93.3-94.2). his perception was similar among females (93.2%; 95%CI 92.4-94.0) and males (92.5%; 95%CI 91.8-93.2), as well as among students from private (93.2%; 95%CI 93.4-94.4) and public schools (93.9%; 95%CI 92.4-94.0). Alcohol consumption was the cause of problems such as missing classes, injuries or ights for 9.0% (95%CI 8.6-9.4) of the students, with no diferences between females and males, although such problems were more frequent among students from public schools (9.3%; 95%CI 8.5-9.5) in relation to those of private schools (7.6%; 95%CI 6.9-8.3) (Table 1).
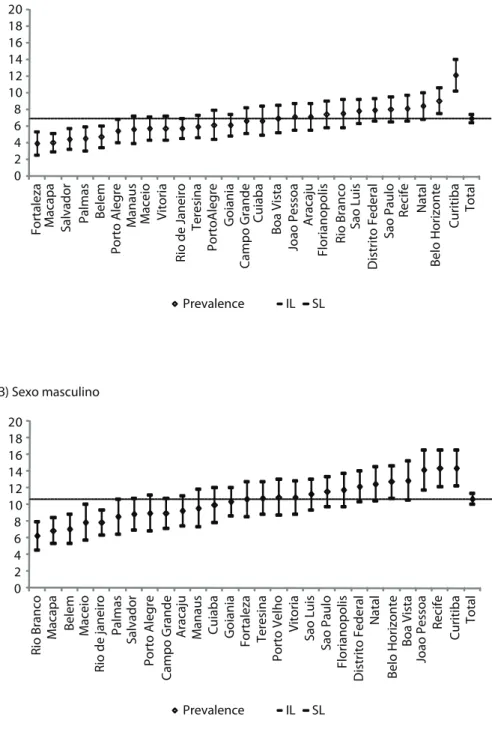
Data from PeNSE showed that 8.7% (95%CI 8.3-9.1) of the students had already tried an illicit substance (marijuana, cocaine, crack, shoe glue, inhalants, ecstasy). The use of illicit drugs was significantly higher among male students (10.6%; 95%CI 10.0-11.3) and students from public schools (9.0%; 95%CI 8.5-9.5) (Table 1). In the capitals, the prevalence of illicit drug use ranged from 5.3% in Macapá to 13.2% in Curitiba. Among females, the capitals with the highest prevalence levels were: Curitiba (12.1%; 95%CI 10.2-14.0), Belo Horizonte (9.0%; 95%CI 7.5-10.6) and Natal (8.4%; 95%CI 6.8-10.0). As to males, the highest prevalence levels were observed in Curitiba (14.3%; 95%CI 12.2-16.5), Recife (14.3%; 95%CI 12.1-16.5) and João Pessoa (14.1%; 95%CI 11.7-16.5) (Figure 2).
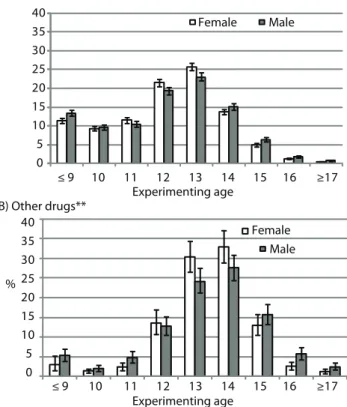
Figure 3 shows the prevalence of the use of alcohol and other drugs according to age and sex. Alcohol consumption is more
prevalent among individuals at the age of 12 and 13 years, and for females (20.6
versus 19.4 and 24.8 versus 23.0%, respec-tively). Males presented higher preva-lence of alcohol use starting from the age of 14 (15.1 versus 13.0%). As to other illicit drugs, the age of irst use varied, being more prevalent from 13 to 14 years old, especially among girls (30.4 versus 24.2% and 32.9 versus 27.6%, respectively), while for boys the age was 15 or older (15.6 versus
13.0%) (Figure 3). he number of alcohol doses had diferent distributions according to sex in two situations: consumption of less than one dose was higher among girls (29.9 versus 25.2%), while the consumption of more than ive doses was signiicantly higher among boys (20.1 versus 15.2%) (Figure 4).
Among the adolescents who had drunk alcohol in the past 30 days, the simplest way to acquire alcohol was at parties (39.8%), followed by the purchase in markets, stores, supermarkets or bars (18.4%). Females could obtain alcohol more easily at parties (43.7 versus
35.1%) or at home (14.5 versus 11.5%). Males could get alcohol more frequently outside the household, by purchasing it in markets, stores, bars and supermarkets (23.0 versus 14.6%), or the street (5.0
versus 2.1%) (non-presented data).
Discussion
Figure 2. Prevalence* and respective 95%CI of experimenting other drugs in life, students at freshman year high school according to sex. Brazilian State Capitals and Federal District, 2009
Figura 2. Prevalência* e respectivos IC95% de experimentação de outras drogas** na vida entre escolares do nono ano do Ensino Fundamental segundo sexo. Capitais brasileiras e Distrito Federal, 2009
*Weighted percentage to represent the population of students enrolled in the ninth year of elementary school, in 2008. **Marijuana, cocaine, crack, shoe glue, inhalants, ecstasy, among others. 95%CI: 95% Confidence Interval; IL: inferior limit; SL: superior limit. Non-informed percentage: 0.7%.
* Percentual ponderado para representar a população de escolares matriculados e frequentando o nono ano do Ensino Fundamental em 2008. ** Maconha, cocaína, crack, cola, loló, lança perfume, ecstasy, dentre outras. IC95%: intervalo de confiança de 95%; LI: limite inferior; LS: limite superior. Percentual de não informado: 0,7%
A) Sexo feminino
B) Sexo masculino
Manaus
Rio Branco
Belem
Sao Luis
Joao Pessoa
Teresina
Maceio Natal
Boa Vista
Palmas Recife
PortoAlegre
Distrito Federal
Vitoria Goiania Cuiaba Aracaju
Salvador Sao Paulo
Belo Horizonte
Florianopolis
Campo Grande
Rio de Janeiro
Porto Alegre
Curitiba
Total
Prevalence IL SL
0 2 4 6 8 10 12 14 16 18 20
J
o
ã
o
P
e
s
s
o
a
Prevalence IL SL
Fortaleza Macapa
0 2 4 6 8 10 12 14 16 18 20
Rio Branco
Macapa Maceio
Rio de janeiro
Palmas
Salvador
Porto Alegre
Campo Grande
Aracaju Manaus Cuiaba Goiania Fortaleza Teresina
Porto Velho
Vitoria
Sao Luis
Sao Paulo
Florianopolis
Distrito Federal
Natal
Belo Horizonte
Boa Vista
Joao Pessoa
Recife
Curitiba
Total
Figure 3.Prevalence* and respective 95%CI of experimenting alcohol beverages and other drugs**, students at freshman year high school, according to experimenting age and sex. Brazilian State Capitals and Federal District, 2009
Figura 3. Prevalência* e respectivos IC95% de consumo de álcool e outras drogas** entre escolares do nono ano do Ensino Fundamental, segundo idade de experimentação e sexo. Capitais brasileiras e Distrito Federal, 2009
*Weighted percentage to represent the population of students enrolled in the ninth year of elementary school, in 2008. **Marijuana, cocaine, crack, shoe glue, inhalants, ecstasy, among others. 95%CI: 95% Confidence Interval.
* Percentual ponderado para representar a população de escolares matriculados e freqüentando o nono ano do Ensino
Fundamental, em 2008. ** Maconha, cocaína, crack, cola, loló, lança perfume, ecstasy, outros. IC95%: intervalo de confiança de 95% 0
5 10 15 20 25 30 35 40
0 5 10 15 20 25 30 35 40
≤ 9 10 11 12 13 14 15 16 ≥17
≤ 9 10 11 12 13 14 15 16 ≥17
%
Experimenting age
Experimenting age Female A) Alcohol
B) Other drugs**
Male
Female Male
Figure 4.Prevalence* and respective 95%CI of alcohol beverage consumption referred by students at freshman year high school, according to number of glasses/doses consumed within the last 30 days and sex. Brazilian State Capitals and Federal District, 2009
Figura 4. Prevalência* e respectivos IC95% de consumo de bebida alcoólica referida pelos escolares do nono ano do Ensino Fundamental, segundo número de copos/doses consumidos nos últimos 30 dias e sexo. Capitais brasileiras e Distrito Federal, 2009
0
<1 1 2 3 4 ≥5
5 10 15 20 25 30 35
Female Male
Number of glasses/doses
*Weighted percentage to represent the population of students enrolled in the ninth year of elementary school, in 2008. 95%CI: 95% Confidence Interval.
adolescents to get alcohol, especially at parties, bars, stores and even at home.
Many studies show that alcohol use among adolescents has been very common in Brazil and throughout the world. In the United States, a national study11 revealed
that the consumption of alcohol at least once was cited by 81.6% of the adolescents in 1997, and the frequency was reduced to 75% in 2007. A survey was conducted in Spain12 and showed that alcohol use
among 13 to 14-year-old students was of 35.5% among boys and 27.3% among girls; this frequency increased in the group aged 15 to 16 years to 67.6% among boys and 71.9% among girls.
A study conducted by the Brazilian Center for Drug and Alcohol13 with 14
to 17-year-old adolescents living in 143 Brazilian cities showed that 75% of them had already consumed alcohol at least once. However, data from PeNSE presented similar prevalence levels to the ones observed in other countries, which demonstrates the extension of the problem in Brazil and throughout the world.
About 50% of the adolescents inter-viewed for PeNSE reported having consumed alcohol before the age of 12, information that is similar to the results observed in a study14 with students from
the public elementary and high schools of the 27 state capitals in Brazil in 2004, which showed that the average age for initiating alcohol consumption was 12.5 years.
As to current consumption, or regular consumption in the past 30 days, the proportions were also elevated in other studies. In the United States11, 44.7%
of the 14 to 17-year-old adolescents reported having drunk alcohol in the past month. In Pelotas, Rio Grande do Sul1,
a cross-sectional study showed that, in 2005 and 2006, 23% of the adolescents aged 11 to 15 years consumed alcohol in the month prior to the research, 21.7% of men and 24.2% of women. The adoles-cents interviewed for PeNSE also reported consuming high levels of alcohol in the previous 30 days. Generally, the studies
demonstrated that alcohol consumption has been elevated among youngsters.
A study carried out in 41 countries by the World Health Organization (WHO)4
showed that 11% of the students (9% of girls and 13% of boys) had drunk exces-sively or gotten drunk at least twice. About 22% of the adolescents inter-viewed for PeNSE reported having been drunk at least once. This situation may be considered serious, once it increases the chances that youngsters get involved in risky episodes, such as issues with the family and friends, and also at school; these situations were reported by 9% of the students analyzed by PeNSE.
Since alcohol use is socially acceptable, and even stimulated in most countries3,
the exposure of adolescents to it has been increasing, thus, there are bigger chances of involvement in risky situations. The family is essential for the development of adolescents, thus, parental support in the activities performed by children is very important. Studies15,16 show that when
parents are worried about the activities performed by their children, they show less involvement with alcohol, drugs and tobacco. The fact that adolescents considered that 93% of the parents would be upset in case they got home drunk shows the family as a space of protection, since parents are concerned about their children and discourage risk attitudes.
The increase in drug use among youngster is a serious issue in many countries. The most consumed illicit drug in Europe and the United States is marijuana, and its use among youngsters may be a sign of psychosocial distur-bances, which elevates the chances of dependence in adult life. A survey conducted by WHO4 among adolescents
in over 40 countries showed that 18% of 15-year-old adolescents had already tried marijuana during some period of life.
and anxiolytics more frequently. Besides, licit drugs such as alcohol are used earlier when compared to psychotropic drugs13,14.
A study conducted in 2004 with students from public elementary and high schools in the 27 state capitals showed that mean age to experiment drugs for the first time ranged from 12.5 to 14.4 years; cocaine had the highest mean (14.4 years old)14.
Conclusions
Data from PeNSE demonstrate the severity of the problem regarding alcohol and drug use among students, showing the early exposure, the dimension of the problem (more than 70% have been exposed to alcohol, and around 8% to drugs), leading to an increasing exposure to risks. It was also observed that adoles-cents have easy access to alcohol at parties, bars, stores and even at home.
References
1. Strauch ES, Pinheiro RT, Silva RA, Horta BL. Uso do álcool
por adolescentes: estudo de base populacional. Rev Saúde Pub. 2009;43(4):647-55.
2. Modelli MES, Pratesi R, Tauil PL. Blood alcohol
concentration in fatal traic accidents in the Federal District, Brazil. Rev Saúde Pub. 2008;42(2):350-2.
3. World Health Organization. International guide for
monitoring alcohol consumption and related harm. Geneva: WHO; 2002.
4. World Health Organization. Inequalites in young people´s
health. Health Behavior in School- Aged Children. International Report from 2005-2006. Health Police for Children and Adolescents. No 5; 2008.
5. Vieira PC, Aerts DRGC, Freddo SL, Bittencourt A, Monteiro
L. Uso de álcool, tabaco e outras drogas por adolescentes escolares em município do Sul do Brasil. Cad Saúde Pub. 2008;24(11):2487-98.
6. Vendrame A, Pinsky I, Faria R, Silva R. Apreciação de
propagandas de cerveja por adolescentes: relações com a exposição prévia às mesmas e o consumo de álcool. Cad Saúde Pub. 2009;25(2):359-65.
7. Iglesias V, Cavada G, Silva C, Cáceres D. Consumo precoz de
tabaco y alcohol como factores modiicadores del riesgo de uso de marihuana. Rev Saúde Pub. 2007;41(4):517-22.
8. Instituto Brasileiro de Geograia e Estatística. Pesquisa
Nacional de Saúde do Escolar (PeNSE) 2009. Rio de Janeiro: IBGE; 2009.
9. Malta DC, Sardinha LMV, Mendes I, Barreto SM, Giatti
L, Castro IRR, et al. Prevalência de fatores de risco e proteção de doenças crônicas não transmissíveis em adolescentes: resultados da Pesquisa Nacional de Saúde do Escolar (PeNSE), Brasil, 2009. Cienc Saúde Col. 2010;15(suppl.2):3009-19.
10. SPSS for Windows Release 8.0.0.Chicago: SPSS Inc., 1997. CD-ROM.
11. Youth Risk Behavior Survey (YRBS). Trends in the Prevalence of Alcool Use National YRBS: 1991-2007. Disponível em http://www.cdc.gov/yrbss. Acessado em dezembro de 2010.
12. Health Behavior in School Aged Children (HBSC), 2002. Los adolescentes españoles y su salud. Ministério de Sanidad y Consumo: Madrid; 2005.
13. CEBRID. II Levantamento nacional sobre o uso de drogas psicotrópicas no Brasil: estudo envolvendo as 108 maiores cidades do país. São Paulo: UNIFESP; 2006.
14. Galduróz JCF, Noto AR, Fonseca AM, Carlini EA. V Levantamento nacional sobre o consumo de drogas psicotrópicas entre estudantes do ensino fundamental e
Alcohol and drug advertising, among other problems, causes children and adoles-cents to develop consumption habits6. In
order to reduce the prevalence of experi-menting and regular use of alcohol in young and vulnerable populations, society must change its passive and stimulating behavior towards the issue, recognizing the risks of early exposure and proposing control measures, such as the prohibition of alcohol advertisement, especially beer. his has been the main tool to reduce tobacco use9.
médio da rede pública de ensino nas 27 capitais brasileiras, 2004. São Paulo: CEBRID/Escola Paulista de Medicina; 2004.
15. DiClemente RJ, Wingood GM, Crosby R, Sionean C, Cobb BK, Harrington K, et al. Parental monitoring: association with adolescents risk behavior. Pediatrics. 2001;107(6):1363-8.
16. Paiva FS, Rozani TM. Estilos parentais e consumo de drogas entre adolescentes: revisão sistemática. Psicol Est. 2009;14(1):117-83.