Validity and reliability of foods
and beverages intake obtained
by telephone survey in Belo
Horizonte, Brazil
Validade e reprodutibilidade
de marcadores do consumo de
alimentos e bebidas de um inquérito
telefônico realizado na cidade de
Belo Horizonte (MG), Brasil
Larissa Loures MendesI Suellen Fabiane CamposI Deborah Carvalho MaltaII,III Regina Tomie Ivata BernalIII Naíza Nayla Bandeira de SáIV Gustavo Velásquez-MeléndezII
Programa de Pós-Graduação em Enfermagem – Universidade Federal de Minas Gerais (UFMG) – Belo Horizonte (MG), Brazil
IIDepartamento de Enfermagem Materno Infantil e Saúde Pública – Escola de
Enfermagem daUniversidade Federal de Minas Gerais (UFMG) – Belo Horizonte (MG), Brazil
3Post Graduation Program in Public Health of Universidade de São Paulo (USP) –
São Paulo (SP), Brazil
4 General Coordination of Non Communicable Diseases and Conditions –
Health Surveillance Secretariat – Ministry of Health – Brasília (DF), Brazil
Study carried out at theUniversidade Federal de Minas Gerais
Financial Support: Ministry of Health
Correspondence to: Gustavo Velásquez-Meléndez – Escola de Enfermagem - Universidade Federal de Minas Gerais (UFMG) – Av. Afredo Balena, 190 – CEP: 30130-100 – Belo Horizonte (MG), Brazil – E-mail: [email protected]
Conflict of interest: nothing to declare.
Abstract
Objective: To evaluate the validity and reproducibility markers of food and beverage intake obtained by means of a telephone-based surveillance system. Methods: Reproducibility was assessed by means of repeated interviews with a 7-15 day interval after the irst interview of the system (n=258). Validity was analyzed based on three interviews corresponding to the 24 hour recall method, used as gold standard, 3 days a week, 7 to 15 days after the original telephone interview (n=217). In the study of reproducibility, kappa statistics was used to measure the similarity between the results of the proportions obtained in the irst and second interviews. For valida-tion, the proportion of positive reports regarding foods and beverages at the origi-nal telephone interview was compared to that obtained by the 24 hour recall method, and the results was analyzed by calculating sensitivity, speciicity and positive predictive value. Results: In the reproducibility study, the agreement was almost perfect for the marker milk consumption (0.86), substantial for fruit consumption (0.67), intake of fruits and vegetables, intake of meat with fat and alcohol abuse. he agreement was moder-ate for the intake of soft drink, and fair for the consumption of vegetables. Regarding the validity, there was an underestimation of fruit, vegetable and milk consumption, except for meat and alcohol when compared with the consumption frequency estimated from the three 24-hours recalls, diferenc-es related to soft drink consumption was inexpressive. Conclusion: he instruments enabled the surveillance of factors which were potentially associated with chronic diseases, however, it is a priority to continue with validation studies in other populations to provide greater system reliability, always considering possible limiting factors.
Keywords: food consumption; alcohol
Resumo
Objetivo: avaliar a reprodutibilidade e validade de indicadores de consumo de alimentos e bebidas levantados por meio de entrevistas telefônicas pelo Sistema de Vigilância de Fatores de Risco e Prote-ção para Doenças Crônicas por Telefone (VIGITEL). Métodos: A reprodutibilidade foi aferida por meio de entrevistas repeti-das com intervalos de 7 a 15 dias a partir da primeira entrevista original do sistema (n=258). A validade foi avaliada usando como padrão ouro 3 entrevistas correspon-dentes a recordatórios de 24h (R24h) em 3 dias da semana, após 7 a 15 dias da entre-vista telefônica original (n=217). No estudo de reprodutibilidade a estatística kappa foi utilizada para medir a concordância entre os resultados das proporções obtidas na primeira e na segunda entrevista. Para a validação, a proporção de referência positiva de alimentos e bebidas na entrevista telefôni-ca original foi comparada àquela obtida nos R24he sua avaliação foi analisada por meio do cálculo da sensibilidade, especiicidade e valor preditivo positivo. Resultados: No estudo de reprodutibilidade, observou-se concordância quase perfeita para o indica-dor de consumo de leite com teor integral de gordura (0,86); concordância substan-cial para consumo de frutas (0,67), consu-mo de frutas e hortaliças, consuconsu-mo de carne com gordura ou frango com pele e consumo abusivo de bebida alcoólica; concordância moderada para o indicador de consumo de refrigerante; e concordância regular para o indicador do consumo de hortaliças. Com relação ao estudo de validação, observou-se subestimação de indicadores de consumo de frutas, hortaliças e leite integral, exceto para consumo de carne/frango com gordu-ra e bebida alcoólica, quando compagordu-rados com a frequência desse consumo estimada a partir dos três R24horas; as diferenças para o consumo de refrigerantes foi inexpressi-va. Conclusão: Veriicou-se que os instru-mentos utilizados permitem a vigilância de fatores potencialmente associados a doenças não transmissíveis, entretanto, é
prioritária a continuidade de estudos de validação em outras populações do sistema, com o objetivo de oferecer maior coniabili-dade aos mesmos, sempre considerando as potenciais limitações.
Introduction
Chronic non-communicable diseases (CNCD) have been regarded as impor-tante health problems and their main risk factors are obesity, physical inactivity, alcohol abuse, smoking and poor eating habits. Obesity is one of the main nutri-tional issues in Brazil, being associated with the increased prevalence of cardiovascular diseases, type II diabetes and some types of cancer1,2. Literature shows convincing
evidence that inadequate eating habits and low rates of physical activity are among the main factors associated with obesity and chronic non-communicable diseases3,4.
Studies also show that the low intake of fruits and vegetables is associated with an increased risk of cancer5. he global strategy
for healthy eating and physical activity of the World Health Organization (WHO) recommends the frequent intake of fruits and vegetables as sources of micronutrients and ibers6,7. hus, food intake constitutes
one of the main modiiable risk factors and its assessment has been identiied as an important target to prevent obesity and, therefore, other chronic non-communi-cable diseases8,9.
Information from health surveillance systems is useful to systematically monitor the frequent intake of these foods by the population. In Brazil, the Telephone-based Surveillance of Risk and Protective Factors for Chronic Diseases (VIGITEL) was estab-lished in 2006. Its objective is to analyze the frequency of food and beverage intake and relates such frequency to risk and protective factors of non-communicable diseases in the adult population living in the Brazilian capital, among other issues. Despite being practical, studies of food and beverage intake in large populations may present errors, once the consumption reported by telephone may be subject to bias6. hus,
it is important to verify if the information collected by the surveillance systems is reliable in order to properly address the development of policies of health promotion and drug prevention.
he assessment of food intake is conducted with methods that enable the calculation of the nutritional composition of the diet by means of interviews. Among such methods, the 24-hour recall stands out for being fast, bringing about a recent memory related to consumption, besides being the method that is less prone to change eating behavior. When employed as a series, it eiciently estimates usual intake. However, the method has disadvantages such as the dependence on memory and the cooperation of the participant, besides the fact that one 24 hour recall test does not show the usual intake of the individual due to the varied daily food intake7.
Until this moment, only one study has been conducted in Brazil with the objective to analyze the validity of standard questionnaires used in telephone surveys of VIGITEL to assess and monitor behaviors and individual conditions as to food and beverage intake6, however, the identiication
of possible assessment error is necessary and justiies the constant validation of the system.
So, the objective of this study was to assess the performance of validity and repro-ducibility markers of food and beverage intake, conducted by telephone surveys by VIGITEL, in a sample of adults living in Belo Horizonte, Minas Gerais, Brazil.
Methods
his study was conducted with
subsamples from the VIGITEl system, conducted with the residents of Belo Horizonte, Minas Gerais, Brazil. he sampling procedures used by the system aimed to obtain probability samples of the population aged 18 years or more, living in households with at least one telephone line in each of the 26 state capitals and the Federal District. More details in another publication10.
preix. At the end of each year, there is a sample of 2,000 individuals in each capital of the country10.
Two samples were used in this study: one with 258 participants (169 women and 89 men), corresponding to the study of repro-ducibility; and another with 217 participants (150 women and 67 men), corresponding to the validation analysis. he participants accepted to participate in new interviews, as demonstrated in Chart 1. Both samples were suicient to conduct reproducibility and validation studies, according to Willett and Lenart11, who indicate a sample of 100
to 200 individuals for this type of study. Indicators of food and beverage intake proposed by VIGITEL10, presented in Chart 2,
were chosen to analyze reproducibility and validity. he system uses indicators of unhealthy eating habits: daily or basically daily consumption of soft drinks, with unrestricted sugar (at least 1 can in ≥5 days a week); usual consumption (reported by the subject) of saturated fat (red meat with excess fat, without removing its visible fat, or chicken skin); usual consumption
(reported by the subject) of whole milk and alcohol abuse (intake of more than 4 doses for women, or more than 5 doses for men, on the same day for the past 30 days, consid-ering a can of beer, a glass of one or a dose of distilled beverage as one dose of alcohol).
Healthy eating indicators were: daily or basically daily consumption (≥5 days a week) of fruits and/or natural juice; daily or basically daily (≥5 days a week) intake of vegetables (including salads, except for tubers, such as potato and cassava); and daily or basically daily consumption of the markers regarding fruits and vegetables altogether.
he participants of the reproducibility study were contacted again by telephone 7 to 15 days after answering to VIGITEL. At the second interview, participants answered to the same questions regarding food and beverage intake, in the same order. In all cases, the second interviewer was diferent from the one who had conducted the original interview. Kappa statistics was used to measure the agreement between the results of the proportions obtained
Participants of VIGITEL: 314 subjects Participants of VIGITEL: 522 subjects
REPRODUCIBILITY STUDY VALIDITY STUDY
Total losses : 83 subjects (24%)
Participants of the reproducibility study: 258 (76%) subjects
Refusal : 56 subjects (11%)
Total losses : 249 (48%) subjects
– 147 concluded 0 24 hour recall – 67 concluded 1 24 hour recall – 35 concluded 2 24 hour recalls
Participants of the validation study (who concluded 3 24 hour recalls): 217 (41%)
subjects
Chart 1. Flow chart of participants from the sample used for analysis in the study of reliability and validity
Question Responses How often do you eat fruits during the week?
How often do you drink natural juices during the week? How often do you eat lettuce and tomato, or any other raw vegetable, during the week?
How often do you eat cooked vegetables with food, or in the soup, for instance: cabbage, carrot, chayote, eggplant, zucchini, not to mention potato, cassava or yam?
a) once or twice a week b) 3 or 4 days a week c) 5 or 6 days a week d) almost never e) never
When you eat red meat with fat or chicken skin, do you: a) Always remove the visible excess fat or skin b) Eat with fat or skin
c) Do not eat red meat with fat, or chicken skin
What type of milk do you drink? a) whole
b)skim or semi-skim c) both
d) do not know How often do you drink soft drinks in a week? a) once or twice a week
b) 3 or 4 days a week c) 5 or 6 days a week d) almost never e) never
What kind? a) regular
b) diet/light c) both In the past 30 days, have you had 5 or more doses of alcohol, if you are a man, or 4 or more doses of alcohol, if you are a woman?
a)Yes b)No
Chart 2 . Accomplished questions to evaluate the consumption of foods and beverages used for study of reliability and validity Quadro 2. Perguntas realizadas para avaliação do consumo de alimentos e bebidas do sistema VIGITEL utilizadas para as análises do estudo de reprodutibilidade e validade
in the irst and the second interviews. Values higher than 0.80 were considered as almost perfect agreement; from 0.61 to 0.80, substantial agreement; from 0.41 and 0.60, moderate agreement; from 0.21 and 0.40, fair agreement; values below 0.21 were considered as mild agreement12.
As to validity, the performance of the original questionnaire was compared to the 24hR method, considered as gold standard in this study. he participants were recruited by telephone in up to two weeks (minimum of 7 and maximum of 15 days) after the original VIGITEL interview. hey were contacted by a team of previously trained nutritionists. hree 24hR were performed in alternate days, two on week days and one on a weekend or holiday. he intake report in at least one of the 24 hour recalls of meat and/ or chicken with fat, whole milk and alcohol (ive doses for men, four doses for women) was considered as a positive reference to
consumption. For fruits, vegetables and soft drinks, the reported consumption in two or more recalls (two days were equivalent to the consumption of ive or more days a week) was also considered positive. When the participants did not spontaneously mention the studied food groups (fruits, vegetables, red meat, chicken, milk, soft drinks and alcohol), they were asked at the end of the interview about whether or not these were present or absent from their diet in the last 24 hours.
he proportion of positive reference of food and drinks in the original telephone survey was compared to that obtained in the 24 hour recall13, and its assessment of correct
Statistical procedures were conducted with the software Stata (version 9.0).
his study was approved by the Research Ethics Committee of Universidade Federal de Minas Gerais, protocol n° 552/08.
Results
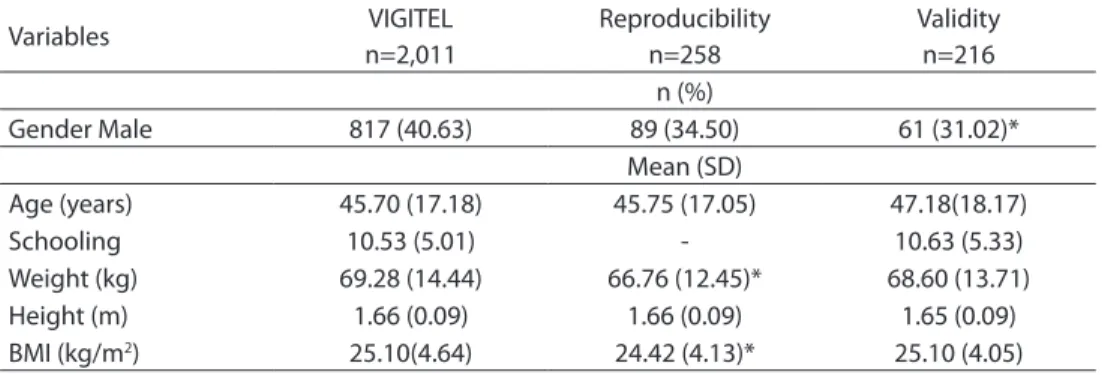
he sample consisted mostly of female patients, and 65.5% of the women were in the reproducibility analysis, while 69.1% partic-ipated in the validity study. For both studies, mean age was similar to that of the original sample of Belo Horizonte. he validation analysis showed no diference as to the average school years of the participants. he distribution of interviewees according to gender and age group were similar to that of the original VIGITEL interview in both cases. As to the anthropometric measure-ments in the reproducibility analysis, the height was similar, but the weight and Body Mass Index (BMI) were diferent from the original sample of VIGITEL. For the validation study, all anthropometric measurements were similar to VIGITEL, as demonstrated in Table 1.
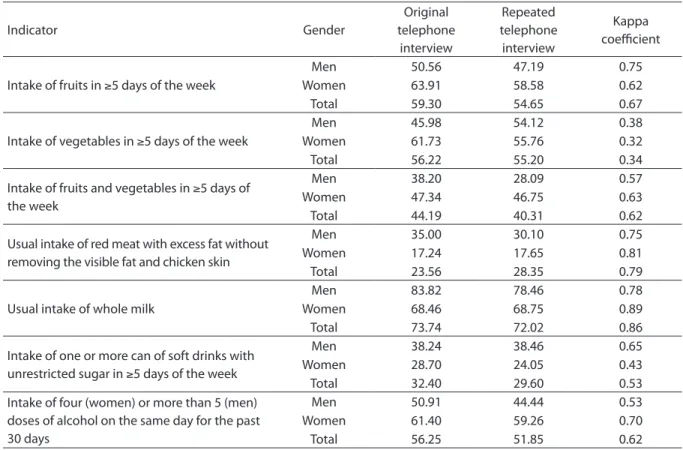
In Table 2, the frequency of food and beverage intake reported in the reproduc-ibility study is demonstrated, with indicators proposed by the system and calculated from the original interview and the second one, conducted after 7 to 15 days. he agreement
was satisfactory by the analysis of the kappa coeicient for most of the indicators.
An almost perfect agreement was observed for the indicator “intake of whole milk”; as to the four indicators (intake of fruits, fruit and vegetables, meat with fat and chicken skin and alcohol abuse), the agreement was substantial; the intake of soft drinks presented moderate agreement; and fair agreement was observed for the indicator of intake of vegetables.
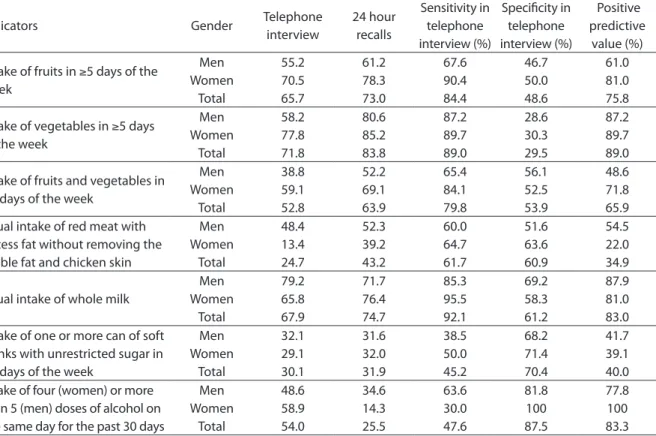
Table 3 presents the frequency of
individuals exposed to food intake
indicators, which was estimated from the original interview and the three recalls. An increased consumption frequency was noted when measured from the three 24 hour recalls, except for the indicator related to alcohol abuse, in which the intake frequency was lower than that reported at the original interview (54.0% versus 25.5%), and the one related to the intake of soft drinks with sugar, which barely varied (from 30.1% to 31.9%).
When the intake frequency was analyzed by gender, fewer women reported removing the fat from the meat or the chicken skin in the original interview (13.4%) when compared to the information reported in the 24 hour recall test (39.2%). Women reported an expressive reduction as to alcohol consumption at the recall analysis (58.9% versus 14.3%).
Table 1. Sociodemographic characteristics of the participants of VIGITEL, reproducibilityy and validity study. Belo Horizonte (MG); Brazil – 2009
Tabela 1. Comparação das características sócio-demográficas das amostras do VIGITEL, reprodutibi-lidade e vareprodutibi-lidade. Belo Horizonte (MG) – 2009
Variables VIGITEL
n=2,011
Reproducibility n=258
Validity n=216 n (%)
Gender Male 817 (40.63) 89 (34.50) 61 (31.02)*
Mean (SD)
Age (years) 45.70 (17.18) 45.75 (17.05) 47.18(18.17)
Schooling 10.53 (5.01) - 10.63 (5.33)
Weight (kg) 69.28 (14.44) 66.76 (12.45)* 68.60 (13.71)
Height (m) 1.66 (0.09) 1.66 (0.09) 1.65 (0.09)
BMI (kg/m2) 25.10(4.64) 24.42 (4.13)* 25.10 (4.05)
*p<0.05 in relation to VIGITEL
Table 2. Frequency (%) of foods and beverages consumption in adults obtained in two successive telephone interviews conducted. Belo Horizonte (MG) Brazil – 2009
Tabela 2. Frequência (%) de indicadores do consumo de alimentos e bebidas em adultos obtidos em duas entrevistas telefô-nicas sucessivas realizadas com os mesmos indivíduos. Belo Horizonte (MG) – 2009
Indicator Gender
Original telephone
interview
Repeated telephone interview
Kappa coefficient
Intake of fruits in ≥5 days of the week
Men 50.56 47.19 0.75
Women 63.91 58.58 0.62
Total 59.30 54.65 0.67
Intake of vegetables in ≥5 days of the week
Men 45.98 54.12 0.38
Women 61.73 55.76 0.32
Total 56.22 55.20 0.34
Intake of fruits and vegetables in ≥5 days of the week
Men 38.20 28.09 0.57
Women 47.34 46.75 0.63
Total 44.19 40.31 0.62
Usual intake of red meat with excess fat without removing the visible fat and chicken skin
Men 35.00 30.10 0.75
Women 17.24 17.65 0.81
Total 23.56 28.35 0.79
Usual intake of whole milk
Men 83.82 78.46 0.78
Women 68.46 68.75 0.89
Total 73.74 72.02 0.86
Intake of one or more can of soft drinks with unrestricted sugar in ≥5 days of the week
Men 38.24 38.46 0.65
Women 28.70 24.05 0.43
Total 32.40 29.60 0.53
Intake of four (women) or more than 5 (men) doses of alcohol on the same day for the past 30 days
Men 50.91 44.44 0.53
Women 61.40 59.26 0.70
Total 56.25 51.85 0.62
Sensitivity values of the indicators ranged from 45.2% (alcohol abuse) to 92.1% (intake of whole milk). he sensitivity of the instrument used by the original interview was close to or higher than 70% for most indicators, except for the ones regarding the intake of soft drinks with sugar (47.6%) and alcohol abuse (45.2%). Speciicity ranged from 29.5% (intake of vegetables) to 87.5% (alcohol abuse). Positive predictive factors ranged from 22% to 100%, especially for indicators of consumption of vegetables (89%), milk (83%) and alcohol (83.3%).
Discussion
he monitoring of eating habits by means of indicators of fruit and vegetable consumption, considered to be healthy eating markers, is essential because of the convincing evidence regarding its efect on
the reduction of morbidity and mortality risks at a population level, besides other beneits related to keeping a healthy weight3.
Such activities may reveal important infor-mation as to intake trends of these markers, which enable the assessment and proposal of public policies. Results indicated that the questionnaire that analyzed food and beverage intake indicators as protective and risk factors proposed by VIGITEL had proper reproducibility; however, it was not accurate as to speciicity. he analysis of positive predictive values, which are important regarding validity, showed that the chances of the telephone survey corresponding to the frequency of real consumption of vegetables, fruits, milk and alcohol was higher than 75% for the whole sample.
Table 3. Frequency (%) of food and beverage intake indicators in adults, estimated from the original telephone interview and three 24 hour diet recalls. Belo Horizonte (MG), Brazil – 2009
Tabela 3. Frequência (%) de indicadores do consumo de alimentos e bebidas em adultos, estimada a partir da entrevista telefônica e de três recordatórios alimentares de 24 horas. Belo Horizonte (MG) – 2009 e 2010.
Indicators Gender Telephone
interview 24 hour recalls Sensitivity in telephone interview (%) Specificity in telephone interview (%) Positive predictive value (%)
Intake of fruits in ≥5 days of the week Men Women Total 55.2 70.5 65.7 61.2 78.3 73.0 67.6 90.4 84.4 46.7 50.0 48.6 61.0 81.0 75.8
Intake of vegetables in ≥5 days of the week
Men Women Total 58.2 77.8 71.8 80.6 85.2 83.8 87.2 89.7 89.0 28.6 30.3 29.5 87.2 89.7 89.0
Intake of fruits and vegetables in
≥5 days of the week
Men Women Total 38.8 59.1 52.8 52.2 69.1 63.9 65.4 84.1 79.8 56.1 52.5 53.9 48.6 71.8 65.9 Usual intake of red meat with
excess fat without removing the visible fat and chicken skin
Men Women Total 48.4 13.4 24.7 52.3 39.2 43.2 60.0 64.7 61.7 51.6 63.6 60.9 54.5 22.0 34.9
Usual intake of whole milk
Men Women Total 79.2 65.8 67.9 71.7 76.4 74.7 85.3 95.5 92.1 69.2 58.3 61.2 87.9 81.0 83.0 Intake of one or more can of soft
drinks with unrestricted sugar in
≥5 days of the week
Men Women Total 32.1 29.1 30.1 31.6 32.0 31.9 38.5 50.0 45.2 68.2 71.4 70.4 41.7 39.1 40.0 Intake of four (women) or more
than 5 (men) doses of alcohol on the same day for the past 30 days
Men Women Total 48.6 58.9 54.0 34.6 14.3 25.5 63.6 30.0 47.6 81.8 100 87.5 77.8 100 83.3
levels, because some factors such as the memory of the participants, the ability to answer the questionnaire about eating habits and other conditions that occur during interviews may potentially impact the performance of the survey14.
In this study, the reproducibility analysis in two serial interviews of the VIGITEL system, with an interval of 7 to 15 days, was generally similar to that described by the study conducted in another Brazilian capital with the same objective13. In this study,
participants were asked about their eating habits, not in terms of quantity, but as to the presence of some foods that are considered as protective or risk factors. hus, reproduc-ibility levels were substantial (kappa coei-cient between 0.6 and 0.8) when related to the intake of meat/chicken, whole milk, fruits and alcohol. On the other hand, there were relatively signiicant diferences
between both studies concerning the reproducibility as to the consumption of vegetables and soft drinks. he comparison study showed that reproducibility was substantial for both indicators, and in this study it was regular and moderate for the consumption of vegetables and soft drinks, respectively.
When the frequency of adherence to the proposed indicators were compared in both interviews (the original and the one conducted after 7 to 15 days), results were close. As a consequence of this inding, it is possible to state that reproducibility levels are compatible with similar studies related to questionnaires of food intake patterns that do not assess the quantity, but only the frequency of consumption15. As to the
to the 24 hour recall test. However, overes-timation bias was detected in relation to alcohol consumption. his last result may be explained by the questioned period of consumption in the irst interview, related to the past 30 days (Figure 2). Another limiting factor is that the question about milk and meat from VIGITEL did not refer to a speciic period, and the intake of fruits and vegetables, in some occasions, was not present in two 24 hour recall tests. Considering sensitivity and speciicity patterns, there are usually higher values of sensitivity (84% to 92%) for fruits, vegetables and whole milk, and low values for drinks. he questionnaire suggests an accurate performance related to sensitivity in order to detect the adequate intake of healthy markers. However, it presented low sensi-tivity to detect unhealthy markers, such as the intake of meat/chicken with fat, whole milk, soft drinks with sugar and alcohol.
he fact that women were prevalent in this study can be seen as limiting factor,
however, performance diferences at
VIGITEL regarding food and beverage intake in relation to reproducibility and validity were not important. he 24 hour recall tests performed by telephone was scheduled on the irst day of contact, thus, the participant could have been more conscious about eating on the day prior to
the interview, which can change patterns of eating habits16. On the other hand, the recall
tests performed in a period of 7 days could make the adherence to the study more diicult, despite being the most adequate strategy. Out of the 522 available subjects, 144 completed only the irst 24 hour recall test, and 105 completed two of these tests, especially due to trips, change in work schedule, occasional commitments or for being afected by an illness.
For validation studies, the choice of a reference method is critic. Concerning studies to validate food intake, serial 24 hour recall tests are usually chosen, but golden standard may not be the most accurate denomination, but intermethod validation17.
he conclusions of this study support the strategy used by VIGITEL to identify the trends of food and beverage intake indicators related to non-communicable diseases in Belo Horizonte, because the reported questions are reasonable as to reproducibility and validity. hus, the instruments used enable the surveillance of factors that are potentially associated with non-communicable diseases. However, it is essential to continue with validation studies in other populations of the system in order to prove the system is reliable, always taking its potential limitations into account.
References
1. Renehan AG, Tyson M, Egger M, Heller RF, Zwahlen M. Body-mass index and incidence of cancer: a systematic review and meta-analysis of prospective observational studies. Lancet. 2008;371(9612):569–78.
2. Musaad S, Haynes EN. Biomarkers of obesity and subsequent cardiovascular events. Epidemiol Rev. 2007;29:98–114.
3. Rolls BJ, Ello-Martin JA, Tohill BC. What can intervention studies tell us about the relationship between fruit and vegetable consumption and weight management? Nutr Rev. 2004;62(1):1-17.
4. Swinburn BA, Caterson I, Seidell JC, James WP. Diet, nutrition and the prevention of excess weight gain and obesity. Public Health Nutr. 2004;7(1A):123–46.
5. Block G, Patterson B, Subar AF. Fruit, vegetables, and cancer prevention: a review of the epidemiological evidence. Nutr Cancer. 1992;18(1)1-29.
6. Philippi ST, Latterza AR, Cruz ATR, Ribeiro LC. Pirâmide alimentar adaptada: guia para escolha dos alimentos.Rev. Nutr. 1999;12(1):65-80.
7. EUA. Department of Health and Human Services and U.S. Department of Agriculture. Dietary Guidelines for Americans. Washington, DC: U.S. Government Printing Oice; 2005.
9. Buzzard M. 24-hours dietary recall and food record methods. In: Willett WC. Nutritional Epidemiology. 2nd ed. Oxford: Oxford University Press; 1998. p. 50-73.
10. Brasil. Ministério da Saúde. Secretaria de Vigilância em Saúde. Secretaria de Gestão Estratégica e Participativa. VIGITEL Brasil 2009. Vigilância de fatores de risco e proteção para doenças crônicas por inquérito telefônico. Estimativas sobre frequência e distribuição sócio-demográica de fatores de risco e proteção para doenças crônicas nas capitais dos 26 Estados brasileiros e no Distrito Federal em 2009. Brasília: Ministério da Saúde; 2010. (Série G. Estatística e Informação em Saúde).
11. Willett W, Lenart E. Reproducibility and validity of food-frequency questionnaires. In: Willett WC. Nutritional Epidemiology. 2nd ed. Oxford: Oxford University Press; 1998. p. 101-147.
12. Landis JR, Koch GG. The measurement of observer agreement for categorical data. Biometrics. 1977;33:159-74.
13. Monteiro CA, Moura EC, Jaime PC, Claro RM. Validade de indicadores do consumo de alimentos e bebidas obtidos por inquérito telefônico.Rev. Saúde Pública. 2008;42(4):582-9.
14. Block G, Hartman AM. Issues in reproducibility and validity of dietary studies. Am J Clin Nutr. 1989;50 Suppl 5:1133-8.
15. Nelson MC, Lytle LA. Development and evaluation of a brief screener to estimate fast-food and beverage consumption among adolescents. J Am Diet Assoc. 2009;109(4):730-4.
16. Buzzard IM, Faucett CL, Jefery RW, McBane L, McGovern P, Baxter JS, et al. Monitoring dietary change in a low-fat diet intervention study: advantages of using 24-hour dietary recalls vs food records. J Am Diet Assoc. 1996;96(6):574-9.
17. Sklo M, Javier Nieto J. Epidemiology: Beyond the Basics. 2nd ed. Boston: Jones and Bartlett Publishers; 2007.