Brazilian Journal of Physics, vol. 34, no. 4B, December, 2004 1523
Ion Flux Transmission Along an Insulating Duct
with an Axial Magnetic Field
D. Grondona
∗, H. Kelly
∗, and L. Giuliani
Instituto de F´ısica del Plasma (CONICET), Departamento de F´ısica, Facultad de Ciencias Exactas y Naturales (UBA)
Ciudad Universitaria Pab. I, (1428) Buenos Aires, Argentina
Received on 30 December, 2003; revised version received on 28 April, 2004
An experimental study of the metallic ion flux in a pulsed copper vacuum arc with an annular anode and operated with an axial magnetic field is presented. It is employed an insulating drift duct surrounded by an external coil which generates an axial magnetic field. Operating the arc under vacuum condition, measurements of the ion flux and the plasma potential at different axial positions along the duct and different magnetic field values are presented. The arc voltage and the total discharge current as functions of the magnetic field intensity are also reported. We find that the decay of the ion flux through the duct walls is not exponential. A simplified model for the ion emission is used in order to obtain an interpretation of the measured ion current for different axial positions and magnetic field strength, and a good agreement with the experimental points is found.
1
Introduction
The study of the ion transport through axial magnetic fields is of special interest for Vacuum Arc plasma sources. These devices are attractive for the deposition of thin films, since an intense jet of metallic plasma including relatively high-energy ions (15-120 eV, depending on the cathode material and charge-state of the ions) is produced with a high effici-ency at the cathode surface[1]. The ions come from minute points on the cathode known as “cathode spots”, and the ion current amounts to 8-10 % of the total discharge current [2]. However, cathodic arcs also produce macroparticles of the melted cathode material that are deposited on the subs-trate. The presence of macroparticles increases the porosity and roughness of the coating, affecting the films properties. Several filtering systems to separate the arc plasma and the macroparticles have been developed [3]. Presently, magne-tic filtering is a widely used method for removing the macro-particles. This kind of filter consists of a tube with an axial magnetic field. The plasma flux is guided through the tube by the magnetic field, whereas the massive macroparticles [1], which are ejected mostly at large angles with respect to the cathode surface, bounce or stick on the duct walls. The tube can be a straight tube (rectilinear filter) [4, 5, 6] or a curved one [7, 8, 9]. The main drawback of these filters is the ion losses along the filter, producing a significantly re-duction in the deposition rate. For this reason, it is important to understand the mechanism of these losses, in order to op-timize the filtering system.
In this work we study the plasma transport in a recti-linear filter with insulating walls. The plasma ion current and the floating potential of a collector located at different axial positions along the filter, and for different magnetic fi-eld intensities are measured. Also, the way the fifi-eld affects
the discharge parameters (arc voltage and arc current) is stu-died. The experimental data are compared with a simple conical model for the cathodic ion emission [6], and a good agreement with the measurements is found.
2
Experimental setup
A schematic of the experimental apparatus (PROTO 2CC) is shown in Fig. 1. The arc was pulsed for 35 ms, with a peak current of 400 A. It was produced by discharging an electrolytic capacitor bank with C = 0.075 F, connected to a series inductor-resistor (L = 2 mH, R = 0.33Ω), which critically damped the discharge. A mechanically controlled tungsten trigger rod ignited the arc. The arc was operated in a high vacuum, with a background pressure of 0.01 Pa.
A grounded copper cathode (5 cm in length and 1 cm in diameter) was placed in front of an annular anode with an aperture of 5 cm and a length of 2 cm. The cathode la-teral surface was cover with a Pyrex insulator, so as to en-sure that the ion emission was through the front surface of the cathode. The distance between the cathode surface and the closest plane of the anode was 1 cm. At the end of the anode it was located the entrance of the magnetic duct. The magnetic field was established by three external coils wrap-ped around an insulating tube, 23 cm long and with an inner wall radiusrD of 5 cm. The coil was supplied with dc
cur-rent from an independent power source. The magnetic field strength was measured with a calibrated Hall probe, and the magnetic field intensity (B) was characterized with the value measured at the duct center. The maximum obtained mag-netic field intensity was 253 G.
1524 D. Grondonaet al.
Collector
Figure 1. Scheme of the experimental apparatus (PROTO 2CC). Insulating pieces are indicated with gray color.
The arc produced a fully-ionized plasma jet with multi-ply charged plasma ions, in particular for copper the average charge iszm = 1.85 [10]. An aluminum collector plate was
positioned perpendicular to the axis of the duct and could be moved axially along the duct. The collector plate radius (rT) was almost coincident with the duct inner radius, so the
collector plate collected nearly all the charge axially flowing along the duct. The collector plate was floating to measure the floating potential (Vfl) or it was connected to ground
th-rough a resistance to determine the ion current (Ii) from the
resistance voltage drop. The resistance value was selected enough low so as to ensure that the collector voltage was smaller thanVfl. BothIiandVflwere measured as functions
ofBat several axial distances (d) from the cathode surface. The arc voltage drop (Vac ) and the discharge current
(Id) as functions ofBwere measured using a resistive
vol-tage divider and a calibrated small-value (8x10⁻³Ω) resis-tor, respectively.
3
Results
A typical profile ofBcorresponding to a coil current of 26 A is presented in Fig. 2. It can be seen that the magnetic field strength remains almost constant along the tube, but it shar-ply drops at the duct extremes. For example, for a magnetic field of 130 G in the middle of the duct, the magnetic field at the cathode region is about 30 G. For that reason,Bat the cathode region is too small to alter the discharge parameters.
0 5 10 15 20 25 30 0
40 80 120
B
[G
]
d [cm]
Figure 2. Typical profile ofBcorresponding to a coil current of 26 A.
0 50 100 150 200 250 0
20 40 60 80 100 120
Vac
[V
]
B[G]
0 50 100 150 200 250 0
100 200 300 400 500
Id
[A
]
B[G]
a)
b)
Figure 3. Arc voltage vs. magnetic field intensity (a), and discharge current vs. magnetic field intensity (b).
In Fig. 3a) and 3b)VacandId vsBare presented,
res-pectively. Each point in the figures represents the average of five consecutive shots performed under identical conditions. It can be seen that both quantities are almost independent of
B, and take the valuesVac≈50 V andId ≈400 A.
In some discharges without magnetic field, the annular anode was changed by a disk anode, and placed in front the cathode. In these discharges the measured value ofVacwas
approximately 10 V less than in the annular configuration (
≈40 V), and this fact indicated the presence of an anodic potential drop in the annular configuration.
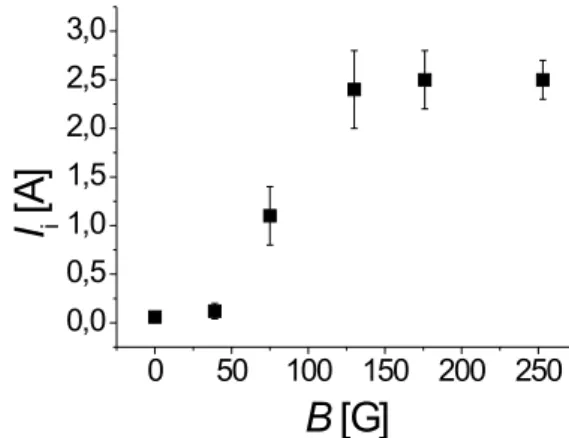
In Fig. 4 the ion saturation current as a function ofd
withB as a parameter is presented, and in Fig. 5 the ion saturation current measured at the middle of the filter (d= 14.5 cm) as a function ofBis presented. It can be seen (Fig. 4) thatIi decreases significantly withd forBvalues lower
than 130 G, but for higherBvalues, the ion current remains almost constant along the filter, with the only exception of the caseB= 130 G, where the ion current decreases signi-ficantly at the filter exit. It can also be observed from both figures thatIiincreases with the magnetic field, and in
par-ticular, it shows an abrupt growth forBvalues in the range of 50 G to 130 G, and saturates for higherBvalues.
6 8 10 12 14 16 18 20 22 24
0,0 0,5 1,0 1,5 2,0 2,5 3,0 3,5 4,0
I i(B=0 G) I
i(B=39 G) I
i(B=75 G) Ii(B=130 G) Ii(B=176 G) Ii(B=253 G)
I
i[A
]
d
[cm]
Brazilian Journal of Physics, vol. 34, no. 4B, December, 2004 1525
0 50 100 150 200 250 0,0
0,5 1,0 1,5 2,0 2,5 3,0
I
i[A
]
B
[G]
Figure 5. Ion saturation current measured at the middle of the filter (d= 14.5 cm) as a function ofB.
In Fig. 6 the collector floating potential vsdwithBas a parameter is presented. It can be seen that Vfl remains
roughly constant along the filter and shows an increase with the magnetic field value. In Fig. 7 the collector floating po-tential measured at the middle of the filter as a function ofB
is presented. It can be seen thatVfl slightly increases withB
up toBvalues of 130 G, and then remains almost constant (Vfl= 29±2 V) for higherBvalues. This behavior could be
related to slight variations of the plasma potential (of the or-der of the anode potential) withB, although it is difficult to establish any correlation between both potentials due to the experimental uncertainties.
6 8 10 12 14 16 18 20 22 24
0 5 10 15 20 25 30 35
B=0 Gauss B=39 Gauss B=75 Gauss B=130 Gauss B=176 Gauss B=253 Gauss
V
fl[V
]
d
[cm]
Figure 6. Collector floating potential vsdwithBas a parameter.
0 50 100 150 200 250 0
5 10 15 20 25 30 35
V
fl[V
]
B
[G]
Figure 7. Collector floating potential measured at the middle of the filter as a function ofB.
4
Discussion and final remarks
The first point to consider is an estimation of the plasma pa-rameters in the duct in terms of the presented measurements. From theIi value forB= 0 G (Ii ≈0.2 A, see Fig. 4),
as-suming that the whole probe’s area collects ions, and using Lam’s electrostatic probe theory [11], the plasma density in-side the duct can be estimated asn≈3x10¹⁰
cm−3. If it is assumed that probe’s theory remains valid for the evaluation of the ion saturation current in the presence ofB perpendicu-lar to the collecting probe surface, forB= 253 G (Iiconst.
= 2.5 A, see Fig. 4), and assuming that the whole probe’s area collects ions, the plasma density inside the duct can be estimated asn≈3x1011cm−3. From the floating potential measurements forB= 0 G, and considering that the plasma potential (Vpl) is given as the anode potential (≈50 V)
mi-nus the anodic sheath potential drop (≈10 V), (Vpl ≈40
V), the electron temperature can be estimated as Te ≈4 eV
from the same theory [11].
In order to obtain an interpretation of the measured ion current for differentdandBvalues, and following Ref [6], a simplified model for the ion emission is proposed. It is as-sumed that the ion emission with a total currentIo and with
an emission aperture angleαemerges from a virtual point P located at a certain distanceZ0 behind the cathode surface
(of radiusrc). This geometry is illustrated in Fig. 8, where
the gray zone indicates the massive cathode. The ion flow is assumed to propagate in a ballistic way along the duct, since the characteristic time for ion diffusion losses (τdif ∼0.2
r2
D/Da, where Dais the ambipolar diffusion coefficient) re-sults one order of magnitude larger than the ion transit time
ttr along the duct (τdif ∼2x10⁻⁴s;τtr ∼2x10⁻⁵s, for an
ion velocity of∼106 cm/s).
P
r
CZ
0a
a
Figure 8. Scheme of the assumed model for the ion emission. The gray zone indicates the cathode.
The ion currentIi collected by a circular plane surface
of radiusrT perpendicular to the symmetry axis and
loca-ted at a distance R from P, considering that the collector is completely covered by the ions, is:
Ii= [Io/(1−cosα)].[1−(1 +rT2/R 2
)−3/2]
where R =d + Z0 = d +rc / tan (see Fig. 8). For the
case in which the ion flux is enough collimated so that the collector is only partially covered by the ions,Iiis:
1526 D. Grondonaet al.
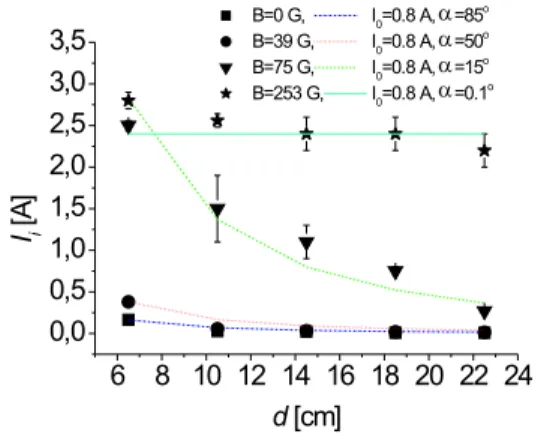
In Fig. 9 the theoreticalIi (calculated according to one
or another of the above given equations) is plotted with li-nes as a function of d forI0 = 0.8 A. The aperture angle was
varied fromα= 0.10
forB= 253 G toα= 850
forB= 0 G.
6 8 10 12 14 16 18 20 22 24
0,0 0,5 1,0 1,5 2,0 2,5 3,0 3,5
B=0 G, I0=0.8 A, =85 o B=39 G, I0=0.8 A, =50 o B=75 G, I0=0.8 A, =15 o B=253 G, I0=0.8 A, =0.1 o
Ii
[A
]
d[cm]
a a a a
Figure 9. Theoretical (lines) and experimental ion current (scatte-red points) as functions ofdforB= 0, 39, 75, and 253 G.
It can be seen from Fig. 9 that in all the cases there is a good fitting with the experimental values, indicating that the falloff of the ion current is not exponential (an exponential decay law should be expected if diffusion losses were do-minant). Note that the value ofI0 predicted by the model
is very low compared with the value of the total ion cur-rent emitted from the cathode (≈0.1Id ≈40 A). Hence an
important fraction of the ions are lost in the cathode-anode region, where the main discharge develops. After emerging from the anode aperture and entering into the filter, the atte-nuation of the ion current is due to duct-wall losses, corres-ponding to a ballistic ion flux hitting the filter walls. These duct-wall losses are smaller for large Bvalues because in these cases the ion flux is more collimated ( decreases with
B).
With the knowledge of Te, the electron and the ion
gy-roradius can be evaluated as functions ofB. The electron gyroradious is of the order of the duct radius for a very low magnetic field value (B≈2 G), so the electrons are confi-ned along the magnetic lines for all the range ofBvalues studied in this experiment. The ion gyroradious is of the or-der of the duct radius forB= 95 G (the ion temperature has been taken to be of order 0.3 eV [12], so for lower magne-tic field values, only the electrons are confined, and some
authors claimed [4, 5] that in this conditions ions are lost to the walls and hence the plasma is charged negatively. This charge induces radial electric fields in the plasma that reduce the rate of ion loses. For magnetic field values larger than 95 G, the ions are also partially confined, and a strongly de-creased plasma loss rate should be expected because of the collimating effect of Bon both kinds of particles. There-fore, a saturation ion current must be expected atB≈95 G, in good agreement with our experimental results.
Acknowledgements
This work was supported by grants from the Universidad de Buenos Aires (PID X214) and from the Agencia Nacional de Promoci´on Cient´ıfica y Tecnol´ogica (PICT 03-09491).
References
[1] R. L. Boxman, D. M. Sanders, and P. J. Martin; Handbook of Vacuum Arc Science and Technology, Fundamentals and Applications, Park Rige, NJ: Noyes, 1995
[2] C. W. Kimblin, J. Appl. Phys.44, 3074 (1973).
[3] M. Krzysztof, J. Walkowicz, and J. Bujak, Plasma & Ions3, 41 (2000).
[4] J. Storer, J. E. Galvin, and I. G. Brown, J. Appl. Phys.66, 5245 (1989).
[5] B. P. Cluggish, IEEE Trans. Plasma Sci.26, 1645 (1998). [6] H. Kelly, L. Giuliani, and F. Rausch, J. Phys. D: Appl. Phys.
36, 1980 (2003).
[7] I. I. Aksenov, V. A. Belous, V. G. Padalka, and V. M. Kho-roshikh, Sov. J. Plasma Phys.4, 425 (1978).
[8] R. L. Boxman, V. N. Zhitomirsky, B. Alterkop, E. Gidalevich, M. Keidar, and S. Goldsmith, Surf. Coat. Technol.86-87, 243 (1996).
[9] S. Anders, A. Anders, and I. Brown, J. Appl. Phys.74, 4239 (1993).
[10] J. Kutzner and H. C. Miller, J. Phys. D: Appl. Phys.25, 686 (1992).
[11] S. H. Lam, Phys. Fluids8, 73 (1965).
![Figure 2. Typical profile of B corresponding to a coil current of 26 A. 0 50 100 150 200 250020406080100120Vac[V]B[G] 0 50 100 150 200 2500100200300400500Id[A]B[G]a)b)](https://thumb-eu.123doks.com/thumbv2/123dok_br/18980111.456723/2.892.138.437.88.171/figure-typical-profile-corresponding-coil-current-vac-id.webp)