1542 Brazilian Journal of Physics, vol. 34, no. 4B, December, 2004
Great Geomagnetic Storms in the Rise and
Maximum of Solar Cycle 23
A. Dal Lago
1,2
, L. E. A. Vieira
1,2, E. Echer
1, W. D. Gonzalez
1, A. L. Cl´ua de Gonzalez
1,
F. L. Guarnieri
1, L. Balmaceda
1, J. Santos
1, M. R. da Silva
1, A. de Lucas
1, and N. J. Schuch
31
Fundac¸˜ao de Amparo `a Pesquisa do Estado de S˜ao Paulo, FAPESP, SP, Brazil
2
Instituto Nacional de Pesquisas Espaciais, S˜ao Jos´e dos Campos, SP, Brazil
3
Centro Regional Sul de Pesquisas Espaciais, Santa Maria, RS, Brazil
Received on 21 January, 2004; revised version received on 18 May, 2004
Geomagnetic storms are intervals of time when a sufficiently intense and long-lasting interplanetary convection electric field leads, through a substantial injection of energy into the magnetosphere-ionosphere system, to an intensified ring current, strong enough to exceed some key threshold of the quantifying storm time Dst index. We have studied all the 9 great magnetic storms (peak Dst<-200 nT) observed during the rise and maximum of solar cycle 23 (from 1997 to early 2001), in order to identify their solar and interplanetary causes. Apart of one storm occurred during the period without observations from the Solar and Heliospheric Observatory (SOHO), all of them were related to coronal mass ejections observed by the Large Angle and Spectroscopic Coronagraph (LASCO). The sources of interplanetary southward magnetic field, Bs, responsible for the occurrence of the storms were related to the intensified shock/sheath field, interplanetary magnetic cloud’s field, or the combina-tion of sheath-cloud or sheath-ejecta field. It called our attencombina-tion the fact that one of the events was related to a slow CME, with CME expansion speed not greater than 550 km/s. The purpose of this paper is to address the main sources of large geomagnetic disturbances using the current satellite capability available. As a general conclusion, we found that shock/sheath compressed fields are the most important interplanetary causes of great magnetic storms during this period.
1
Introduction
On one hand we have the solar wind plasma constantly flowing out of the Sun throughout interplanetary space at typical speeds of the order of 400-500 km/s, carrying the Sun’s magnetic field frozen into it, given its high conducti-vity [1]. Superposed on this ambient plasma there are tran-sient injections of material, often faster than the solar wind, and also carrying strong magnetic field, the so called co-ronal mass ejections [2]. To complete the set of structures present in the interplanetary medium, we can find the high speed solar wind streams, which have lower density than the solar wind, and travel with speeds of the order of 800 km/s, coming from the coronal holes [3]. On the other hand, we have the Earth’s magnetic field, shielding Earth from the va-riety of interplanetary structures mentioned above, forming the cavity known as magnetosphere [4]. If the solar wind magnetic field is such that its direction points anti-parallel to the Earth’s magnetic field, energy can be injected into the magnetosphere, increasing the equatorial ring current, cau-sing a geomagnetic storm [5]. Gonzalez and Tsurutani [6] found that a dawn-dusk convection electric field greater than 5 mV/m, which means 10 nT magnetic field and 420 km/s speed, lasting for at least 3 hours, is the minimum interpla-netary condition for the occurrence of an intense geomagne-tic storm, i.e. storm-time Dst index less than -100 nT. Tsu-rutani et al. [7] studied the 5 great geomagnetic storms, with Dst<-250 nT, observed in the period of 1978-1979 and they
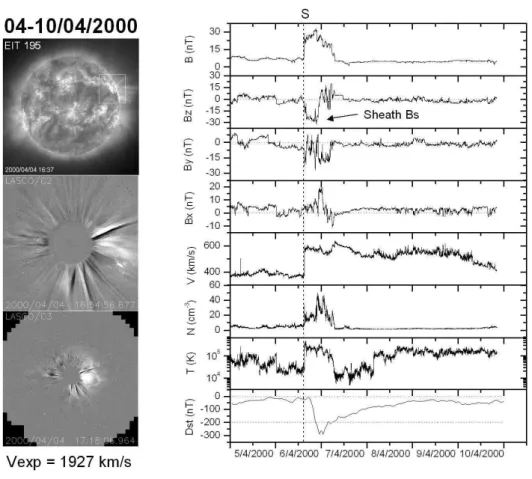
Figure 1. On the left side, from top to bottom: EIT 195 snapshot taken on April 4th (2000), at 16:37 UT showing the flare inside the rectangle; LASCO C2 and LASCO C3 snapshots taken on the same day taken at 16:54 UT and 17:18 UT showing the full halo CME. On the right side, from top to bottom: interplanetary magnetic field and its 3 components, Bz, By and Bx, solar wind (proton) speed, number density and temperature, and the Dst index for the period of April 5th to April 10th, 2000.
[10-12]. Dal Lago et al. [13] have shown that such me-chanism can double the geoeffectiveness of an interplane-tary ejecta. In this work we shall study the solar and inter-planetary causes of the 9 great geomagnetic storms obser-ved from January 1997 to April 2001. We use observations made by the Large Angle and Spectroscopic Coronagraph (LASCO), and by the Extreme Ultraviolet Imaging Teles-cope (EIT), both on board of the Solar and Heliospheric Ob-servatory (SOHO), able to image the solar corona in white light from 2 to 32 solar radii [14], combined with interpla-netary magnetic field and plasma observations made by the Advanced Composition Explorer (ACE) satellite, sitting in the L1 point, close to the Earth. By great storms, we consi-der those for which the peak of the Dst index was less than -200 nT. In the following sections we will present some of these events, illustrating the various types of solar, interpla-netary and geomagnetic characteristics.
2
April 6-7 (2000) storm
Figure 1 is a composition of solar, interplanetary and ge-omagnetic observations from the 4th to the 10th of April
1544 Brazilian Journal of Physics, vol. 34, no. 4B, December, 2004
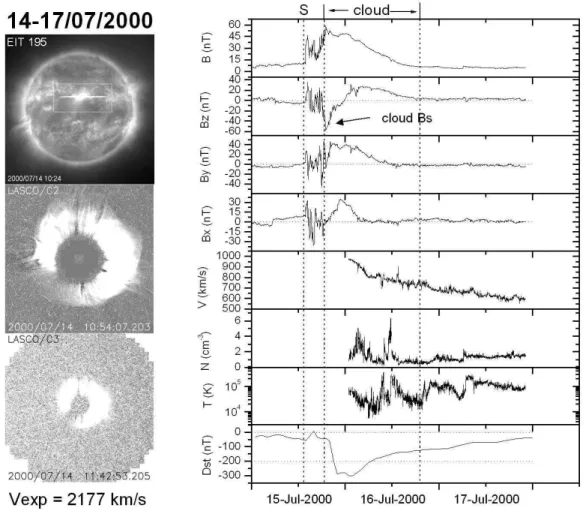
Figure 2. On the left side, from top to bottom: EIT 195 snapshot taken on July 14th (2000), at 10:24 UT showing the flare inside the rectangle; LASCO C2 and LASCO C3 snapshots taken on the same day taken at 10:54 UT and 11:42 UT showing the full halo CME. On the right side, from top to bottom: interplanetary magnetic field and its 3 components, Bz, By and Bx, solar wind (proton) speed, number density and temperature, and the Dst index for the period of July 15th to July 17th, 2000.
3
July 15-16 (2000) storm
Figure 2 is the same as Figure 1 but for the period of 14-17 of July, 2000, and it shows the very well know ”Bastilla event”. It consists of an interplanetary shock driven by a magnetic cloud, whose intense magnetic field ( 50 nT) rota-tes from south to north smoothly. While pointing southward, it causes a very intense fall in the Dst index, reaching its mi-nimum of -300 nT. EIT showed that a flare occurred on July 14th, at central meridian, heliographic position N17E01, from AR9077 (Figure 2, top left). The interplanetary shock at 1 AU indicated by the ”S” line in Fig. 2 could only be identified in the magnetic field data, because the plasma de-tector aboard ACE suffered a temporary black-out as a con-sequence of the flare accelerated particles. Associated with this flare was a full halo CME, observed by the LASCO ins-trument, with an expansion speed of 2177 km/s, shown on the same figure on the middle and bottom left panels.
4
October 22nd (1999) storm
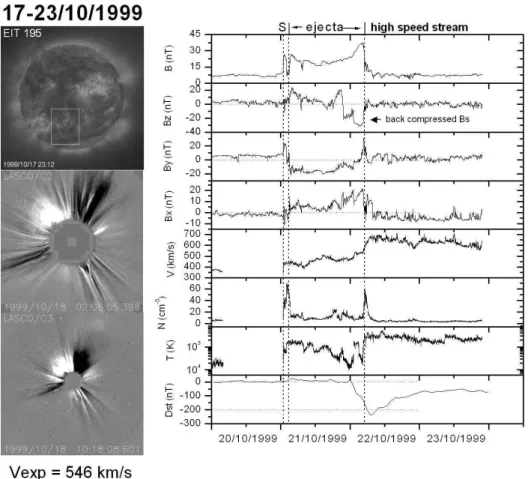
speed of 546 km/s, which is considered a slow speed, very close to the normal solar wind speed. Also, this CME was not very much traveling towards Earth because it was a par-tial halo CME, i.e. its main propagation direction was was a partial halo CME, i.e. its main propagation direction was
considerably out of the Sun-Earth direction. Nevertheless, it caused a very intense geomagnetic storm. This event is unique in the group, and our conclusion is that the cause of the storm was mostly interplanetary interactions, rather than solar.
Figure 3. On the left side, from top to bottom: EIT 195 snapshot taken on October 17th (1999), at 23:12 UT showing the flare inside the rectangle; LASCO C2 and LASCO C3 snapshots taken on October 18th (1999) at 02:06 UT and 10:18 UT showing the partial halo CME. On the right side, from top to bottom: interplanetary magnetic field and its 3 components, Bz, By and Bx, solar wind (proton) speed, number density and temperature, and the Dst index for the period of October 20th to October 23th, 1999.
5
Summary and conclusions
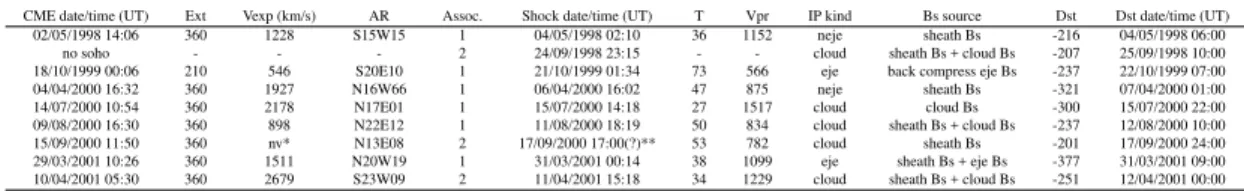
Table I gives information about the 9 events considered in this paper, indicating their solar and interplanetary characte-ristics, as well as the corresponding geomagnetic effect. For each event, peak Dst values as well as date and time of their occurrences are indicated in the “Dst” and “Dst date/time (UT)” columns, respectively. The solar origins of these events were related to CMEs at the Sun in all cases, with the exception of the September 24-25th (1998) event for which there were no SOHO observations. Out of 8 CMEs, 7 were full halos, spanning all around the solar disk, indicated by the “360” in the “Ext” column, which means these CMEs had substantially component of their main propagation di-rection lying on the Sun-Earth line. Only one CME was par-tial, the one observed on October 18th (1999). Observing the CME expansion speeds measured in the LASCO
1546 Brazilian Journal of Physics, vol. 34, no. 4B, December, 2004
TABLE I. Solar, interplanetary and geomagnetic parameters form the 9 great geomagnetic storms occurred in the period of January 1997 to April 2001.
CME date/time (UT) Ext Vexp (km/s) AR Assoc. Shock date/time (UT) T Vpr IP kind Bs source Dst Dst date/time (UT) 02/05/1998 14:06 360 1228 S15W15 1 04/05/1998 02:10 36 1152 neje sheath Bs -216 04/05/1998 06:00 no soho - - - 2 24/09/1998 23:15 - - cloud sheath Bs + cloud Bs -207 25/09/1998 10:00 18/10/1999 00:06 210 546 S20E10 1 21/10/1999 01:34 73 566 eje back compress eje Bs -237 22/10/1999 07:00 04/04/2000 16:32 360 1927 N16W66 1 06/04/2000 16:02 47 875 neje sheath Bs -321 07/04/2000 01:00 14/07/2000 10:54 360 2178 N17E01 1 15/07/2000 14:18 27 1517 cloud cloud Bs -300 15/07/2000 22:00 09/08/2000 16:30 360 898 N22E12 1 11/08/2000 18:19 50 834 cloud sheath Bs + cloud Bs -237 12/08/2000 10:00 15/09/2000 11:50 360 nv* N13E08 2 17/09/2000 17:00(?)** 53 782 cloud sheath Bs -201 17/09/2000 24:00 29/03/2001 10:26 360 1511 N20W19 1 31/03/2001 00:14 38 1099 eje sheath Bs + eje Bs -377 31/03/2001 09:00 10/04/2001 05:30 360 2679 S23W09 2 11/04/2001 15:18 34 1229 cloud sheath Bs + cloud Bs -251 12/04/2001 00:00
* CME was not visible enough to enable the expansion speed measurement. ** not a clear shock, lack of discontinuity in the parameters.
Symbols are: 1 = unequivocal association between a CME and an interplanetary event; 2 = possible association between a CME and an interplanetary event; neje = not an interplanetary ejecta structure of any kind; eje = definitely an interplanetary ejecta but not defined; cloud = interplanetary ejecta of the magnetic cloud type according to Burlaga et al. [8].
as defined by Burlaga et al. [8], indicated in the column “IP Kind” as “cloud”, 2 were interplanetary ejecta without the signature of magnetic cloud, indicated by “eje” in this same column, and the other 2 were only compressed sheath regi-ons, as a consequence of an interplanetary shock passage, indicated by “neje”. The column “Bs source” indicates the various sources of southward interplanetary magnetic field responsible for the occurrence of each storm. Four sources were found, as follow: (1) shock sheath compressed field in 3 events; (2) shock sheath compressed field combined with internal ejecta field in 4 events; (3) internal ejecta field alone in 1 event; (4) internal ejecta magnetic field compressed by a high speed stream solar wind following the ejecta in 1 event. Thus, our main conclusion is that sheath compressed fields, caused by interplanetary shocks, are present in 7 out of 9 great magnetic storms, and are the most important interpla-netary source of these very intense storms. This conclusion was similar to the one obtained by Tsurutani et al. [7] when analyzing the great magnetic storms observed in the period of 1978-1979. Watari et al. [17] also reached a similar con-clusion, but for all intense geomagnetic storms (peak Dst <-100 nT). When comparing our results with Tsurutani et al. [7], the most significant difference is the October 18-23th (1999) event, because it was caused by an interaction between an ejecta and a high speed stream following it.
Acknowledgements
The authors would like to acknowledge Fundac¸˜ao de Amparo a Pesquisa do Estado de S˜ao Paulo (FAPESP) of Brazil for supporting A. Dal Lago and L. E. A. Vieira under the projects 02/14150-0 and 02/12723-2. The authors would also like to acknowledge SOHO/EIT and SOHO/LASCO work teams for making the data available, N. Ness (Bartol Research Institute) for providing ACE magnetic field data, D. J. McComas (SWRI) for providing ACE plasma data, both through CDAWeb, and WDC-Kyoto for providing the Dst index. SOHO is an international cooperation between NASA and ESA.
References
[1] J. C. Brandt,Introduction to the solar wind. San Francisco (1970).
[2] A. J. Hunduhausen,An introduction. Coronal mass ejections, Washington, DC (1997).
[3] R. Schwenn,Large-scale structure of the interplanetary me-dium, Chapter 1, Physics of the Inner Heliosphere, Springer-Verlag, Berlin-Heidelberg(1990).
[4] M. G. Kivelson, and C. T. Russell,Introduction to Space Phy-sics,Cambridge University Press, New York (1995). [5] W. D. Gonzalez, J. A. Joselyn, Y.Kamide, H. W. Kroehl, G.
Rostoker, B. T. Tsurutani, and V. M. Vasyliunas, J. Geophys. Res.99, 5771 (1994).
[6] W. D. Gonzalez, B. T. Tsurutani, Planet. Space Sci.35, 1101 (1987).
[7] B. T. Tsurutani, W. D. Gonzalez, F. Tang, and Y. T. Lee, Ge-ophys. Res. Lett.19, 73 (1992).
[8] L. F. Burlaga, E. Sittler, F. Mariani, and R. Schwenn, J. Ge-ophys. Res.86, 6673 (1981).
[9] H. Goldstein, On the field configuration in magnetic clouds. In Solar Wind Five, NASA Conf. Publ. 2280, Washington DC(1983).
[10] L. F. Burlaga, K. W. Behannon, and L. W. Klein, J. Geophys. Res.92, 5725 (1987).
[11] V. Bothmer, and R. Schwenn, J. Geomag. Geoelectr.47, 1127 (1995).
[12] A. Dal Lago, W. D. Gonzalez, A. L. Clua de Gonzalez, and L. E. Vieira, J. Atm. Solar Terr. Phys.63, 451 (2001).
[13] A. Dal Lago, W. D. Gonzalez, A. L. C. de Gonzalez, and L. E. Vieira, Adv. Space Res.30, 2225 (2002).
[14] G. E. Brueckner, R. A. Howard, M. J. Koomen, C. M. Ko-rendyke, D. J. Michels, J. D. Moses, D. G. Socker, K. P. Dere, P. L. Lamy, A. Llebaria, M. V. Bout, G. M. Simnett, D. K. Bedford, and C. J. Eyles, Solar Phys.,162, 357 (1995).
[15] R. Schwenn, A. Dal Lago, W. D. Gonzalez, E. Huttunen, C. O. St. Cyr, and S. P. Plunkett, A tool for improved space weather predictions: the CME expansion speed, Eos Trans. AGU, 82, 47, Fall Meet. Suppl., Abstract SH12A-0739(2001).
[16] A. Dal Lago, R. Schwenn, and W. D. Gonzalez, Adv. Space Res.32, 2637 (2003).