Neutron Correlations with Electrical Measurements in a Plasma Focus Device
H. Bruzzone1, H. Acu˜na1, and A. Clausse2
1 Universidad de Mar del Plata and CONICET, 7600 Mar del Plata, Argentina 2CNEA-CONICET and Universidad Nacional del Centro, 7000 Tandil, Argentina
Received on 22 October, 2007
The measurement of the voltage between electrodes and the discharge current time derivative in Plasma Focus devices can be used to obtain important information on the neutron-producing pinch stage of the mentioned devices. The analysis of a 60-shots experimental run in a 5.7 kJ Mather-type device results in correlations suggesting that the neutron yield depends mostly on the average energy per particle delivered to the plasma during the pinch stage.
Keywords: Plasma Focus; Neutrons; Signal Processing; Plasma Diagnostics
I. INTRODUCTION
Plasma Focus (PF) devices are a special type of pulsed, coaxial, microsecond gas discharges which manage to pro-duce plasma conditions such that energetic radiation is emit-ted (X rays, ions and electrons beams and, if filled with Deu-terium or DeuDeu-terium-Tritium, fusion neutrons). Since their discovery around 1960 by N. V. Filippov (Petrov et al 1960) and J. W. Mather (1965), PF devices have been studied in many laboratories throughout the world, but nevertheless the physical processes underlying its behavior are still a matter of controversy. It is known that an optimal filling pressure value exists for any device at which the neutron yieldYnattains its maximum value, however, there is not yet a conclusive agree-ment regarding the reasons for the existence of such optimum pressure (the na¨ıve concept of requiring that the pinch occurs at maximum discharge current simply does not hold in most of the experimental situations). Moreover, it is neither under-stood why the numerous attempts to achieve neutron yields higher than≈1012per shot were fruitless. It is known that, in all the devices,Ynvalues fluctuate on a shot to shot basis under apparently identical operating conditions (electrodes geome-try, voltage, pressure); but it is not clear why this is so. Fi-nally, whether the neutrons are produced by a thermal plasma, a beam of high-energy deuterons, or a mix of both, is still a debated question (Zakaullahet. al2001). Hence, a lot of sys-tematic work on these devices is still needed to reach a proper understanding of their functioning, and further take advantage of their multiple potential applications.
This article reports a technique of acquiring knowledge on plasma properties more closely related to the neutron produc-tion than the mere “external” parameters like bank energy or peak discharge current, which can be evaluated from relatively simple measurements of the discharge current and voltage be-tween the electrodes. The technique is applied for analyzing a set of 60 shots performed at 6 different D2filling pressures in a relatively small PF device at fixed bank energy in an attempt to find some insight into the shot to shot variations and on the pressure dependence of the neutron yield.
II. DIRECT EMPIRICAL CORRELATIONS
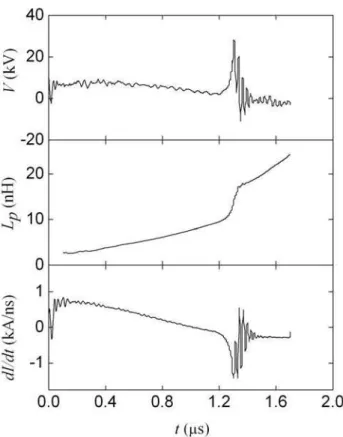
Bruzzoneet al(2006) showed that using measurements of the voltage on the collector plates of a PF device,V(t), and the time derivative of the discharge current,dI/dt, the inductance of the plasma-coaxial electrodes system,Lp(t), can be deter-mined. Using this technique,Lpwas determined in a 30 kV, 12.6µF, PF device (inner electrode radiusa = 1.8 cm, outer electrode radiusb= 3.6 cm, electrodes lengthd = 10 cm) op-erating at 6 different pressure values (po= 1, 2, 3, 4, 5 and 6 mbar). Plots of the experimental data ofV(t),dI/dtand the correspondingLp(t)are shown in Fig. 1 for a shot performed at 2.10 mbar. It can be seen that the pinch stage, recognized by the dip indI/dtand the spike inV(t),is accompanied by a sud-den rise inLp(t).The value ofLpjust before the jump (later on calledLcoax) is about 10.5 nH, is rather invariant for all the shots and pressures, and matches well with the inductance of the electrodes system closed at its end by a bullet shaped current sheet. The values of the inductance jump associated with the pinch stage,∆Lp, change from shot to shot, but are in reasonable agreement with those expected of a typical pinch column.
The determination of Lp(t)from the electrical signals is based on two assumptions, namely, that a single current sheet exists within the electrodes and that no relevant resistance ex-ists in the plasma. Regarding the first assumption, experimen-tal evidence was presented in a few papers sustaining the pres-ence of a secondary current sheet (so called leakage currents). However, it should be also stressed that this is not an universal feature of PF devices. In particular, in the present experiment the existence of leakage currents is not consistent with the fact that the determined values ofLp(t)agree fairly well with those expected for a single sheet. On the other hand, the existence of so called anomalous resistances is a controversial issue. Up to now there is no direct measurements of such resistance, the references found in the literature claiming its existence being based mainly on theoretical speculations and indirect experi-ments. In any case, as discussed in Bruzzoneet al(2006), the values of∆Lpfound in the present experiment are consistent with those expected for a typical pinch column, so that there is no reason to consider eventual anomalous resistivities.
pres-FIG. 1: Voltage on the collector plates,V(t), time derivative of the discharge current,dI/dt, and inductance of the plasma-coaxial elec-trodes system,Lp(t), operating at 2.10 mbar.
sure values mentioned above, ten consecutive shots were per-formed before evacuating the vacuum chamber. The exper-iment was performed using a fore-diffusion vacuum pumps system, which provided a base vacuum well below 10−5mbar. After several days of pumping, the chamber leakage was con-trolled and found well below the 0.1 mbar range after several hours (a time interval smaller that that required to make 10 shots). The chamber was previously conditioned by numer-ous preliminary shots performed in Deuterium without break-ing the vacuum, in order to ensure that the adsorbed gas in the chamber walls and electrodes was essentially Deuterium. The pressure variations found after each shot were “jumps” natured (the rise in pressure, if any, takes place immediately after the shot without further changes), as expected from out-gassing due to plasma-wall interactions. Furthermore, the as-sumption that Deuterium is the main component of the pres-sure increase is supported by the fact that in every series the largest neutron yield never occurred at the first shot (i.e.the one performed on the purest gas) but about the middle of the series, which would have not been the case if the pressure in-creased due to contamination with other gases. In any case, we want to stress the fact that the fluctuation in the neutron yield on a shot to shot basis at fixed pressure values is a stan-dard PF devices behavior even changing the gas every shot.
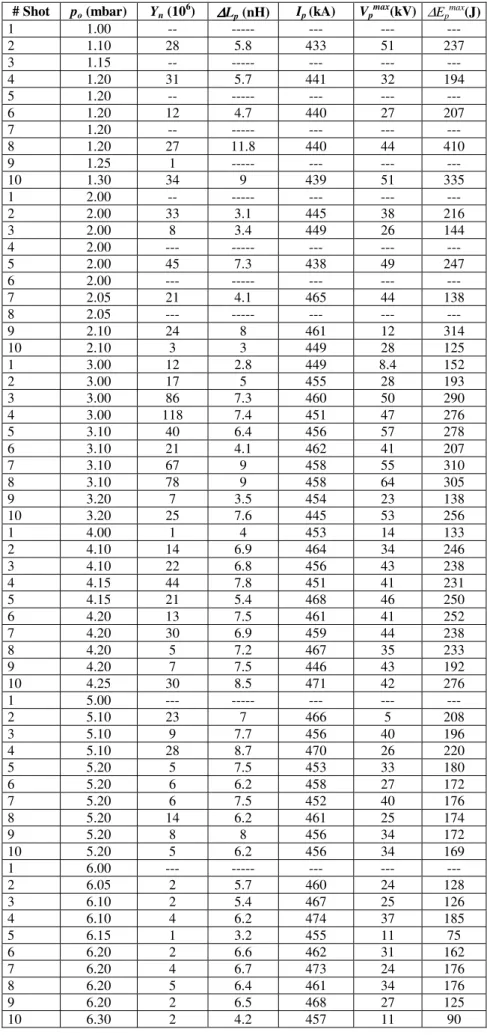
Table 1 presents the values ofpo,Yn,∆Lpand the current Ipat the start of the pinch formation, for each shot. Absence of data means that for this shot, neither dip indI/dt, nor peak
inV(t)nor neutrons were observed. Plots of the pressure de-pendence of the averageYnand the maximumYmax
n neutron yields are given in Fig. 2. It can be seen that both present a maximum at 3 mbar in this particular device.
Bernardet al(1977) found that the average neutron yield correlates with the average pinch current asIp3.3. This corre-lation was obtained using data from several different devices operating in their optimized configuration (that is, that yield-ing the highest neutron yield). It is then reasonable to search for a correlation between the values ofYnandIpin every shot. Fig. 3 shows how the individual shot pairs(Yn,Ip)distribute. It can be seen that there is a certain regularity, however the correlation coefficient between both is just 0.25.
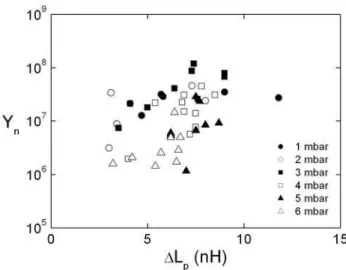
There is a physical reason to correlateYnwith∆Lp, based on the fact that larger pinch-inductance jumps strongly sug-gest larger pinch lengths (the logarithm dependence on radius is to weak to account for the differences), which would imply either larger thermonuclear reacting-plasma volumes and/or larger paths for deuteron beams. Fig. 4 shows the distribution of the individual shot pairs(Yn,∆Lp). It can be seen that the relation between both variables is also weak, and the correla-tion coefficient betweenYnwith∆Lpis barely 0.37.
III. ENERGY CONSIDERATIONS
Better information can be extracted from the measurements by introducing some processing and analysis of the electri-cal signals. After the coaxial stage the discharge can be de-scribed by the equivalent circuit shown in Fig. 5. L′0 is a fixed external inductance due to the back plate connections, Lp=Lcoax+L′p(t)is the electrodes-plasma inductance, and L′p(t)is the additional inductance produced by the collapsing current sheet. The voltage between the electrodes is accord-ingly given by:
V(t) = (L′o+Lcoax)dIdt+dtd(L′pI) = (L′o+Lcoax)dIdt+Vp(t)
(1)
whereVp(t)is the voltage drop on the collapsing current sheet and subsequent pinch. Therefore,Vpcan be determined from the measured values ofV(t), dI/dt, L′o (= 6.2±0.2 nH) and Lcoax. Furthermore, multiplyingV(t)by I(t)and integrating between the end of the coaxial run, tc, and any timet ¿tc one obtains the corresponding energy delivered to this portion of the circuit,∆E(t)as
∆E(t) =1 2
L′o+Lcoax I2(t)−I2(tc)
+
t
tc
IdIL′p (2)
The first term is the magnetic-energy variation in the fixed inductances,∆Em, whereas noting thatL′
TABLE 1. Experimental log (Absence of data means that for this shot, neither dip indI/dt, nor peak inV(t)nor neutrons were observed).
# Shot po (mbar) Yn (10
6 )
∆ ∆ ∆
∆Lp(nH) Ip(kA) Vp
max
(kV) ∆Ep
max (J)
1 1.00 -- --- --- ---
---2 1.10 28 5.8 433 51 237
3 1.15 -- --- --- ---
---4 1.20 31 5.7 441 32 194
5 1.20 -- --- --- ---
---6 1.20 12 4.7 440 27 207
7 1.20 -- --- --- ---
---8 1.20 27 11.8 440 44 410
9 1.25 1 --- --- --- ---
10 1.30 34 9 439 51 335
1 2.00 -- --- --- ---
---2 ---2.00 33 3.1 445 38 216
3 2.00 8 3.4 449 26 144
4 2.00 --- --- --- ---
---5 2.00 45 7.3 438 49 247
6 2.00 --- --- --- ---
---7 2.05 21 4.1 465 44 138
8 2.05 --- --- --- ---
---9 2.10 24 8 461 12 314
10 2.10 3 3 449 28 125
1 3.00 12 2.8 449 8.4 152
2 3.00 17 5 455 28 193
3 3.00 86 7.3 460 50 290
4 3.00 118 7.4 451 47 276
5 3.10 40 6.4 456 57 278
6 3.10 21 4.1 462 41 207
7 3.10 67 9 458 55 310
8 3.10 78 9 458 64 305
9 3.20 7 3.5 454 23 138
10 3.20 25 7.6 445 53 256
1 4.00 1 4 453 14 133
2 4.10 14 6.9 464 34 246
3 4.10 22 6.8 456 43 238
4 4.15 44 7.8 451 41 231
5 4.15 21 5.4 468 46 250
6 4.20 13 7.5 461 41 252
7 4.20 30 6.9 459 44 238
8 4.20 5 7.2 467 35 233
9 4.20 7 7.5 446 43 192
10 4.25 30 8.5 471 42 276
1 5.00 --- --- --- ---
---2 5.10 23 7 466 5 208
3 5.10 9 7.7 456 40 196
4 5.10 28 8.7 470 26 220
5 5.20 5 7.5 453 33 180
6 5.20 6 6.2 458 27 172
7 5.20 6 7.5 452 40 176
8 5.20 14 6.2 461 25 174
9 5.20 8 8 456 34 172
10 5.20 5 6.2 456 34 169
1 6.00 --- --- --- ---
---2 6.05 2 5.7 460 24 128
3 6.10 2 5.4 467 25 126
4 6.10 4 6.2 474 37 185
5 6.15 1 3.2 455 11 75
6 6.20 2 6.6 462 31 162
7 6.20 4 6.7 473 24 176
8 6.20 5 6.4 461 34 176
9 6.20 2 6.5 468 27 125
FIG. 2: Dependence of the average and maximum measured neutron yield on the filling D2pressure.
FIG. 3: Neutron yield and current value at the start of the pinch for-mation in each neutronic shot.
∆E(t) =∆Em+1 2L
′ pI2(t) +
1 2
t
tc
I2dL′p (3)
The second and third term are the magnetic-energy varia-tion in the plasma variable inductance and the electromechan-ical work done on the pinch (Bruzzoneet al(1976)),∆Ep, that is:
∆Ep(t) =1 2
t
tc
I2dL′p (4)
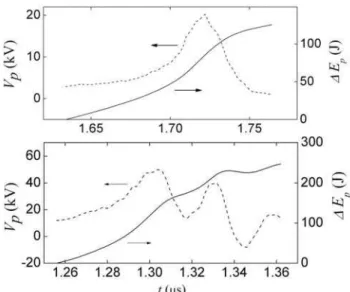
Figure 6 shows, as examples,Vp(t)and∆Ep(t)evaluated for shots at 2.10 and 6.10 mbar. Values ofVpand∆Epwere
FIG. 4: Neutron yield and pinch-inductance jump in each neutronic shot.
FIG. 5: Equivalent circuit after the end of the coaxial stage.
calculated for each shot displaying both a dip indI/dtand a measurable neutron yield. A standard pattern was found:Vp goes through a maximum value, and∆Epincreases monotoni-cally during the pinch phase up to a value∆Emax
p , which is de-fined as the value of∆Epat the time theLpjump ends (which coincides with the end of the peaks inV(t)anddI/dt). It is important to note that the values ofVpexperimentally deter-mined using this procedure are a sound measurement of the voltage drop on the pinch column,independently of the phys-ical interpretation of the nature of such drop. In fact, even if the physical cause of the dip indI/dtshould be assigned to a resistive phenomena instead of an inductive one (i.e., that the last term in the right hand side of Eq.(1) could be alternatively written as a resistance times the current instead of the time derivative of a magnetic flux) the evaluation ofVpis just the same. Hence, the values of pinch voltages presented in this work are not theory dependent.
It is reasonable to explore a correlation between and the neutron yield, since the pinch voltage can be related to the en-ergy and intensity of eventual deuteron beams. On the other hand, ∆Emax
p , is the thermal and eventually kinetic plasma flow energy delivered to the particles trapped inside the pinch, related to thermonuclear yields. In Table 1, the values of and ∆Emax
p are given for each neutronic shot. Plots ofYnvsVpmax andYnvs∆Emaxp are given in the Figures 7 and 8, respectively. Using these parameters, the correlation coefficients improve: they are 0.66 in the case ofVpmaxand 0.63 in the case of∆Emax
ex-FIG. 6: Voltage between electrodes and electromechanical work over the pinch (upper 6.10 mbar, lower 2.10 mbar).
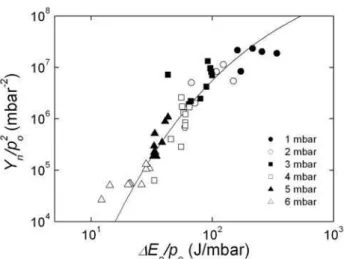
pected yield to other plasma parameters. Using them (see Ap-pendix 1) one can obtain possible dependences of the yield in both cases. In the thermonuclear scenario, a dependence of Yn/p2owithε=∆Emax
p /pois expected, while in a simple beam-target one a dependence ofYn/powithVpmaxshould hold. The details are given in the Appendix 1, and using the data pre-sented in this work, the correlation coefficient for the ther-monuclear case is 0.79 while that of the simple beam target case is 0.30.
IV. CONCLUSIONS
Using standard voltage and discharge-current time deriva-tive measurements, it is possible to determine, in any PF shot, the CS-electrodes system inductance and from it, in neutron producing shots, relevant physical magnitudes like∆Lp,Vmax
p and∆Epinchp /po. The determination of the variable inductance of a PF discharge from simple voltage and discharge current time derivative measurements allows them for a deeper insight of the device behavior in any shot, and becomes an interesting diagnostic technique for the study of these devices.
Comparisons between these parameters and the neutron production in a systematic 60-shots experimental run on a small PF device yielded poor correlations with Ipand∆Lp. Hence, neither the shot to shot fluctuations at fixed pressure nor the variations in yield with the pressure can be explained in terms of these parameters. A somewhat better correlation of the neutron yield withVmax
p and∆Emaxp was found, suggest-ing that these parameters are more directly related to the neu-tron production. The best correlation found was withε, pro-portional to the energy delivered per particle during the pinch stage. Due to the fact thatεcan be reasonably assumed to be proportional to the average ion temperature in the pinch, the data set analyzed in this work is more consistent with a
ther-monuclear scenario than with a beam-target picture. However, the beam-target model presented in this article is just a possi-ble scenario, and other more complex models have been pro-posed (J¨ager and Herold 1987). Anyhow, it should be stressed that although the present diagnostic introduces new and in-teresting information, the results have not enough breadth to allow for any general conclusion on the neutron generation mechanism.
The patterns found and reported in this paper can be useful to guide future efforts toward the complete understanding of the physical mechanisms involved in the radiation emissions from Plasma Focus discharges. It is in fact surprising that a relative small data set can reveal interesting dependences among physically meaningful magnitudes. These results are encouraging in the sense that future experimental studies can unveil more interesting correlations.
V. APPENDIX 1
Thermonuclear neutron yield per pair of particles
Assuming that neutrons are produced by thermonuclear re-actions in the pinch, the neutron yield is given by [Clausseet al1998]:
Y=1
2
∆t
n2<σv>V dt A1 wheren is the deuteron density in the pinch,<σv>is the thermal cross section, andV and∆tare the volume and dura-tion of the pinch. Morenoet al[2000] have shown that under certain assumptions about the averages, Eq. (A1) leads to:
Y N2
2 =
<σv>B ∆t VB
∝T5/12 B exp
−
TB T∗
−1/3
A2
whereNis the number of deuterons in the pinch, the subindex Bstands for the Bennett condition,T is the temperature, and T∗is a constant parameter of the Deuterons fusion cross sec-tion (a “temperature” corresponding to 6.6 MeV).
Assuming thatN is proportional topo(the number of par-ticles entailed into the pinch should increase linearly with the neutral filling density), the magnitudeε=∆Emax
p
poshould be proportional to the energy per particle which, if the ki-netic energy of plasma movements can be disregarded, is ac-tually the temperature. One can then explore the correlation ofYn
p2o(which is proportional to the yield per particle pair) withε. Fig. A1 shows the experimental points depicted in the planeYn
p2 o,
ε. The curve appearing in the graphic corre-sponds to the best fit of the function:
Yn p2 o
=Aε5/12 exp
−
ε
εo −1/3
A3
FIG.1A. Correlation between the neutron yield per particle pair and the energy per particle delivered to the pinch.
FIG.2A. Correlation between the neutron yield per particle and the maximum pinch voltage.
0.79. The best estimates of the constant parameters of the formula are:
A= 1.07 1011mbar−2(J/mbar)−5/12 εo= 58000 J/mbar
which in principle should be related to physical properties and to specific features of the device.
Beam-target neutron yield per particle
Assuming that neutrons are produced by beam-target reac-tions in the pinch, the neutron yield should go as:
Ybt∝Niλno A4
whereNiis the number of accelerated ions,nois the density in the plasma (i.e.the average pinch density), andλis the mean free path of an ion. The latter is proportional to 1/no[Huba 2006]. Assuming thatNi is proportional tonoand thatnois proportional to the filling pressurepo, it can be concluded that Ybt∝po.
Figure A2 shows the distribution of the experimental points on the planeYpo,Vmax
p
. It can be seen that the visual cor-relation is much weaker than that in Fig. A1. Ybt follows an exponential dependence respect to the accelerating voltage,V, that is [McCall 1989]:
Ybt po
∝ λviV−1exp
−VA01.5 ∝exp
−VA01.5 A5
wherevi is the velocity of the accelerated ions −− propor-tional to√V −−,λis the mean free path−−proportional to vi−−, andA1equals 1500 in mks units.
The curve shown in Fig. 8 corresponds to the best fit of Eq. A5, that is:
Yn po
=1.3 1010mbar−1exp
−VA01.5 (5)
The corresponding correlation factor is 0.30.
[1] A. Bernard, P. Cloth, H. Conrads, A. Coudeville, C. Gourlan, A. Jolas, C. Maisonnier, J.P. Rager, Nucl. Instr. and Meth.145, 191 (1977).
[2] A. Bernard, H. Bruzzone, P. Choi, H. Chuaqui, V. Gribkov, J. Herrera, K. Hirano, A. Krejci, S. Lee, C. Luo, F. Mezzetti, M. Sadowski, H. Schmidt, K. Ware, C. S. Wong, and V. Zoita, J. Moscow Phys. Soc.8, 93 (1998).
[3] H. Bruzzone, H. Kelly, M. Milanese, and J. Pouzo, Nuclear Fu-sion16, 870 (1976).
[4] H. Bruzzone, H. Acu˜na, M. Barbaglia, and A. Clausse, Plasma Phys. and Controll. Fusion,48, 609 (2006).
[5] A. Clausse, L. Bilbao, and H. Bruzzone, Journal of Technical Physics,39, 33 (1998).
[6] J. D. Huba, (2006)revised NRL plasma Formulary, Naval
Re-search Laboratory, Washington.
[7] V. J¨ager and H. Herold, Nuclear Fusion27, 407 (1987). [8] J. W. Mather, Phys. Fluids,8, 366 (1965).
[9] G. McCall, Phys. Rev. Lett.62, 1986 (1989).
[10] C. Moreno, H. Bruzzone, J. Mart´ınez, and A. Clausse, IEEE Transactions on Plasma Science,28, 1735 (2000).
[11] D. Petrov, N. Filippov, T. Filippova, and V. Khrabrov, (1960) Powerful pulsed gas discharges in chambers with conducting walls, in Plasma Physics and the problem of Controlled Ther-monuclear Reactions,IVp. 198-212.