THIS REPORT WAS PREPARED BY JOÃO PITEIRA, A MASTERS IN FINANCE STUDENT OF THE NOVA SCHOOL OF BUSINESS AND
ECONOMICS, EXCLUSIVELY FOR ACADEMIC PURPOSES.THIS REPORT WAS SUPERVISED BY ROSÁRIO ANDRÉ WHO REVIEWED THE VALUATION METHODOLOGY AND THE FINANCIAL MODEL. (SEE DISCLOSURES AND DISCLAIMERS AT END OF DOCUMENT)
M
ASTERS IN
F
INANCE
EQUITY RESEARCH
§ We start our coverage of Dangote Cement Plc
with a SELL recommendation based on a FY2016 Price
Target of NGN 139.50 per share, corresponding to a total return of -11.52%, already accounting for a dividend yield of 5.76% in FY2016. Our PT was achieved trough and APV valuation performed for four different future scenarios.
§ Deterioration in Nigerian macroeconomic
environment present a real challenge for cement
producers in the near future. An estimated decrease in
cement consumption of -3.5% yoy in 2015 left the industry with more than 20 million tons of excess capacity, increasing competitive pressure in the country.
§ Operations outside Africa continue to increase
its contribution to consolidated results. We expect
volumes outside Nigeria to reach 5.6mt in 2015 and grow at a CAGR of 13.2% until 2024. However, margins will tend to decrease over time, as operations are less cost-efficient.
§ We see as down side risks the expansion strategy
risks and a potential further decrease in global oil prices.
Company description
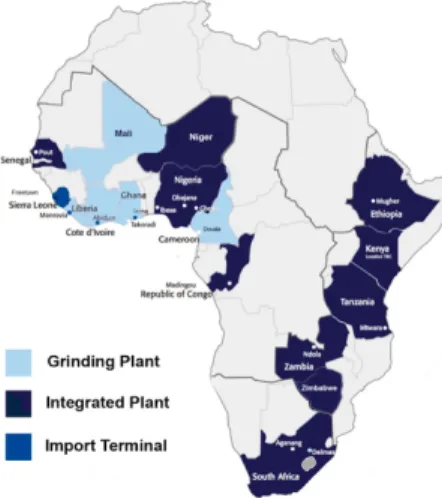
Dangote Cement Plc (DCP) is a cement manufacturer headquartered in Lagos, Nigeria and the largest company traded on the Nigerian Stock Exchange. Dangote Cement is a fully integrated quarry-to-depot producer and distributor of cement and related products in Nigeria, West and Central Africa and East and South Africa. Dangote Cement is currently Nigeria’s largest cement manufacturer and operates in 7 other African countries.
DANGOTE CEMENT PLC
COMPANY REPORT
B
UILDING
M
ATERIALS
8
J
ANUARY2016
S
TUDENT
:
J
OÃO
P
ITEIRA
[email protected]
Recommendation: SELL
Price Target FY16: 139.50 NGN
Price (as of 8-Jan-16) 170.00 NGN
Reuters: DANGCEM.LG, Bloomberg: DANGCEM:NL
52-week range (NGN) 137.17-193.33 Market Cap (NGNm) 2,675,530 Outstanding Shares (m) 17,041
Free float shares (%) 8.91
Source:Bloomberg
Source: Bloomberg
((Values in NGN millions) 2014 2015E 2016F Revenues 391,639 481,016 591,537 EBITDA 223,368 262,730 278,950 Net Profit 159,502 186,451 186,922 Profit Margin 41% 39% 32%
EPS 9,42 10,93 10,80
DPS 6,00 6,96 8,10
ROIC 22% 24% 21%
P/E (implicit) 12,54 11,8 13,2
Source: Analyst’s estimates, company data
Trying to keep margins…
..while expanding abroad
60 70 80 90 100 110 120
DANGOTE CEMENT PLC COMPANY REPORT
Table of Contents
Company Overview………..………..………..………..………3
Shareholder structure………..4
Business structure………5
Historical performance……….7
Segment analysis………..………..………..………..………8
Nigeria………..…..9
South & East Africa………18
West and Central Africa……….23
Consolidated performance………..………..………..………..……….25
Financials………..………..………..………..………26
Valuation………..………..………..………..………..26
Financial Statement………..………..………..………..………..31
DANGOTE CEMENT PLC COMPANY REPORT
Company overview
Dangote Cement Plc (DCP) is a cement manufacturer headquartered in Lagos, Nigeria and the largest company traded on the Nigerian Stock Exchange. Dangote Cement is a fully integrated quarry-to-depot producer and distributor of cement and related products in Nigeria, West and Central Africa and East and South Africa. Dangote Cement is currently Nigeria’s largest cement manufacturer and operates in 7 other African countries. Until 2018, the company expects to expand its operations to several other countries in Africa, specifically selected according to the local cement market characteristics and future macroeconomic expectations.
Company description
Dangote Cement is a subsidiary of Dangote Industries Limited, the largest industrial conglomerate in Africa, with interests in a wide range of industries, like cement manufacturing, salt and sugar refining, pasta manufacturing and real state, among others. Dangote Cement is however, the largest company of the group, accounting for more than 80% of the group’s total market capitalization. The company was founded in 1992 by the current chairman, Aliko Dangote, the wealthiest individual in Africa according to Forbes, and was originally named Obajana Cement Plc, but it changed its name to Dangote Cement Plc in July 2010 before it was listed on the Nigerian Stock Exchange (NSE) later that year, in October. Today, the company is a major player in the African cement industry, employing more than 10 thousand people across 8 African countries, divided in three business segments: Nigeria, West and Central Africa and East and South Africa. Dangote Cement Plc is currently the largest company traded on the NSE, with a market capitalization of NGN 2.68tn (US$13.4bn), as of December 2015.
Until 2011, the company operated exclusively in Nigeria, through Obajana and Gboko plants, having a total production capacity of 8.2 million tons per annum (mtpa). Since then, Dangote Cement has incurred in an aggressive expansion project across Africa. This expansion plan comprises both green field and brown field investments, depending on the countries’ specifications. Target countries are analyzed and selected according to local market characteristics (cement consumption, growth potential, competitors, neighboring countries demand), investment and political environment and raw materials reserves. In most cases, Dangote opted for the construction of brand new facilities, in other countries, like South Africa, it preferred a joint venture with a local, already established, cement operator.
23.30
4.5 2.5
0.5 0.5 0.1
-5.00 10.00 15.00 20.00 25.00
Figure 1
Figure 2-Installed capacity in Nigerian cement market by company in 2014 (mtpa)
Source: Companies data
Figure 3- Dangote Cement's expansion plan announced in Aug. 2015
DANGOTE CEMENT PLC COMPANY REPORT
In August 2015, the company announced a reinforcement of its expansion plan and signed a US$ 4.34bn contract with the Chinese construction company Sinoma International Engineering Co. Ltd for the construction of 11 new cement facilities in Africa and Nepal!
The first step of the expansion project was the opening, in 2012, of the Ibese plant in South West Nigeria, with 6mtpa capacity, and the addition of a 5mtpa production line to Obajana, making it the largest in Sub-Saharan Africa with a total capacity of 10.25mtpa. Later, in 2014, Dangote built a new production line in Gboko and began manufacturing cement outside Nigeria, through a joint venture with Sephaku Cement Company in South Africa. 2015 was a year of massive expansion for the company, with new plants being commissioned in Senegal, Cameroon, Zambia, Ethiopia and Tanzania representing an increase of 58% of production capacity, from 27.25mtpa to 43.25mtpa.
This expansion program led to a significant increase in Capital Expenditures from NGNm 59,362 in 2011 to NGNm 217,192 in 2014, corresponding to a CAGR of 54.1%. To finance these investments, Dangote has increased net debt (from NGNm 128,893 to NGNm 221,988, corresponding to a CAGR of 19.9%) and the reinvestment rate, that grew from 34.9% in 2011 to 113% in 2014. In the same way, payout ratio decline in 2011 from 29% in 2010 to 16% in 2011, increasing progressively afterwards.
Analysing the market reaction to Dangote’s main investment announcements, we can see that from the six main announcements selected, only two seem to have triggered a response, with Dangote’s stock returns increasing and deviating significantly from the NSE All Share Index. These announcements were: (1) the first in April 2011 when the company announced its first African expansion program, with stock prices increasing 4% in one week and 9% in the 4 weeks after the announcement (figure 6); and (2) in May 2013 when the beginning of the Tanzanian plant (which will believe will be a key market for Dangote) was announced, with stock price increasing 12.9% in the week that followed the declaration (figure 7).These results show that although the expansion program seems to have added value in the past, for now, the markets are not valuing the latest announcements.
Shareholder structure
Dangote Cement’s shareholder structure has remained fairly constant over the last few years. Since the bonus share issue in 2011, when the company issued 1 bonus
0 50 000 100 000 150 000 200 000 250 000
2011 2012 2013 2014
Figure 4 - DCP's yearly CAPEX (NGN)
Figure 5 - DCP's stock price and major investment announcements (NGN)
Figure 6 - DCP and NSE cumulative return from April to Jun 2011
Source: Company data
Source: Bloomberg, Company data
Source: Bloomberg, Company data
Figure 7 - DCP and NSE cumulative return from April do June 2013
DANGOTE CEMENT PLC COMPANY REPORT
90.93 % 0.16%
8.91%
Dangote Indsutries Ltd Aliko Dangote Free float
share against every 10 shares hold by the shareholders, Dangote has 17,040,507,404 outstanding shares with a NGN 0.5 face value. All shares are ordinary and of the same class, carrying the right to one vote at the Company’s Annual General Meeting. There are currently around 40.000 shareholders, being the parent company, Dangote Industries Limited (DIL) the largest, holding 90.93% of ordinary shares. The chairman, Aliko Dangote, holds 0.16% of shares and is also the owner and CEO of DIL, thus having great control over Dangote Cement. All the remaining 8.91% of ordinary shares are free floating. The low percentage of free float shares, allied with a general low liquidity of the Nigerian Stock Exchange (NSE), give Dangote’s stock a low liquidity for international standards, with a daily 6-months average volume of traded shares of 836.254, only 0.005% of total outstanding shares, well below global competitors like LafargeHolcim (0,31%), HeidelbergCement (0,36%) or even local peers like LafargeAfrica (0,03%) and CCNN (0,02%), companies with percentages of free float shares of 29,8% and 100%, respectively. However, if we look at the average value traded daily in the last 6 months, we see that in Nigeria, only Lafarge has a higher value than Dangote (USD 839,339 vs USD 703,415, respectively). The data highlights that, in spite of the low free float rate does in fact create liquidity issues, illiquidity is more a general problem in the NSE than a Dangote’s stock specific issue.
Business structure
Dangote Cement participates in all stages of the cement value chain, from the extraction of raw materials to packaging and shipping of cement. So, to fully understand Dangote’s business, it’s essential to have a complete knowledge of the manufacturing process of Portland cement, the most common type of cement in the world, and the only one produced by Dangote.
The company operates three different types of facilities: Integrated plants,
Grinding plants and Import terminals. Integrated plants include all the
manufacturing process, while the Grinding plants do not incorporate the extraction, grinding and heating of raw materials. These factories rely on the import of clinker (a sub product of the manufacturing process) from other plants, that is later grinded and mixed with gypsum. In import terminals, the imported cement is just packed in 50kg bags or poured in trucks to deliver to the final customer.
Dangote produces two different varieties of cement: 32.5R grade cement, the cheapest and most popular type, and 42.5R grade cement, sold under the brand “Dangote 3X Cement”, a more resistant cement, used for multi-story buildings construction. Although the two types of cement have some differences, namely in
In
te
g
ra
te
d
Quarry
Storage and grinding
Kiln (heating)
Storage and grinding
Packaging and Shipping
Gr
in
d
in
g
Figure 8 - DCP shareholder structure
Source: Company data
DANGOTE CEMENT PLC COMPANY REPORT Material consumed 23% Fuel & power 42% Salaries 7% Depreciation… Plant maintenance 8% Other expenses 5%
the clinker size, the production process is essentially the same for both 32.5 and 42.5 cement.
Portland Cement is composed by four basic elements: calcium, silicon, aluminium and iron. The latter three elements can be easily found in sand and clay, however, calcium must be obtained from limestone. Since large quantities of limestone are required for the manufacturing process, Dangote strategically builds its integrated factories near limestone quarries, to ensure a constant availability of the raw materials. These raw materials are then blended in the right proportion and grinded into powder that is then introduced in the kiln. The kiln is the heart of the cement making process and it’s present only in Integrated Plants. It consists in a giant cylindrical steel oven that reaches temperatures as high as 1500ºC, transforming the raw materials into clinker. This stage is the most energy consuming of the whole manufacturing process, which, considering that fuel and power expenses accounted for more than 40% of total cost of sales in 2014, makes fuel price a key cost driver. Dangote Cement uses three different types of fuel in its plants: natural gas, coal and low pour fuel oil (LPFO). Natural Gas is the cheapest among the three and is the primary fuel used in the majority of Dangote’s integrated plants, including Obajana and Ibese. Nevertheless, natural gas has some availability issues in Nigeria, and Africa in general, and so, the company relies on the other fuels as alternatives. Originally, Dangote’s plants were built to use LPFO as the primary alternative, in fact, Gboko used exclusively LPFO until this year. However, since LPFO is about 4x more expensive than gas per ton of finished cement, production costs boosted every time there was a disruption in natural gas supply. This exposure to natural gas supply is particularly evident in years of very poor gas availability, like 2014. Disruptions in gas supply led Dangote and other companies to a massive fuel switching, depleting national reserves of LPFO and forcing Dangote to import even more expensive LPFO from abroad. Consequently, fuel & power costs rose by 29%, the first increase over the 2011-2014 period, impacting the company’s profitability in 2014. In order to decrease its dependence on LPFO and the consequent production costs volatility, the company began in 2014, a modernization process, to switch its back-up fuel to coal that included the construction of coal mills in Obajana, Ibese and Gboko plants, increasing the use of coal from zero in 2014 to 9% in 9M 2015 and decreasing the use of LPFO to only 7%. The strategy has already started to pay off, reducing the fuel bill in Nigeria by 35.2% in the first nine months of 2015. According to our rough estimates, based on the Obajana gas contract established in 2011, the current international coal prices and data provided by BPI Capital Africa regarding energy consumption in Nigeria cement industry, we estimate that fuel costs per ton of cement in the Obajana plant should be around NGN 1,500 for both natural gas and coal, and
60% 63% 69% 65% 55% 58% 59% 57% 4,000 5,000 6,000 7,000 8,000 9,000 10,000 11,000 12,000 13,000 14,000 20% 30% 40% 50% 60% 70% 80%
2011 2012 2013 2014 Gross Profit margin EBITDA margin Cash costs per ton
0% 20% 40% 60% 80% 100%
Jan Feb Ma
r Ap r Ma y Ju n Ju l Au g Se p Oc t No v De c Gas LPFO 94% 2% 4%
Burning Milling Other
Figure 10 - DCP profitability measures and costs (NGN)
Source: Company data
Figure 12 – Fuel utilization in 2014 in Obajana plant
Source: Company data
Figure 13 - Fuel consumption by manufacturing stage
Source: BPI Capital Africa research
Figure 11 - DCP cost of sales breakdown
DANGOTE CEMENT PLC COMPANY REPORT
NGN 7000 for LPFO, 4.9x times higher. However, as the coal price continues to fall, it may be the cheapest fuel in the near future. Although these are rough estimates, the results are in line with the fuel and power costs per ton verified in the last years (NGN 3,644 and NGN 4,714), taking in consideration that Ibese gas contract is not so favourable and that until 2015 Gboko used exclusively LPFO.
Grinding plants cover only the last two steps of the cement manufacturing
process. This kind of facilities are not so dependent on the fuel price, since they don’t have a kiln incorporated. On the other hand, a low cost of imported clinker is critical for the profitability of these factories.
Sea transportation of cement is the cheapest way to trade cement world-wide. So, Dangote is building bulk cement import terminals near ports, in countries with a shortfall of cement supply, but where there aren’t adequate limestone reserves or the investment policies are not favourable for the construction of manufacturing plants. At the terminals, the cement that was previously shipped from another Dangote’s plant, can be directly extracted from the ships and bagged or poured into trucks. The only terminal that is currently operating is located in Tema, Ghana, due to delays in the construction of terminals in Sierra Leone and Liberia that were caused by the Ebola crisis in the region.
Historical performance
Dangote Cement was particularly successful from 2011 to 2013, experiencing significant growth in revenue and profitability. During this period, revenue, EBITDA and net profit grew at a CAGR of 26%, 31% and 29%, respectively. This was caused by an organic growth in volumes sold in Nigeria. Operations outside Nigeria had little to no impact on DCP’s performance, representing only 4% of revenues and having a negative EBITDA. Start-up costs in Senegal and Cameroon and the devaluation of the Ghanaian Cedi were the main causes of this poor performance. Volumes sold in Nigeria increased at a CAGR of 43% more than doubling, rising from 6.83 mtpa in 2011 to 14.01 mtpa in 2013.
2014 was a year of stagnation for DCP after 3 years of impressive growth. The company recorded a marginal increase in revenues of 1.41%, from NGN 386,17bn to NGN 391,64bn, still above its competitors, that experienced revenue drops between 3% and 0.1% Dangote’s poor performance was mainly due to the zero growth in revenue from Nigeria, caused by a sharp decrease in prices combined with a 11% increase in cost of sales, consequence of several disruptions in natural gas supply. In addition, the end of tax holidays in some of Dangote’s production lines in Nigeria, led to an income tax of NGN 25.19bn, when in 2013, the company benefited from a tax credit of NGN10.44bn. All these factors
19% 24%
29%
1%
55% 58%
59% 57%
0% 10% 20% 30% 40% 50% 60% 70%
100,000 150,000 200,000 250,000 300,000 350,000 400,000 450,000
2011 2012 2013 2014 Revenue Net profit Revenue growth EBITDA margin
56%
31%
0% 0%
10% 20% 30% 40% 50% 60%
0.0 5.0 10.0 15.0
2011 2012 2013 2014 A Volumes sold growth 0
2000 4000 6000 8000
Gas Coal LPFO
15% 20% 25% 30% 35% 40% 45%
2011 2012 2013 2014 ROA ROE ROI
Source: Analyst estimates, BPI capital Africa researvh
Figure 15 - DCP volumes sold and volumes growth rate (mtpa)
Source: Company datat
Figure 16 - DCP revenue, net profit and EBITDA margin (NGNm)
Source: Company data
Figure 14 - Price of finished ton of cement by fuel type
Source: Company data
DANGOTE CEMENT PLC COMPANY REPORT
contributed to a depression in DCP’s net earnings in 2014, that decreased by 21%, from NGN 201.20bn to NGN 159.50bn. Cash flows were also affected, dropping to negative ground for the first time in the 201114 period, reaching a low of NGN -41,121m in 2014 from NGN 151,066m in 2013.
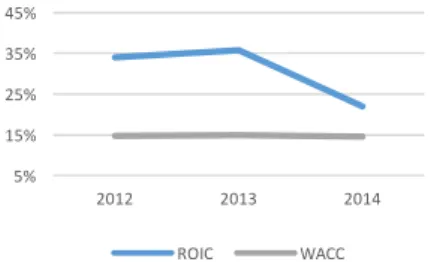
Returns on Assets, Equity and Investment all significantly in 2014 to 20%, 27% and 22% respectively, the lowest values in the 2011-14 period. In the same way, ROIC decreased in 2014 to 22% from 36% in the previous year. Despite this, Dangote was able to maintain a ROIC superior to its average cost of capital (14.6% in 2014).
In terms of stock’s performance, Dangote cement presented a cumulative return of 55% from beginning of 2011 to end of 2015, the second best performing stock among its three competitors. However, Lafarge presented a much impressive cumulative return of 142% over the same period.
Segment analysis
Dangote Cement Plc is currently divided in three distinct business units: (1) Nigeria, (2) West & Central Africa and (3) East & South Africa.
In 2014, Nigeria represented more than 90% of total revenues and 88% of the Dangote’s production capacity, but this situation has already started to change in the first 9 months of 2015, with Nigeria revenue weighting “just” 81% on group’s total. We predict that this trend will continue as the company continues to pursue its ambitious expansion plan across Africa, with Nigeria weight reaching a low of 51% in 2019.
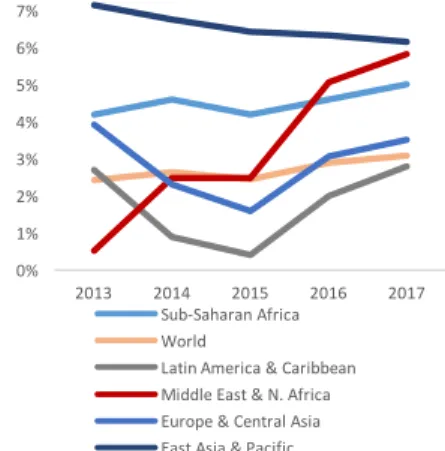
Dangote’s expansion in the continent aims to exploit the favourable macroeconomic environment in Sub-Saharan Africa while relying on economies of scale and state of the art production plants to succeed in the new markets. The region is one of the fastest growing in the planet with forecasted average real GDP growth of 4.50%pa, only behind Asia-Pacific (6.31%pa). Moreover, and although Africa has the lowest urbanisation rate in the world (40%), urban population has registered an average annual growth of 1.1% between 2010-15, a rate only lower than in Asia (1.5%) is expected to grow more than 190% until 2050, more than any other continent! In addition, a fast-growing population and the increase in public investments in several countries make Africa, and the Sub-Saharan region in particular, particularly attractive for cement manufacturers.
0 200 000 400 000 600 000 800 000 1000 000 1200 000 1400 000 1600 000
Nigeria
West and Central Africa East and South Africa Global
5% 15% 25% 35% 45%
2012 2013 2014 ROIC WACC
0 50 100 150 200 250 300 350
De
c-10
Ma
y-11
Oc
t-11
Ma
r-12
Au
g
-12
Jan
-13
Ju
n
-13
No
v-13
Ap
r-14
Se
p
-14
Fe
b
-15
Ju
l-15
Dangote Ashaka Lafarge CCNN
Figure 18 - DCP return on invested capital and average cost of capital
Source: Company data, analyst estimates
Figure 19 - Stock cumulative returns
Source: Bloomberg
Figure 20 - DCP revenue forecasts by region
DANGOTE CEMENT PLC COMPANY REPORT
10%
4.28% 6.31%
3.96% 4.54% 5.10%
3% 4% 5% 6% 7% 8% 9% 10% 11%
2009 2010 2011 2012 2013 2014 2015 2016 2017 2018 2019 2020
GDP growth (revised) GDP growth (before)
There are however significant risks associated with Dangote’s strategy. First, the widespread expansion may create significant managerial problems for the company. Second, the company’s competitive advantage in Nigeria may not be easy to replicate in other countries. This can occur not only because non-Nigerian operations are not so cost-effective but also because Dangote, given its importance in the country, has been able to influence government policies in Nigeria, which may not happen in other markets. However, to minimize this risk, Dangote’s aims to be industry leaders, in terms of market share, in all markets in order to increase its influence in policies. Finally, and although every country has its specific characteristics, there are some issues common to several nations in the continent. High inflation, currency devaluation, terrorism, corruption and the impact in commodities exporting countries of price drops and decrease in demand from China, are some of most common risks in Africa. All these risks, as well as potential market opportunities, will be analysed in this section for Nigeria and other key markets for Dangote.
Nigeria
Even though the importance of Nigeria within the group is expected to diminish over time, it represented around 80% and, according to our estimates, it will still represent 56% in 2024. Thus, it’s critical to analyze in-depth the cement market in the country and the macroeconomic prospects for the future.
Dangote currently operates three integrated plants in the country, (1) Obajana, (2) Ibese and (3) Gboko, with a combined production capacity of 29,25 mtpa. The plants are near limestone reserves expected to last 44, 77 and 29 years, respectively. According to management, a new 6 mtpa plant is planned to open in 2018.
§
Macroeconomic and political scenario
1Being a country significantly dependent on the oil industry ( accounting historically for around 70% of fiscal revenue) it is critical to have a complete understanding of the recent trends in the oil industry as well as future expectations:
The economic slowdown in China and a stagnated Europe have negatively impacted oil demand in 2014. However, Saudi Arabia, that has the largest and cheapest reserves in the world, in order to protect its market share continued its production leading to a drop in WTI crude prices from a peak of $94.58/bbl in July 2014 to $40.37/bbl in August 2015. In the short to medium term, oil prices are
1
IMF, World Economic Outlook, October 2015
NKC African Economics, Nigeria quarterly update September 2015
0% 1% 2% 3% 4% 5% 6% 7%
2013 2014 2015 2016 2017 Sub-Saharan Africa
World
Latin America & Caribbean Middle East & N. Africa Europe & Central Asia East Asia & Pacific
1.10% 1.50%
0.30% 0.30% 0.20%
0% 1% 2%
-5% 5% 15% 25% 35% 45% 55% 65% 75% 85%
Africa Asia Europe Latin Am.
North Am.
Urbanization rate Average annual change (2010-15)
Figure 22 - Urbanization rate and annual growth in urban population in 2014 by region
Source: United Nations
Figure 21 - Real GDP growth by region
Source: IMF Source: World Bank
DANGOTE CEMENT PLC COMPANY REPORT 5% 10% 15% 20% 0 5000 10000 15000 20000 25000
2011 2012 2013 2014 2015 2016 2017 2018 2019 2020
Revenue Total expenditure Revenue (% of GDP) Total expenditure (% of GDP) 26% 31% 32% 24% 15% 0% 5% 10% 15% 20% 25% 30% 35% 0 500 1,000 1,500 2,000
2011 2012 2013 2014 2015 Capital expenditure NGNbn % of aggregate expenditure 35 45 55 65 75 85 95 105 Jan -14 Ma r-14 Ma y-14 Ju l-14 Se p -14 No v-14 Jan -15 Ma r-15 Ma y-15 Ju l-15 Se p -15 No v-15
expected to remain at the recent low level or even to drop further. In December, the IMF updated the probability of WTI crude barrel price falling below $30 in the next 12 months to 24% from 7%, and the probability of Brent price falling below $30 to 19% from 6%. The fund forecasts an average per barrel price of $42.0 for 2016, $48.2 for 2017 and $52.5 for 2018. These projections are in line with other institutions’ estimates like the World Bank or the US Energy Information Agency. Besides the already discussed causes for low oil prices, Iran may play a crucial role in the industry in the near future. If Iran respects the nuclear agreement with UN, the exports ban imposed to the country may be suspend already in 2016. In this way, Iran (that has 9.3% of global reserves) can immediately export its 40 million barrels of floating storage reserves and in the medium to long-term can reach its 2011 production levels of 3.6 million barrels per day, 4% of global oil consumption. In addition, the rising tension between Iran and its political rival Saudi Arabia can decrease oil prices even further. Saudi Arabia has the incentive to drive prices down in order to not only protect its market share but also to decrease Iran’s oil revenues. However, it is worth mentioning that if this tension in the Middle East escalates for a armed conflict, then the effect on oil prices will be the opposite, with prices increasing, given the importance of Saudi Arabia (and Iran) in global oil supply.
The oil price plunge has had a negative impact on the Nigerian economy, that is now facing some challenges in the short to medium term. The country has experienced in 2015 a slowdown in economic growth, that was particularly evident in 2015 1Q, due to a nationwide anxiety around the general elections that were held in May. Although there was some recovery in the periods that followed, in October, the IMF has revised downward its GDP growth outlook for Nigeria. Real GDP growth projections lowered from 4.8% for 2015 and a CAGR of 5.49% until 2020, to 4.0% and 4.71%, respectively. A significant slowdown, considering that from 2009 to 2014, real GDP grew at a CAGR of 6.15%. These new estimates already account for the negative impact of the widely expected low oil prices in the medium term, both in the private and public sectors of the economy. The sharp decrease in revenue from the oil sector has seriously weaken government fiscal
position. In 2015, total government revenue should drop 22.5% yoy to NGN
7,351bn (7% of GDP, compared to 11% in 2014 and an average of 13% since 2011), and altough it’s expected to increase at a CAGR of 13.43% until 2020, it should only achieve 2011’s level in 2018 and should not represent more than 8% of GDP until the end of the decade. In consequence of this revenue decline, the fiscal deficit should reach 3.4% in 2015, from 2.3% in 2014, and consequently increasing public debt, in spite of the government spending adjustment. Budgeted government capital expenditure, that has a direct impact on the cement industry, Figure 24 - WTI Crude Oil Prices (USD)
Source: Bloomberg
Figure 26 - Nigerian government revenue and expenditures
Figure 25 - Capital expenditure in Nigeria
Source: IMF
DANGOTE CEMENT PLC COMPANY REPORT
0% 20% 40% 60% 80% 100%
Liberia Congo, Rep. Cameroon Tanzania Ghana Nigeria Zimbabwe Niger Mali Senegal Nepal Vietnam China Egypt
has dropped 43% yoy in 2015, representing now only 15% of the annual budget, against a four-year average of 28%. Total expenditure is also expected to contract by 1% to NGN 11,136bn, representing 11% of GDP, against an average of 14% during 2011-2014 and should keep around 11% or 12% until 2020.
All three tiers of Nigerian government (local, statal and federal) have been afected, causing delays or even the cancelation of several public construction projects, an important source of revenue for the cement industry. The financial situation is so fragile, that in some states, the state is owing salaries to public servants for more than 6 months. To worsen the scenario, JPMorgan has recently ejected Nigeria from its government bond index due to inexistence of a fully functional forex market and limited transparency. This decision can not only cause significant portfolio outflows, but it can also increase government borrowing costs, adding extra pressure on the fiscus.
Another factor that contributed to the economic growth slowdon in Nigeria is the
erratic energy supply, that affects the supply of electric energy, with population
connected to the electric grid experiencing some type of problem 60% of the times, according to Aliyu, Ramli & Saleh, (2013), and the natural gas supply. Although 2015 was not as problematic as the previous year, disruptions in gas supply should continue to affect the country over the next few years, given the deficiencies of the production and supply infrastructures. The cement industry is particularly sensitive to this issue, considering the significantly higher costs of gas alternatives. Furthermore, gas contracts are linked to US dollar, leaving cement companies vulnerable to naira devaluation.
Security risk is also a threat to development and investment in Nigeria with the
terrorist group Boko Haram continuing to strike terror in the country, specially in the north-east region. Furthermore, there are some growing concerns about a potential instability in the Niger Delta, caused by a resurgence in Igbo nationalism, a movement that tried to split Nigeira in the 60s. Although there is not a clear problem in the Delta yet, a potential conflict represents a more serious economic threat than Boko Haram, given the oil fields and other natural resources that can be found in the region. For all these considerable security issues, Nigerian political risk is classified as Moderate by NKC African Economics, an intermediate classification in a five level (low, low to moderate, moderate, moderate to high and high) political risk index of african countries.
In the long-term, Nigeria’s success will depend on the growth of non-oil sectors, that have been presenting encouraging growth, and the country’s ability to become less dependent on the oil industry. In spite of all these challenges, the long-term
macroeconomic outlook is still robust and fairly positive for cement producers like
30% 35% 40% 45% 50%
140 190 240 290
2011 2012 2013 2014 2015 2016 2017 2018 2019 2020 2021 2022 2023 2024 Source: NKC African Research
Source: World Bank
Figure 29 – US dollar/ Nigerian Naira exchange rate
Source: Bloomberg
Figure 30 - Percentage of paved roads by country
Source: CIA World Factbook
Figure 27 - Political Risk by country
DANGOTE CEMENT PLC COMPANY REPORT
0.0 2.0 4.0
Ethiopia Nepal Kenya Angola Cameroon Zimbabwe Morocco Tunisia Uzbekistan Middle East & …
China South Africa 0 100 200 300 400 500 600 700 800 900 Tu rk e y Vi et n a m Ir a n Al g e ri a Eg yp t Ir a q Ru ss ia Mo ro cc o Ga b o n Br a zi l Bo ts w a n a In d o n e si a So u th A fr ic a Gh a n a Se n e g a l Co n g o Pa ki st a n Ni g e ri a Ca m e ro o n Za m b ia Ke n ya Turkey Vietnam Iran Algeria Egypt Iraq Russia Morocco Gabon Brazil Botswana South Africa Ghana Congo Nigeria Kenya 0 100 200 300 400 500 600 700 800 900
0 2,000 4,000 6,000 8,000 10,000 12,000 14,000
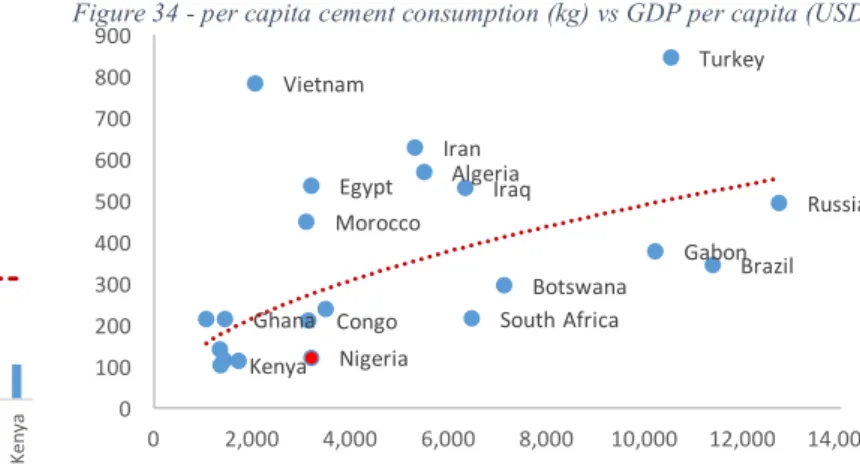
Dangote Cement. It’s true that the recent IMF estimates are more pessimist than before, however, a projected CAGR of 4.71% until 2020 for GDP growth is still positive and, allied with a fast-growing population, should increase the demand for not only public investments but als o for particular homes, as households income increases. This relationship between GDP growth and cement consumption is particularly evident in emerging markets with very low initial GDP and cement consumption levels, like Nigeria. The data suggests that in initial development phases, there is a exponential increase in demand for cement, that slows down as GDP continues to increase to higher levels. In addition to expected economic growth, political will to increase public investment should drive cement consumption upwards. The current government was elected on the promise to increase investment in infrasctucture where Nigeria has a clear deficit, that becomes particularly evident when analyzing infrastructure indicators like energy consumption per capita or percentage of paved roads in the country, where Nigeria falls behind other comparable countries. In line with this indicators is per capita cement consumption in Nigeria, that according to the Global Cement Report2, was around 122kg in 2014, well below the global average (without China) of 450kg and other fast-developing african economies like Morocco (449kg), Algeria (568kg) or even Ghana (214kg).
All these factors indicate that although in the short-term, the macroeconomic situation is challenging for cement manufacturers, in the long-term, the market has potential to continue its growth path that has been doing for the last decade, in which it grew at an aproximate CAGR of 10%. Dangote’s management and some industry analysts believe that the market can achieve these growth rate levels again in the medium to long-term, once the current macroeconomic challenges are overcome.
2 Global Cement Report, 11th Edition
Figure 32 - Power consumption per capita (Kwh'000)
Source: US Energy Information Administration
Figure 33 - Per capita cement consumption in 2014 (kg)
Figure 34 - per capita cement consumption (kg) vs GDP per capita (USD)
Source: Global Cement, Comopany Data, Exotix Equities research
Source: Global Cement, Comopany Data, Exotix Equities research -10.00% -5.00% 0.00% 5.00% 10.00% 15.00%
Real Estate Info & Com. Trade Manufacturing Crude Oil & Mining Agriculture
DANGOTE CEMENT PLC COMPANY REPORT
Dangote Cement 61%
Lafarge Africa 20% UNICEM
10% CCNN
2% Edo cement
1%
Purecem 1%
Ibeto Group 6%
•
Market & Competition
The Nigerian cement industry is highly concentrated. In 2014 the two major producers, Dangote Cement Plc and Lafarge Africa Plc (a subsidiary of Lafarge Holcim), accounted for 81% of total cement production and 91% of the 38.4mtpa of installed capacity in the country. Between the two competitors, Dangote is the largest player, having achieved in 2014 a market share of 60.5%, against 20.2% of Lafarge Africa, already considering the integration of Ashaka Cement, which used to be the fourth largest producer in Nigeria and was recently acquired by Lafarge. In the first 9 months of 2015, and according to DCP’s management, the company has been able to increase even further its market share, to around 64%, although it is not possible yet to confirm this data as the other competitors didn’t disclosure such information. The other significant players in the Nigerian cement industry are: (1) United Cement Company of Nigeria Limited (UNICEM), an associate company of Lafarge that registered a market share of 10% in 2014; (2) Cement Company of Northern Nigeria (CCNN), a subsidiary of the BUA Group, with 2.2% market share; (3) Edo Cement that reached a share of 1% and is another subsidiary of BUA Group and (4) Ibeto Group, that despite not having any production plant, recorded a share of 5.6% market share, due to a waiver to import cement that was granted by court.
Although the cement industry can be analysed at a national level, it is, in fact, more of a sum of smaller regional markets. The considerable size of Nigeria, allied with a poor road network and the specifications of transporting cement, drive the transportation costs up, promoting regional markets around the locations of cement plants. For example, Dangote, with the Obajana plant located in Kogi State, has been especially dominant in the north central region of Nigeria. More recently, with the expansion of the Ibese plant it is also challenging Lafarge’s historical dominance in the south west, where it has 3 plants. However, with the recent acquisition of AshakaCem and the participation in UNICEM, Lafarge has extended its operating range to the north-east, south-east and south-south. In the north-west, the lack of competition and the remoteness of the region, make CCNN the dominant player.
As already mentioned, the Nigerian cement market has been facing some challenges, consequence of the current macroeconomic situation in the country. After a year of stagnation, in 2014, in the first 9 months of 2015, the market has declined by 3.09% yoy, based on the data reported by local companies, a decline even more accentuated than in previous quarters (1Q15: -1.8%; 1H15: -2.7%).
71% 13%
6% 1%
8% 0%
0 10 20 30 40
0% 20% 40% 60% 80% Dangote Cement
Lafarge Africa UNICEM CCNN Edo cement Purecem
Figure 36 - Market share in Nigerian cement industry
Source: Companies data
Figure 35 - Share of installed capacity in Nigeria by company
Source: Companies data
Figure 37 - Nigerian cement market volume (mtpa) and per capita cement consumption (kg)
Source: Companies data, Analyst estimates
97 107 126
115 125 143
0 50 100 150 200
0 5 10 15 20 25 30
2009 2010 2011 2012 2013 2014 2015 2016 2017 2018 2019
DANGOTE CEMENT PLC COMPANY REPORT
Having these indicators in consideration, we estimate that total cement volumes in 2015 will decline around 3.5% to 20.6 million tonnes, corresponding to a per capita cement consumption of 115 kg. After this period of contraction, the general expectation of companies and industry analysts is that the market will start to recover in 2016. We estimate that in an initial phase, growth will be slower, with CAGR of 7% until 2017 and 10% between 2017-2020, corresponding to a growth rate of 8,8% pa for the entire period (2015-2020). Although this growth may seem excessive given the current situation, these rates are actually in line with the growth observed in the past in Nigeria (2010-14: 8% pa; 2004-2014: 10% pa), and in fact, we estimate that per capita consumption of cement (PCC) will only get back to 2013 levels in 2018! In this way, we believe that Nigeria has macroeconomic fundamentals in the medium to long-term to support this growth.
The cement market contraction since 2013 allied with continuous capacity expansions by all players in the industry, especially Dangote, over the last few years, created a significant gap between consumption and installed capacity in Nigeria. According to our estimates, in 2015, excess cement production capacity will amount to 20.75mtpa, corresponding to a utilization rate in the industry of just 50%. Even if we do not consider new investments that are already underway, our estimates for market growth point to a utilization rate of 58% in 2017. The utilization falls to 53% if a 2.5mt expansion by UNICEM is taken in consideration. To have an idea, to achieve a utilization rate of 70% in 2017, the market would have to grow at a CAGR of 19%, an impossible scenario given the current macro situation. Excess installed capacity is particularly problematic to Dangote, that has more than 70% of industry’s production capacity and recorded in 2014, a utilization rate of just 44%, below industry’s average.
A natural consequence of excess installed capacity in the industry is the increase
in competition. The first sign of a more aggressive competition in the industry was
given by Dangote in September 2015 when it announced a 18% cut in cement prices, dropping the price of a 50kg bag from NGN 1,666 to NGN 1,366. Being a price-maker in the industry, DCP forced is competitors to follow its price cut, with Lafarge decreasing its prices by 17%. With this strategy Dangote is trying to increase its volumes and market share in Nigeria and also to stimulate cement consumption. Although DCP’s management expects that this strategy will already significantly impact volumes in 4Q15, we have doubts that a price incentive will boost consumption, as a regression analysis conducted by SBG securities3 in the Nigerian market supports. The study found a very week relation between cement price and demand, with a Rsquared of just 1,3%. In this way, we believe that
3 SBG Secutirites, Macro fundamentals still supportive, August 2014
0% 20% 40% 60% 80% 100% 120%
-5 0 5 10 15 20 25
2009 2010 2011 2012 2013 2014 2015
0 400 800 1200 1600 2000
Aug-15 Sep-15 Oct-15 Dangote Lafarge
19,000 22,000 25,000 28,000 31,000 34,000 37,000
3Q
12
4Q
12
1Q
13
2Q
13
3Q
13
4Q
13
1Q
14
2Q
14
3Q
14
4Q
14
1Q
15
2Q
15
3Q
15
Figure 38 - Excess installed capacity and utilization rate in Nigeria (mtpa)
Source: Companies data, Analyst estimates
Figure 39 –Price of a 50kg cement bag in Nigeria
Source: Companies data, Analyst estimates
Figure 40 - Revenue per ton in Nigeria
DANGOTE CEMENT PLC COMPANY REPORT
although prices will remain low, they will not decrease in the following years. Moreover, being Dangote the industry leader in market share, and the most cost-efficient company in Nigeria, and having the higher profitability margins, other players don’t have the incentive to decrease prices further. Considering the experience of other countries, like Pakistan, where a price war than began in 2009 ended up being prejudicial for all companies in the industry, and only ended when all cement manufacturers agreed to decrease production, we don’t believe that Dangote will reduce its prices further, hurting its margins. Instead we believe that companies will try to increase its exports to neighbouring countries with a cement shortfall. This was the case of Turkey, when in 2009 the cement market achieved a utilization rate of just 45%, increasing competitive pressure and pushing local price down. In response, companies betted on exports rather than competing in prices. As a result, and although local prices remained low, Turkey ended up as the largest cement exporter in the planet.
During this period of price volatility, it will be imperative an efficient cost
management in order to protect margins. As already mentioned, the cement
industry’s operating expenses are highly dependent on energy costs. In this way, and since disruptions in natural gas supply are likely to continue, the right choice of alternative fuels will be critical. Industry players, especially Dangote and Lafarge, have been adapting their factories to run on coal instead of the much pricier LPFO in case of gas failure. This energy source is particularly advantageous to AshakaCem (now owned by Lafarge), given its proximity to coal quarries. The company was able to reduce its costs per tonne around 20% over the last couple of years. Even so, in terms of costs, Dangote Cement is clearly the most efficient player in the market, taking advantage of cheaper gas contracts and newer facilities and technologies. This gives a decisive advantage against Lafarge, that currently has production costs per ton 70% higher than DCP.
DANGOTE CEMENT PLC COMPANY REPORT
xtra life, xtra yield”, and as recently hired a marketing executive from Coca-Cola to lead the company’s marketing strategy. Contrary to Dangote, that is only offering 32.5 and 42.5 grade cement, Lafarge is investing in innovative products, designed for industry-specific uses. If this strategy is well implemented and proves to be successful it will be a major differentiator between Lafarge and Dangote, that is years behind in terms of R&D.
Dangote and Lafarge also have opposite strategies in terms of distribution. DCP has opted to concentrate all its production in central and south-west Nigeria, from where it plans to transport cement not only to other regions in Nigeria but also to other countries like Ghana, taking advantage of its fleet of more than 6,000 trucks. On the other hand, Lafarge, mainly through acquisitions, now operates smaller plants over a wider area, from south-west to north Nigeria, in regions where it had low penetration before. Again, if this strategy is well implemented and Lafarge continues its expansion to other areas, it may difficult Dangote’s distribution given the high transportation costs of cement. Cost efficiency of DCP’s distribution and of Lafarge’s plants will be critical for the strategies’ success.
Finally, one key aspect that has stimulated companies to invest in new capacity and that may impact future investments if reverted is the tax holiday conceded to new cement capacity. This incentive was initially created to boost Nigeria’s cement production when it was a cement importer. Today, with the excess installed capacity in the industry and the fiscal pressure, there is the risk that the new government may review this law, which would have implications for future investments in the country. Nevertheless, companies’ administrations appear to be confident that the tax incentive will continue, although the new government has not taken a clear position yet.
•
Value drivers & Forecasts
DANGOTE CEMENT PLC COMPANY REPORT
1. Market share- as we have discussed, gaining market share in Nigeria will be
critical for industry players to avoid high levels of capacity underutilization. We’ve assumed a market share of 60.56% in 2015 and 63% over the forecast period in line with the 64% achieved in 9M2015 that already reflected Dangote’s new pricing strategy. Dangote’s competitors response to the price cut should diffcult gaining additional market share. Our assumptions correspond to a volume of 12.5 mt in 2015 (-3.5% yoy) and 14.8mt in 2017 and CAGRs 9.5% from 2015 to 2024.
2. Cement price- with the recent 18% price cut in prices, we’ve decreased
revenue per ton in 2015 for NGN 30,644, which corresponds to NGN 1,360 per every 50kg bag sold in the last quarter. This is still a relatively high revenue/ton (+6% yoy) due to the high prices charged before September. The full effect of the price cut will only be felt in 2016, when we expect the 50kg bag price to remain unchanged, corresponding to NGN 27,200 per ton. Increasing competitive pressures should keep prices in low levels over the next few years, with our forecasts pointing to NGN 27,472/ ton in 2018. These estimates are also supported by historical movements in cement price in Nigeria. In fact, although inflation in the country was on average 9.7% pa between 2011 and 2015, cement prices in Naira terms, remained unchanged during the same, even without accounting with the price cut.
3. Cash costs per ton- efficient cost management will be decisive to remain
competitve in the market. Without any major energy supply crisis like in 2014, we expect cash costs per ton to decrease 15% yoy in 2015, in line with the 9M 2015 results. The full effects of new coal mills in Obajana and Ibese and the complete energy readaptation of Gboko should begin to be felt in 2016. We forecast that cash costs will continue to decrease until 2018 at na average of 1% pa.
4. Direct deliveries- Dangote’s strategy for Nigeria depends on the distribution
from its plants, in the south, to other regions and potentially to neighboring countries. According to the management, 60% of current deliveries are made directly to the final customer by truck. In our view, increase in competition, particualrly Lafarge’s regional expansion, will oblige Dangote not only to increase its share of direct deliveries, but also to expand its delivery range to protect its market share. Thus, we predict that not only the share of direct deliveries will increase (62% in 2015 to 70% in 2018), but also, haulage costs per ton will rise over the forecast period.
5. Advertising expenses- as already mentioned, we believe that in order to
DANGOTE CEMENT PLC COMPANY REPORT
increase from 1.0% in 2015 to 2.0% between 2016-18. After this period, as the macroeconomic situation improves, advertising expenses will return to their previous level of 1.0%.
South & East Africa
Dangote cement is currently operating in four countries in South & East Africa: (1) South Africa, (2) Ethiopia, (3) Zambia and (4) Tanzania. The presence in countries within the COMESA free trading area (Ethiopia and Zambia) can facilitate potential future exports for neighboring countries. An intention to expand to Kenya and Zimbabwe in 2018 was announced in September, however we’re not considering these markets for now since construction has not been comissioned yet.
One attractive factor in the region for the cement industry is the existence of vast limestone reserves needed for integrated plants. On the other hand, the geographic proximity to the Indian Ocean facilitates the import of low cost cement from Asia, increasing competitive pressure. To avoid this situation, Dangote strategically built its facilities in inland areas, away from the imported cement threat, with the exception of Tanzania.
§
Macroeconomic and political scenario
South Africa
South Africa (SA) is one of the less rapidly growing economies in Sub-Saharan
Africa, recording a real GDP growth of just 1.53% in 2014, the lowest since the
financial crisis affected the country in 2009. The situation should even worsen this year, with the IMF reviewing downards its growth estimates to 1.4% and 1.3% in 2015 and 2016 respectively. Growth is then expected to recover in 2017, to 2.1%. The miners five months strike in 2014, the largest industrial action since the apartheid, was the main contributor for the unimpressive growth that year. Since then, the weak demand from two of South Africa’s main trade partners, European Union and China, allied with an inadequate energy supply and political uncertainty in key areas like agriculture have been slowing down local economy.
All these economic indicators may not seem promising for the cement industry, but there is still room for growth. In fact, according to companies’ data, the cement market, in quantity terms, has grown at higher rates than GDP over the period
-2.00% -1.00% 0.00% 1.00% 2.00% 3.00% 4.00%
0 1000 2000 3000 4000 5000 6000 7000 8000 9000
GDP per capita ($) Real GDP growth (%)
g = 1.6%
46 48 50 52 54 56 58 60 0 100 200 300 400 500 600 700
Figure 41 - Per capita cement consumption (kg)
Source: Global cement
Figure 42 - GDP per capita in South Africa (USD) and real GDP growth
Source: IMF
Figure 43 - Population in South Africa
Figure 44 - Political risk by country
DANGOTE CEMENT PLC COMPANY REPORT
2011-14 (5% pa), and estimates predict that this trend will continue. Moreover, and despite the economic challenges, the federal government intends to invest ZAR 827bn in public infrastructures, to addres the country’s infrastructure deficit. Although this deficit may not be so severe as in other African countries, South Africa still has a per capita cement consumption, in 2014, of just 215kg (about half the global average) and only 22% of its road network its paved, low even comparing to other developing nations.
Ethiopia
Ethiopia is among the five fastest growing economies in the world according to the IMF ranking. The country has experienced real GDP CAGR of 10.1% over the 2008-2014 period, and the IMF expects that this growth will continue at CAGR of 7.7% until 2020. 2015 should be the 12th consective year of economic growth in the country, with the economy growing 8.67%.
Cement market growth as also been robust in the country, with an average volumes growth rate of 14% pa between 2011 and 2013, according to the Global Cement Report. The inclusive and widespread economic development the country is currently experiencing should drive up private cement consumption, and continue to increase per capita cement consumption, that reached, according to our estimates, 113kg in 2015, a 62% increase since 2013 (70kg). In addition, the government should keep its heavy public investment, with capital expenditure around 10% of GDP, particularly in hydro-electric infrastructures, which will increase the demand for higher-grade cement, like Dangote’s 42.5R.
In terms of political and security risk, the biggest threats to stability in Ethiopia are the tensions with Egypt around the construction of the Great Ethiopian Renaissance Dam in the Nile River and an old border conflict with Eritreia.
Zambia
Zambia’s economy has experienced a robust growth over the last decade, with real GDP CAGR of 7.5% during the period 2008-14. IMF estimates that, although economic growth will continue, there will be a slowdown (CAGR 2015-20 of 6.0%) that has already begun, with GDP growth rate falling from 5.63% in 2014 to “just” 4.28% on 2015. This deceleration is the result of several exogenous shocks that hit the country during the year and that exposed Zambia’s economy main fragilities: (1) vulnerability to trading partners’ economic cycles (especially China and Switzerland); (2) dependence on copper for exports and FDI. So, the combination, in 2015, of an accentuated copper price drop and a decrease in demand from China, weighted heavily on the Zambian economy.
00% 05% 10% 15% 20% 25% 30% 35%
7.50 8.00 8.50 9.00 9.50 10.00
ETB/NGN CPI inflation (%)
g = 1.6%
75 80 85 90 95 100
Figure 47 - Population in Ethiopia
Source: IMF Source: IMF
Figure 48 –ETB/NGN exchange rate and inflation rate in Ethiopia
Figure 45 - ZAR/NGN exchange rate and inflation rate in South Africa
3% 4% 4% 5% 5% 6% 6% 7%
10.00 12.00 14.00 16.00 18.00 20.00 22.00
2011 2012 2013 2014 2015 2016 2017
ZAR/NGN CPI inflation (%)
0.00% 2.00% 4.00% 6.00% 8.00% 10.00% 12.00%
0 200 400 600 800 1000 1200
GDP per capita ($) real GDP growth (%)
Figure 46 - GDP per capita (USD) and real GDP growth in Ethiopia
DANGOTE CEMENT PLC COMPANY REPORT 0.00% 2.00% 4.00% 6.00% 8.00% 10.00% 10.00 15.00 20.00 25.00 30.00
ZMK/NGN CPI inflation (%) 3.00% 5.00% 7.00% 9.00% 11.00% 0 500 1000 1500 2000 2500
GDP per capita ($) real GDP growth (%)
The worsening of the economic prospects, allied with the threat of thousands of job losses in the mines and a power crisis caused by drought, have deteriorated the social environment in Zambia and increased political risk in the country. Despite these challenges, the sound economic growth expectations and the government commitment to invest in roads and energy infrastructures present opportunities for the cement industry. The market as more than doubled since 2010, increasing from 0.7mt to 1.5mt in 2014, placing per capita cement consumption around 110kg which is low even for developing economies.
Tanzania
Tanzania is expected to grow 6.87% in 2015, a value in is line with the 6.5% CAGR registered between 2008 and 2014. The IMF expects an acceleration in the next years, with 7.04% predicted growth in 2016 and a CAGR of 6.9% until 2020. Like other countries in the region, the Tanzanian shilling has been under tremendous pressure in 2015, reaching a devaluation of 37% against the dollar between January and July. Since then, the shilling has recovered, being the total devaluation against the Naira of 12% since January.
Strong economic growth, natural resources, geographical location and political stability have made Tanzania an attractive destination for foreign investment in Africa. FDI projects and the government’s infrastructure investment program, should keep driving up the demand for cement in the country, that currently has a very low per capita cement consumption (74kg in 2014). However, the market has registered volume growth rates around 8%pa from 2010 to 2013, a growth that local manufacturers believe will continue also supported by a fast-growing population.
§
Market & Competition
South Africa
Dangote operates two 1.5mtpa plants in South Africa, one integrated and one grinding unit, through Sephaku Cement (SepCem) a joint-venture with JSE-listed Sephaku Holdings which owns 36% of the project, with Dangote owning the remaining 64%. There are currently five competitors present in the market: (1) Pretoria Portland Cement Limited (PPC), (2) Lafarge Industries South Africa Limited, (3) AfriSam Proprietary Limited, (4) NPC-Cimpor Limited and (5) Continental Cement, a new entrant. PPC is currently the market leader both in terms of market share and installed production capacity, with more than 5.3mtpa, followed by Lafarge with 3.6mtpa. Similar to other countries in the region, imports from Asia represent na important share of cement consumption. Recently there
g = 3.3%
5 10 15 20
Figure 11 - Copper price
Source: Bloomberg
Figure 51 – Population in Zambia
Figure 49 - GDP per capita (USD) and real GDP growth in Zambia
Source: IMF
Figure 52 - ZMK/NGN exchange rate and inflation rate in Zambia
Source: Bloomberg, IMF and analyst estimates 170 190 210 230 250 270 290 310 330 350 Jan -14 Ma r-14 Ma y-14 Ju l-14 Se p -14 No v-14 Jan -15 Ma r-15 Ma y-15 Ju l-15 Se p -15 No v-15 Source: IMF
Figure 50 – Copper prices
DANGOTE CEMENT PLC COMPANY REPORT
0.00% 5.00% 10.00% 15.00% 20.00%
0.08 0.09 0.09 0.10 0.10 0.11 0.11
2011 2012 2013 2014 2015 2016 2017 2018 2019 2020
TZS/NGN CPI inflation (%)
were some news reporting a merger between PPC and AfriSam, but the deal has been cancelled.
Despite the modest performance of South African economy in general, and the cement industry in particular, Dangote made a particularly successful entry, and according to management’s estimates already achieved close to 15% market share in 9M 2015. DCP’s entry increased even further the competitve environment in the market leading to a 2% decrease on average selling prices. Dangote’s efficient production allied with a better quality cement offering and a strong sales and marketing strategy have been crucial.
Ethiopia
The Ethiopian market is very competitive, with a total of 15mtpa distributed across several operators, namely: (1) Addis Ababa Cement, (2) Mugher Cement, (3) Ethio Cement and (4) Derba Cement. Dangote operates since June 2015 one unique integrated plant with 2.5mtpa production capacity.
Although the Ethiopian cement market has experienced considerable growth and presents an optimistic outlook, the expected cement demand of 10mt is considerable below installed capacity, creating additional pressure for market share. With this objective, and in line with the strategies adopted in Senegal and South Africa, Dangote entered the market with a price cut relative to average prices in the country. This alowed DCP to gain immediate market share, with the integrated plant already running close to maximum capacity in September 2015. This was only possible due to Dangote’s newer and more efficient technologies, comparing to its sub scaled competitors.
Zambia
Although there are four cement manufacturers operating in the country, Dangote’s main competitor, similarly to other markets, is Lafarge with 1.3mtpa installed capacity in the country. As in Ethiopia, DCP has made a strong entry in Zambia, with its 1.5mtpa integrated plant having already a 65% utilization rate in the last month of 9M 2015. This has been particularly challenging for its competitors, with Zambezi Portland Cement’s operations director even saying that his company has been losing money per cement bag since DCP arrived at Zambia.
Zambia can be a key growth market for Dangote, not only for the projected national growth but also for being a member of COMESA and an inland country with easy acces to other fast growing markets like the Democratic Republic of Congo. Cement price in the country is currently among the highest in the region (USD 130/ ton).
g = 2.0%
35 40 45 50 55
Source: IMF
Figure 54 - Population in Tanzania
Figure 55 - TZS/ NGN exchange rate and inflation rate in Tanzania
Source: Bloomberg, IMF and analyst estimates
3.00% 4.00% 5.00% 6.00% 7.00% 8.00% 9.00%
0 200 400 600 800 1000 1200 1400
GDP per capita ($) real GDP growth (%)
Figure 53 - GDP per capita (USD) and real GDP growth in Tanzania
DANGOTE CEMENT PLC COMPANY REPORT
Tanzania
Dangote has recently inaugurated its 3mtpa integrated plant in Mtwara that should start operating in December 15 or January 2016. With this factory, Tanzania doubles its total production capacity to 6mtpa. Before DCP’s entry in the market, the 3mtpa capacity was divided between 5 players, with the two largest being (1) Tanzania Portland Cement and (2) Mbeya Cement, subsidiaries of two cement giants, Heidelberg Cement and LafargeHolcim, respectively. Just like in Ethiopia and Zambia, Dangote will bet on 42.5R grade cement to differentiate, and we expect another aggressive pricing at entry that should lower current average price in the country (USD 124). In response to DCP entry in the country, the two main competitors are already planning capacity expansions. Tanzania’s sound economic development and its strategic location within the COMESA, make it one of the most attractive nations in the region for the cement industry.
•
Value drivers & Forecasts
Although we are aware of Dangote’s expansion plans in the region (additional 1.5mtpa in Zambia and 2.5 in Ethiopia), again we’re just considering projects that are already being developed. For these, we’ve estimated what we believe will be the key value drivers in the future: (1) Utilization rates, (2) Cement Prices and its evolution and (3) Cost of sales, administrative and selling costs.
1. Utilization rates- for FY 2015 our utilization rates are in line with the 9M 2015
results. Having in mind that, according to management, plants in South Africa and Ethiopia were already close to full capacity and Zambia was also performing strongly in the last months of the 3Q, we estimate utilization rates over the period of 70%, 65% and 55%, respectively. It’s worth mentioning that for Ethiopia and Zambia we’re just considering 50% of the annual capacity, since both plants were inaugurated in June 2015. The cement factory in Tanzania is expected to start contributing to sales in January 2016. In this way, we expect an annual utilization of 60%. For all the four plants, we’re assuming that its utilization rate will increase gradually until it reaches a peak of 95% in the third complete year of production. Our estimates for the region point to volmues sold of 3.3mt in 2015 and 9.5mt in 2019, corresponding to a CAGR of 29%.
2. Cement prices- our revenue’s estimates are based on price data collected in
DANGOTE CEMENT PLC COMPANY REPORT
competitive pressures should keep prices low over the first years of DCP’s operations. After that period we assume prices rise with inflation until the end of the forecast.
3. Cost of Sales, Administrative and Selling expenses- due to lack of detailed
information on the expenses outside Nigeria, we forecast costs for W&C Africa and S&E Africa together. Cash cost per ton were in 2014 NGN12,259, a value we expect to decrease as new firms pass the ramp up phase and begin to operate at maximum efficiency. Thus, we expect a continuous drop in cash costs per ton at a CAGR of -3% until 2017. Cash costs in new markets will however continue to be significantly higher than in Nigeria, where Dangote is particularly efficient. Like in Nigeria, we believe that the increasingly competitive environment in Africa will force Dangote to increase expending in advertising, which we expect to be 1% of revenue in 2015 and 2.5% between 2016 and 2018 and then will return to 1.5%. Dangote’s distribution in the majority of markets outside Nigeria passes by delivering directly to customers, eliminating distributors. This type of strategy demands a exhaustive utilization of DCP’s fleet. Haulage costs per ton are currently NGN2,357 and we expect these costs to increase over time as Dangote begins to distribute cement over wider areas within the countries and to neighboring nations. As for the administrative expenses, we believe they will keep in line with 9M 2015 results, at around 7.5% of revenues.
West & Central Africa
Dangote’s current operations in the region include: an import terminal in Ghana, a grinding plant in Cameroon and an integrated unit in Senegal. In addition, grinding plants in Côte d’Ivoire, Ghana and Rep. of Congo and an import terminal in Liberia should open over the next couple of years. Plans for grinding plants in Mali and Niger were also announced recently.
Unlike Southern Africa, West and Central Africa offers very little limestone reserves viable for integrated facilities, and so Dangote strategy is to transport clinker from Nigeria and Senegal to the other facilities, taking advantage of free trade areas like ECOWAS and CEMAC.
§
Macroeconomic and political scenario
Ghana
Political stability and the discovery of oil created conditions to continuous economic growth in Ghana over the last years. National economy grew at a CAGR of 7.8% from 2008 to 2014 and the IMF predicts that this trend will continue at a 6.2%
0.00% 2.00% 4.00% 6.00% 8.00% 10.00% 12.00%
0 500 1000 1500 2000 2500
GDP per capita ($) real GDP growth (%)
Figure 56 - GDP per capita (USD) and real GDP growth in Ghana